
1. Background
COVID-19 is a respiratory illness caused by the novel coronavirus, SARS-CoV-2, and was classified as a pandemic in 2019. The virus primarily affects the lungs, causing a range of respiratory symptoms from mild to severe. The severity of lung involvement in COVID-19 is determined by the extent of lung damage caused by the virus. Mild cases may present with symptoms such as fever, cough, shortness of breath, and fatigue, similar to other diseases caused by coronaviruses (1, 2). Severe cases may lead to life-threatening conditions like acute respiratory distress syndrome (ARDS) and even death. Other symptoms of severe COVID-19 include dyspnea, hypoxemia, lymphopenia, thromboembolism, and nervous system disorders (3-5). Liver and renal function disorders, thrombocytopenia, and elevated levels of ferritin, interleukin-6, and C-reactive protein are also observed in severe cases (6). Most severe cases present with ARDS, which is characterized by bilateral lung infiltration, severe hypoxemia, and pulmonary edema (7). The most significant complications of severe COVID-19 are cardiovascular and interstitial lung diseases (8). Early detection and treatment of COVID-19 can help reduce the risk of severe complications and improve patient outcomes (9). Treatment strategies differ for mild and severe COVID-19 cases, with severe cases often requiring intensive care unit (ICU) admission (10).
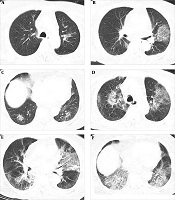
CT scans can be useful in diagnosing COVID-19 and monitoring disease progression, but they should be used alongside other diagnostic tools (11, 12). COVID-19 patients exhibit different CT scan findings depending on the severity of their disease. In mild cases, CT scans may show minimal changes, such as ground-glass opacities (GGO) or small patches of inflammation in the lungs (13, 14). In more severe cases, CT scans may reveal extensive lung damage, with large areas of consolidation and severe GGOs. Bilateral and peripheral GGOs are the most common CT scan findings in COVID-19, appearing as areas of increased opacity in the lung tissue that look hazy or cloudy. In more severe cases, consolidation is commonly observed, characterized by the filling of air spaces in the lung with fluid or pus.
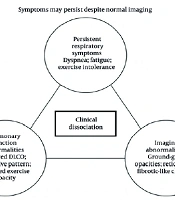
As COVID-19 is a novel illness, its long-term outcomes, prognosis, and risk factors are not yet fully understood. COVID-19 patients may experience lingering symptoms long after recovery. Studies show that pulmonary dysfunction, such as reduced FEV1/FVC and DLCO, is common in COVID-19 patients following recovery (15). Previous studies have also indicated that about half of the patients exhibit lung involvement on imaging six months post-infection, accompanied by symptoms like dyspnea, fatigue, and renal complications (8, 16). Psychological disorders are another common issue for COVID-19 patients after recovery, with many experiencing varying degrees of mental health disorders (17, 18).
2. Objectives
In this study, we aim to evaluate the relationship between the severity of lung involvement in severe cases of COVID-19 and patient outcomes three months after follow-up, as assessed by CT scan findings, dyspnea, spirometry results, and SpO2 levels measured with a pulse oximeter.
3. Methods
3.1. Study Design
In this prospective cohort study, we evaluated all patients diagnosed with severe COVID-19 over an 18-month period in the Intensive Care Unit (ICU) who survived the disease at Shohada-e Tajrish Hospital, Tehran, Iran. Three months after discharge, each patient was contacted for a follow-up visit at the clinic. The inclusion criteria were: (1) aged 18 - 80 years, (2) severe COVID-19 (defined as SpO2 < 90% on room air and lung involvement > 50% in the initial chest CT scan), (3) positive PCR test, and (4) hospitalization in the ICU. The exclusion criteria were: (1) patients who did not consent to follow-up and (2) patients with underlying lung disease.
All initial assessments, such as vital signs and CT scans, were performed at the start of hospitalization before any treatment was administered. We followed up with the included patients three months after discharge and evaluated dyspnea severity using the modified BORG scale (19) (Intra-class reliability of the BORG scale: 0.78, Validity coefficients of the BORG scale: 0.70), spirometry findings (assessed by a pulmonary specialist), SpO2 using a pulse oximeter (ChoiceMMed), and findings from a new chest CT scan (severity assessed by the total severity score (TSS) (11) evaluated by a skilled radiologist).
Patients were divided into two groups based on their TSS during hospitalization: Group A (TSS ≤ 7) and Group B (TSS > 7). The flowchart of the study is shown in Figure 1.
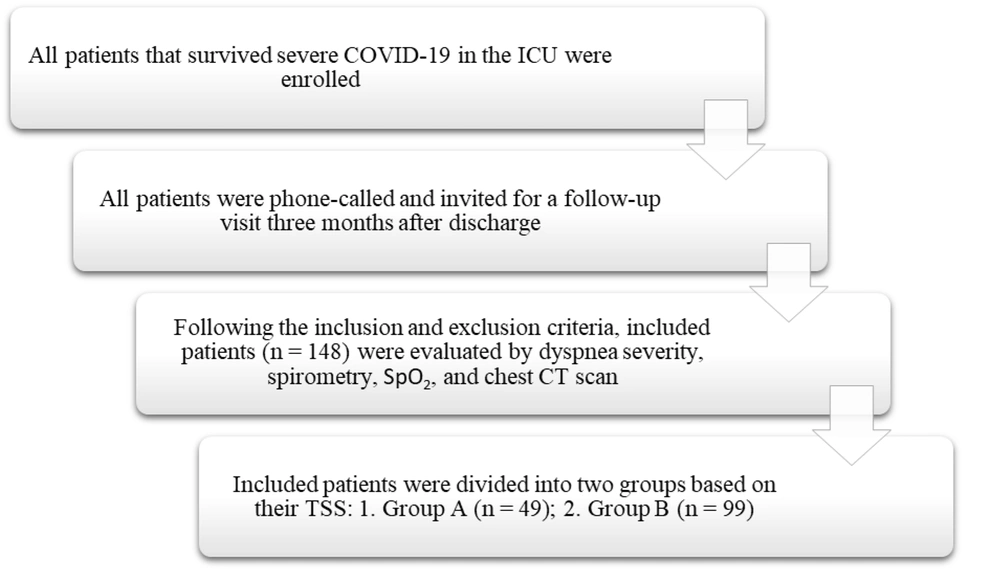
Figure 1.
Flowchart of the study
3.2. Statistical Analysis
Quantitative variables were described using mean ± standard deviation (SD), while frequency (%) was used for categorical variables. The Mann-Whitney U test or t-test was employed to compare quantitative variables between study groups. The chi-square test was used to compare categorical variables. Logistic regression models were applied to adjust for confounding factors. All analyses were conducted using IBM SPSS Statistics software, with a significance level of 0.05 considered as meaningful.
4. Results
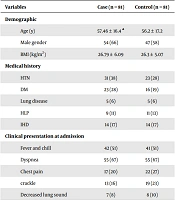
In our study, 148 patients were enrolled. Among them, 49 (33.1%) had a TSS ≤ 7 (Group A), and 99 (66.9%) had a TSS > 7 (Group B). The mean age was 54.79 ± 12.62 in Group A and 55.31 ± 12.74 in Group B, with no significant difference in age between the two groups (P = 0.78). There were 23 (46.9%) females in Group A and 39 (39.4%) females in Group B. The demographic characteristics and treatment plans of the patients are presented in Table 1.
Table 1.
Demographic Characteristics and Treatment Plans of Patients a
| Variables | Group A (TSS ≤ 7) (n = 49) | Group B (TSS > 7) (n = 99) |
|---|---|---|
| Clinical characteristics | ||
| Age | 54.69 ± 12.51 | 55.31 ± 12.73 |
| Female | 23 (46.9) | 39 (39.4) |
| Smoking | 8 (16.3) | 12 (12.1) |
| Diabetes | 9 (18.4) | 26 (26.3) |
| Anti-diabetic medication | 10 (20.4) | 26 (26.3) |
| Hypertension | 13 (26.5) | 37 (37.4) |
| Anti-hypertensive medication | 13 (26.5) | 37 (37.4) |
| Coronary artery disease | 5 (10.2) | 19 (19.2) |
| Cardiac medication | 7 (14.3) | 18 (18.2) |
| Treatment plan | ||
| Remdesivir | 48 (98) | 92 (92.9) |
| Interferon | 9 (18.4) | 11 (11.1) |
| Corticosteroid | 48 (98) | 95 (96) |
| Plasmapheresis | 2 (4.1) | 3 (3) |
| Hemoperfusion | 0 | 1 (1) |
| Non-invasive ventilation (Bi-PAP) | 20 (40.8) | 47 (47.5) |
| Intubation | 2 (4.1) | 7 (7.1) |
| Packed cells | 1 (2) | 1 (1) |
| Tocilizumab | 11 (22.4) | 29 (29.3) |
Abbreviations: SD, standard deviation; TSS, total severity score.
a Values are expressed as No (%) or mean ± SD.
Chest CT scan findings during hospitalization and after three months of follow-up are presented in Table 2. While most findings were more prevalent in Group B, none of the radiologic findings during hospitalization were significantly more common in Group B patients. However, tractional bronchiectasis and reticulation were significantly more common in Group B during the follow-up period.
Table 2.
Chest CT Scan Findings During Hospitalization and After Three Months of Follow-up a
| Variables | Group A (TSS ≤ 7) (n = 49) | Group B (TSS > 7) (n = 99) | P-Value |
|---|---|---|---|
| Findings during hospitalization | |||
| Pneumomediastinum | 2 (4.1) | 10 (10.1) | 0.207 |
| GGO | 45 (91.8) | 97 (98) | 0.075 |
| Atelectasis | 1 (2) | 1 (1) | 0.609 |
| Consolidation | 12 (24.5) | 29 (29.3) | 0.539 |
| Subcutaneous emphysema | 0 | 5 (5.1) | 0.110 |
| Other | 1 (2) | 3 (3) | |
| Findings after follow-up | |||
| Cavity | 2 (4.1) | 4 (4) | 0.990 |
| Honey combing | 2 (4.1) | 6 (6.1) | 0.616 |
| Reticulation | 25 (51) | 81 (81.8) | 0.001 |
| Tractional bronchiectasis | 2 (4.1) | 16 (16.2) | 0.034 |
Abbreviations: GGO, ground glass opacity; TSS, total severity score.
a Values are expressed as No (%).
Our study shows that the length of hospitalization was significantly longer in Group B compared to Group A (Group A: 11.92 ± 6.28 days, Group B: 14.62 ± 7.03 days, P = 0.025). Interestingly, although there was no significant difference in the dyspnea score during hospitalization, the dyspnea score during follow-up was significantly higher in Group B. Clinical complications during hospitalization and after three months of follow-up are presented in Table 3.
Table 3.
Clinical Complications During Hospitalization and After Three Months of Follow-up a
| Variables | Group A (TSS ≤ 7) (n = 49) | Group B (TSS > 7) (n = 99) |
|---|---|---|
| Complications During Hospitalization | ||
| DVT | 0 | 1 (1) |
| PTE | 6 (12.2) | 10 (10.1) |
| GIB | 1 (2) | 1 (1) |
| Renal failure | 1 (2) | 2 (2) |
| Uncontrolled diabetes | 3 (6.1) | 6 (6.1) |
| Complications after follow-up | ||
| Fungal infection | 0 | 0 |
| GIB | 0 | 0 |
| Dyspnea | 17 (34.7) | 48 (48.5) |
| Another b | 2 (4.1) | 6 (6.1) |
| Days of hospitalization; (P = 0.025) | 11.92 ± 6.28 | 14.62 ± 7.03 |
| Dyspnea score; (P = 0.18) | 8.47 ± 0.68 | 8.63 ± 1.12 |
| Follow-up dyspnea score; (P = 0.001) | 3.23 ± 0.56 | 4.23 ± 0.63 |
Abbreviations: TSS, total severity score; DVT, deep vein thrombosis; PTE, pulmonary thromboembolism; GIB, gastrointestinal bleeding.
a Values are expressed as No (%) or mean ± SD unless otherwise indicated.
b Another, includes decreased SpO2 and abnormal spirometry findings.
After comparing the vital signs of the study groups, we found that SpO2 levels both during hospitalization and after three months of follow-up were significantly lower in Group B. The vital signs of the patients are summarized in Table 4.
Table 4.
Vital Signs of The Patients a
| Vital Signs | Group A (TSS ≤ 7) (n = 49) | Group B (TSS > 7) (n = 99) | P-Value |
|---|---|---|---|
| Temperature (°C) | 36.91 ± 0.29 | 36.93 ± 0.25 | 0.94 |
| SBP mmHg | 114.94 ± 17.88 | 118.34 ± 11.78 | 0.64 |
| DBP mmHg | 72.22 ± 8.43 | 72.10 ± 7.48 | 0.52 |
| HR | 87.71 ± 11.38 | 89.81 ± 13.46 | 0.22 |
| RR | 21.08 ± 4.09 | 23.17 ± 17.22 | 0.74 |
| SpO2 | 78.04 ± 11.13 | 74.53 ± 9.19 | 0.001 |
| Follow-up SpO2 | 95.48 ± 1.55 | 94.92 ± 1.77 | 0.02 |
Abbreviations: SD, standard deviation; TSS, total severity score; SBP, systolic blood pressure; DBP, diastolic blood pressure; HR, heart rate; RR, respiratory rate.
a Values are expressed as mean ± SD.
We also compared laboratory findings, including complete blood count, inflammatory markers, troponin, creatinine, and others, in our study groups during hospitalization. Only ferritin (ng/mL) was significantly higher in Group B (Group A: 565.38 ± 258.52 vs. Group B: 995.60 ± 1511.39, P = 0.014).
After comparing the spirometry findings of the study groups during follow-up, we found that FEV1 and FVC were significantly lower in Group B. However, there was no significant difference in FEV1/FVC and FEF 25 - 75% between the study groups. The spirometry findings during follow-up are shown in Table 5.
Table 5.
Spirometry Findings During Follow-up a
| Variables | Group A (TSS ≤ 7) (n = 49) | Group B (TSS > 7) (n = 99) | P-Value |
|---|---|---|---|
| FEV1 % | 86.93 ± 14.18 | 78.70 ± 17.44 | 0.001 |
| FEV1 L | 2.8 ± 0.93 | 2.5 ± 0.82 | 0.001 |
| FVC % | 83.06 ± 13.38 | 71.82 ± 18.93 | 0.001 |
| FVC L | 2.97 ± 0.98 | 2.51 ± 0.80 | 0.001 |
| FEV1/FVC | 58.26 ± 7.59 | 87.63 ± 5.75 | 0.136 |
| FEF 25 - 75% | 96.31 ± 25.87 | 94.21 ± 29.06 | 0.438 |
Abbreviations: SD, standard deviation; TSS, total severity score.
a Values are expressed as mean ± SD.
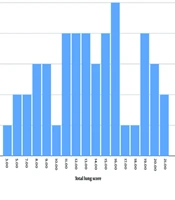
We also compared the TSS from chest CT scans during hospitalization and the follow-up visit. This comparison showed a significant decrease in TSS after three months in all patients (from 14.42 ± 5.90 to 6.68 ± 4.79; P < 0.001). Additionally, we compared TSS across different groups based on age, gender, and other variables during hospitalization and at follow-up. We found that none of the variables were associated with TSS during hospitalization. In contrast, diabetes, diabetic medication, coronary artery disease, and non-invasive ventilation were associated with higher TSS at follow-up. TSS during hospitalization and follow-up across different groups are shown in Table 6.
We were unable to analyze other supplemental oxygen therapies due to the limited sample size. Since we investigated patients at the start of hospitalization when they were not yet on oxygen therapy, comparing TSS in the hospital based on non-invasive ventilation was not feasible.
Table 6.
Total Severity Score in Hospital and Follow-up in Different Sub-groups a
| Variables (Sub-group) | TSS Hospital | P-Value | TSS Follow-up | P-Value |
|---|---|---|---|---|
| Gender | 0.4 | 6.04 ± 4.68 | 0.141 | |
| Male | 14.89 ± 5.85 | 7.22 ± 4.81 | ||
| Female | 13.77 ±5.95 | |||
| Age | 0.514 | 0.245 | ||
| 18 - 50 | 13.98 ± 5.90 | 6.04 ± 4.62 | ||
| 50 - 80 | 14.65 ± 5.91 | 7.01 ± 4.86 | ||
| Smoking | 0.455 | 0.831 | ||
| No | 14.59 ± 5.82 | 6.70 ±4.58 | ||
| Yes | 13.70 ± 6.42 | 6.95 ±6.09 | ||
| Diabetes | 0.098 | 0.017 | ||
| No | 14.24 ± 5.76 | 6.27 ± 4.61 | ||
| Yes | 15.88 ± 5.98 | 8.57 ± 4.83 | ||
| Diabetic medication | 0.112 | 0.022 | ||
| No | 14.09 ± 5.80 | 6.19 ± 4.63 | ||
| Yes | 15.64 ± 6.07 | 8.39 ± 4.88 | ||
| Hypertension | 0.106 | 0.215 | ||
| No | 13.91 ± 5.86 | 6.32 ± 4.64 | ||
| Yes | 15.58 ± 5.84 | 7.55 ± 4.98 | ||
| CAD | 0.14 | 0.037 | ||
| No | 14.20 ± 5.88 | 6.41 ± 4.53 | ||
| Yes | 16.21 ± 5.63 | 8.62 ± 5.54 | ||
| Non-invasive ventilation | 0.034 | |||
| No | 6.06 ± 4.98 | |||
| Yes | 7.52 ± 4.42 | |||
| SBP mmHg | 0.398 | - | ||
| ≤ 120 | 14.31 ± 5.92 | |||
| > 120 | 14.94 ± 5.85 | |||
| DBP mmHg | 0.325 | - | ||
| ≤ 80 | 14.40 ± 5.85 | |||
| > 80 | 15.55 ± 6.67 | |||
| HR | 0.138 | - | ||
| 60 - 100 | 14.26 ± 5.81 | |||
| > 100 | 16.33 ± 6.45 | |||
| RR | 0.373 | - | ||
| 12 - 20 | 14.14 ± 5.93 | |||
| > 20 | 14.97 ± 5.84 |
Abbreviations: TSS, total severity score; SD, standard deviation; CAD, coronary artery disease; SBP, systolic blood pressure; DBP, diastolic blood pressure; HR, heart rate; RR, respiratory rate.
a Values are expressed as mean ± SD.
Finally, after performing logistic regression, we found that non-invasive ventilation was the only factor independently associated with a higher TSS at the three-month follow-up, while other possible factors were not significantly associated. Comparing the study groups based on the use of non-invasive ventilation showed that patients not undergoing non-invasive ventilation had lower odds of having a higher TSS (≥ 7) at the three-month follow-up (OR = 0.45; P = 0.028). This finding indicates that patients who underwent non-invasive ventilation have higher odds of having a higher TSS at the three-month follow-up. The results of the logistic regression analysis are presented in Table 7.
Table 7.
Logistic Regression Analysis Results
| Variables | B | SE (B) | Odds Ratio (OR) | P-Value |
|---|---|---|---|---|
| CAD | -0.59 | 0.53 | 0.55 | 0.266 |
| Diabetic medication | -0.51 | 0.46 | 0.60 | 0.268 |
| Remdesivir | 0.48 | 0.81 | 1.61 | 0.558 |
| Non-invasive ventilation | -0.80 | 0.36 | 0.45 | 0.028 |
| GGO | -1.38 | 1.18 | 0.25 | 0.239 |
| FEV1/FVC | 0.05 | 0.03 | 1.05 | 0.057 |
| Dyspnea | 0.11 | 0.20 | 1.12 | 0.578 |
Abbreviations: CAD, coronary artery disease; GGO, ground glass opacity.
5. Discussion
The present study offers insights into the prognostic factors associated with COVID-19 patients and clinical outcomes based on the TSS. Our cohort of 148 patients revealed distinct characteristics and outcomes between two groups: Group A with TSS ≤ 7 and Group B with TSS > 7. Firstly, the prolonged hospitalization observed in patients with severe lung involvement (Group B) underscores the potential impact of a higher TSS on healthcare resources and the need for targeted interventions in managing patients with higher TSS. Existing studies have demonstrated a correlation between disease severity and extended hospital stays (20, 21).
Persistent lower SpO2 levels during hospitalization and at the three-month follow-up in Group B (TSS > 7) indicate potential long-term respiratory consequences of COVID-19 (22). The persistent elevation of dyspnea scores (based on the BORG scale) in this group during follow-up warrants careful attention to post-acute sequelae of SARS-CoV-2 infection and continued monitoring for respiratory compromise (16). A systematic review and meta-analysis showed that some complications of viral pneumonia (MERS and SARS), including dyspnea, PTSD, and reduced quality of life, can be observed up to 12 months after discharge (23). Previous studies evaluating the long-term outcomes of bacterial pneumonia have revealed that most symptoms and complications resolve after about two weeks (24-26). These findings suggest that respiratory complications from viral pneumonia may persist longer than those from bacterial pneumonia. The elevated dyspnea scores in Group B during follow-up demonstrate the need for comprehensive post-COVID care.
Ferritin may serve as a systemic inflammation marker in severe COVID-19 due to its elevated levels in Group B during hospitalization (3). Previous studies have identified ferritin as a prognostic biomarker in COVID-19 patients, demonstrating the hyperinflammatory state associated with severe disease (27, 28). Although our study showed no significant differences in other laboratory findings, multiple biomarkers have been identified as prognostic factors for severe disease, including thrombocytopenia, elevated levels of C-reactive protein and interleukin-6, and abnormal liver function tests (6).
The spirometry findings highlight the potential impact on pulmonary function. The significant reductions in FEV1 and FVC in Group B during follow-up indicate unresolved reduced lung function in cases of more severe lung involvement due to COVID-19, highlighting the need for ongoing respiratory assessments in survivors of severe COVID-19 (8). Although FEV1/FVC and FEF 25 - 75% showed no significant differences between groups, the overall reduction in lung function parameters emphasizes the importance of extended monitoring. Huang et al. and Zhao et al. have reported significant changes in DLCO in patients with severe COVID-19 that did not resolve in follow-up sessions (29, 30). There is conflicting evidence regarding changes in spirometry findings in severe disease and follow-up of COVID-19 patients (31, 32).
The notable decrease in TSS based on chest CT scans after three months suggests a positive trend in radiological resolution. Our findings align with previous longitudinal studies indicating radiological improvement over time, even in patients with initial severe lung involvement (33, 34). However, continued surveillance is necessary to assess long-term consequences and the potential for pulmonary fibrosis.
Our study identified factors associated with higher TSS during follow-up, including diabetes, diabetic medication, coronary artery disease, and non-invasive ventilation, providing clinicians with valuable insights for risk stratification (35). Notably, the exclusive association of non-invasive ventilation with higher TSS, as revealed by logistic regression, underscores the pivotal role of respiratory support in influencing long-term outcomes.
Our study had several limitations. During the COVID-19 pandemic, many patients refused to participate in follow-up evaluations due to the severity and life-threatening nature of their illnesses. Another limitation was that our study did not evaluate other possible factors and laboratory findings due to economic constraints. We suggest further studies with larger populations to better understand the correlation between lung involvement and long-term clinical outcomes in patients with severe COVID-19. To our knowledge, our study is among the first to evaluate outcomes in patients with severe COVID-19 based on their TSS by chest CT scans in this geographical region.
5.1. Conclusions
Patients with severe COVID-19 and severe lung involvement often experience multi-organ complications that may persist for a long time. Our study revealed that patients with a higher TSS in the hospital experienced a greater reduction in lung function during the three-month follow-up. Factors associated with a higher TSS at the three-month follow-up include coronary artery disease, diabetes, diabetic medication, and non-invasive ventilation. After adjusting for confounders, primary non-invasive ventilation in the ICU was the only factor independently associated with a higher TSS at the three-month follow-up.