
1. Background
Pediatric depression is one of the most important issues in the field of pediatric mental health. This disorder affects about 5% of children worldwide and threatens children’s individual, interpersonal, and academic performance (1). Additionally, this disorder places a great psychological burden on the child's family and relatives and imposes high and unreasonable costs on the healthcare system worldwide (2). These issues highlight the need for proper attention to this disorder with a multidimensional and comprehensive treatment approach. Various individual, interpersonal, and medical treatments have been identified for this disorder, with treatment using SSRIs considered the first known drug regimen (3, 4). Although SSRIs are recognized as the first-line treatment for this disorder, drug side effects, including gastrointestinal side effects and resistance to treatment, are among the limitations of using this drug group (4). Other treatments approved and used during drug resistance in adults include adding thyroid hormones, folic acid, and lithium to the SSRI regimen (5). Folic acid is one of the cofactors involved in the synthesis of brain neurotransmitters such as serotonin and dopamine, and in recent years, clinical trials have determined its effectiveness as a complementary treatment for depression in adults (3). In the child and adolescent population, although descriptive studies have shown the relationship between the lack of this vitamin and depressive symptoms, clinical trials on the effect of adding folic acid to antidepressant medication in this group of patients are limited (6). On the other hand, despite the fact that treatments such as the T4 hormone have been mentioned in treatment-resistant cases, documentation regarding the use of this supplement in the treatment of depression in the pediatric age group has not been mentioned so far.
2. Objectives
This study was conducted to investigate the effect of adding folic acid to fluoxetine in the treatment of major depressive disorder in patients less than 18 years of age.
3. Methods
3.1. Participants
According to previous studies and the difference between two means formula (α = 5%, d = 2.5, and power = 80%), 50 patients with major depressive disorder, aged between 6 and 18 years, who had at least 8 weeks of unsuccessful treatment with SSRIs and were seen in outpatient units or admitted to child psychiatric units of hospitals affiliated with Isfahan University of Medical Sciences, participated in the study.
The "Inclusion criteria" included: Diagnosis of major depressive disorder based on clinical interview and Diagnostic and Statistical Manual of Mental Disorders, Fifth Edition (DSM-5) criteria, patient and family consent, not having a chronic physical illness at the same time, and no history of drug allergy.
The "Exclusion criteria" were: Unwillingness of patients or families to continue participation in the study, the need to change the medication or use ECT due to worsening conditions of patients, and any new unexpected physical illness that could potentially change the medical care of the patient. An informed consent form was signed by parents or guardians, and assent was obtained from the adolescents. The study protocol complied with the ethical tenets of the Helsinki Declaration and was approved by the Ethics Committee of Isfahan University of Medical Sciences (IR.ARI.MUI.REC.1402.093). All contributors to this study adhered to the Helsinki Ethical principles. An online computer program using random blocks was used for randomization, and participants were randomly assigned to either the placebo or treatment group. Each patient received a fluoxetine capsule 20 mg (Abidi, Iran) up to a maximum dose of 60 mg daily in each group, plus a folic acid tablet 5 mg (Iran Daru, Iran) daily as group 1, or fluoxetine plus placebo tablets (Isfahan Faculty of Pharmacy) as group 2 in the same ratio. The correct diagnosis of major depressive disorder was made by two child and adolescent psychiatrists according to the DSM-5. The Kiddie Schedule for Affective Disorders and Schizophrenia (K-SADS) instrument was used to confirm the diagnosis and rule out other psychiatric disorders. The validity and reliability of this tool have been previously approved in the Iranian population (7). The Children's Depression Inventory (CDI) was used to assess the severity of depression during the study at baseline, after 4 weeks, and after 12 weeks. This tool has sufficient validity and reliability in the Iranian population (8). This tool contains 27 subscales that include Likert scores between 0 and 2.
3.2. Statistical Analysis
After data collection, the data were analyzed using the Statistical Package for the Social Sciences (SPSS Inc., Chicago, USA) version 21 and were presented as n (%) and mean ± standard deviation (SD). Statistical significance was determined as P < 0.05. Regarding the normal distribution of measurements and based on the Kolmogorov-Smirnov test, the chi-square test and independent t-test were used. For quantitative outcome measures, after adjustment for confounding variables such as age and gender, the repeated measures test was used.
4. Results
Participants included 50 patients aged between 6 and 18 years with a diagnosis of major depressive disorder, who were equally divided into two groups: Folic acid and control. Seven patients were excluded from the study (six patients from the control group and one patient from the folic acid group). The reason for the withdrawal of three patients was their unwillingness to continue participating in the study. Two patients were excluded due to irregular medication use, and two patients due to worsening symptoms and the need for ECT (Figure 1). The average age of participants in the folic acid group and the control group was 14.9 ± 2.9 and 14.9 ± 2.4, respectively. The percentage of males in the folic acid and control groups was 36.8% and 33.3%, respectively. After statistical analysis, it was found that there was no significant difference in age, gender, and education level of the patients between the two groups (Table 1). After 12 weeks of the study, the severity of depression improved in both the folic acid and control groups, but no statistical difference was found between the two groups (Table 2). There were no significant differences in RBC, folate, vitamin B12, and homocysteine levels between the beginning and end of the study (Table 3). Hemoglobin levels in the control group decreased from 13.8 to 13.4, which was statistically significant (P = 0.01). Also, the MCV level in the folic acid group decreased from 83.7 to 82.7, which was also statistically significant (P = 0.03).
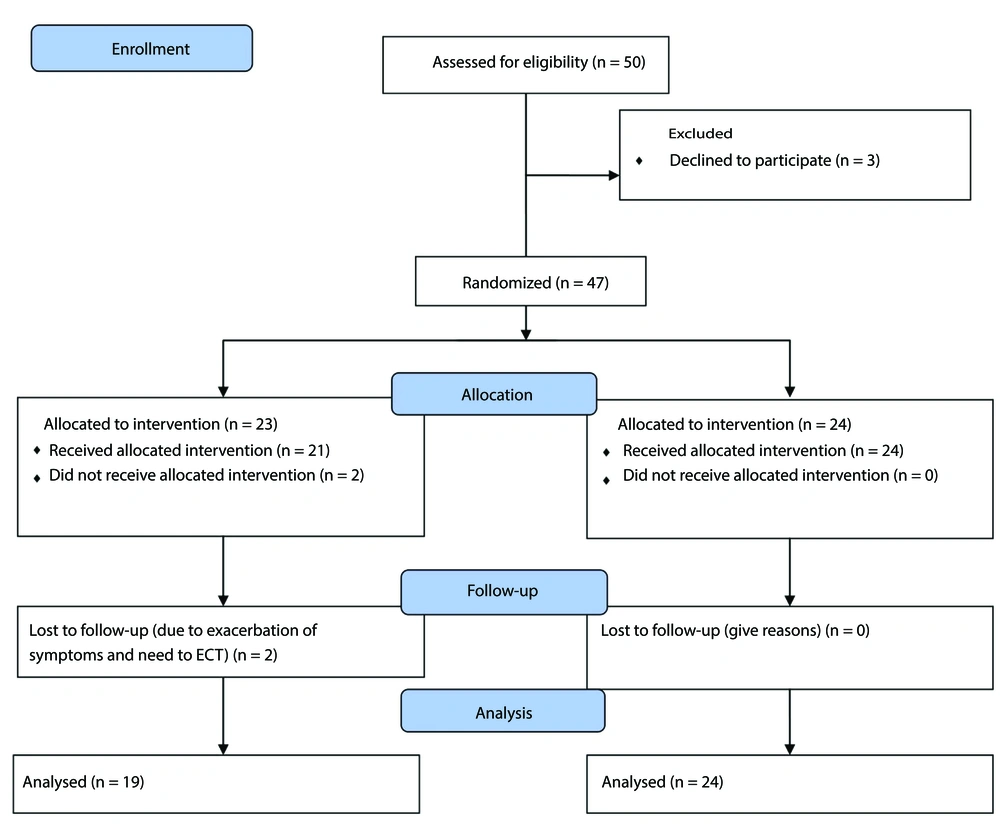
Figure 1.
CONSORT flow diagram
Table 1.
Baseline Characteristics of Participants a
| Variables | Folic Acid (N = 24) | Placebo (N = 19) | P |
|---|---|---|---|
| Age | 14.9 ± 2.9 | 14.9 ± 2.4 | 0.8 |
| Male | 7 (36.8) | 8 (33.3) | 0.8 |
| Education | 0.9 | ||
| Elementary | 3 (13) | 2 (10) | |
| Middle | 6 (25) | 6 (32) | |
| High school | 15 (62) | 11 (58) |
a Values are expressed as mean ± standard deviation (SD) or No. (%).
Table 2.
Changes of Children's Depression Inventory During the Study and the Result of Longitudinal Analysis a
| Variables | Baseline | 4th Week | 12th Week | P b | P c |
|---|---|---|---|---|---|
| Depression | 0.4 | ||||
| Folic acid | 28.3 ± 8.4 | 22.8 ± 9.5 | 17.3 ± 10.1 | < 0.001 d | |
| Placebo | 26.6 ± 8.3 | 19.7 ± 6.9 | 18.3 ± 9.5 | 0.003 |
a Values are expressed as mean ± standard deviation (SD).
b P-values for within group changes.
c P-values for between group changes.
d P < 0.001 was considered statistically significant.
Table 3.
Changes of Hematological Parameters During the Study and the Result of Related Analysis a
| Variables | Baseline | 12th Week | P b |
|---|---|---|---|
| RBC | |||
| Folic acid | 4.8 ± 0.5 | 5 ± 0.6 | 0.12 |
| Placebo | 4.99 ± 0.4 | 4.95 ± 0.4 | 0.34 |
| HB | |||
| Folic acid | 14 ± 1.1 | 14.03 ± 1.4 | 0.85 |
| Placebo | 13.8 ± 1.5 | 13.4 ± 1.6 | 0.01 c |
| MCV | |||
| Folic acid | 83.7 ± 3.5 | 82.7 ± 3.8 | 0.03 c |
| Placebo | 84.3 ± 4.3 | 84.2 ± 3.9 | 0.78 |
| Folate | |||
| Folic acid | 11.7 ± 5 | 13.7 ± 3.9 | 0.07 |
| Placebo | 7.8 ± 3.6 | 8.3 ± 2.9 | 0.2 |
| B12 Vitamine | |||
| Folic acid | 234.1 ± 115.7 | 260 ±132.8 | 0.34 |
| Placebo | 273.4 ± 162.7 | 307.4 ± 202.5 | 0.16 |
| Homocysteine | |||
| Folic acid | 11.5 ± 6.3 | 11.5 ± 8.8 | 0.9 |
| Placebo | 8.5 ± 2.3 | 8.8 ± 2.6 | 0.6 |
a Values are expressed as mean ± standard deviation (SD).
b P-values for within group changes based on paired sample t-test.
c P < 0.05 was considered statistically significant.
5. Discussion
Depression is a complex and serious disorder that is unfortunately prevalent in children and can have devastating effects on their physical, mental, and social health. Several factors contribute to the development of depression in children, including genetic, environmental, and biochemical factors. Among them, the deficiency of certain nutrients is also considered a potential factor. One of these nutrients is folic acid (vitamin B9), which plays an important role in various body functions. Folic acid is involved in the production of neurotransmitters such as serotonin, dopamine, and norepinephrine. These neurotransmitters are important in regulating mood, sleep, and other cognitive and behavioral functions. Several studies have examined the link between folic acid deficiency and depression (9, 10). Some of these studies have shown that people with depression have lower levels of folic acid in their blood. Additionally, some studies have shown that folic acid supplementation can help improve symptoms of depression in adults, especially in people who do not respond well to drug treatments (2, 11). Studies on the role of folic acid in childhood depression are limited. Adding folic acid to fluoxetine treatment in young patients with major depressive disorder (less than 18 years old) may improve response rates, particularly in females. Some studies have shown that combining folic acid with fluoxetine can lead to a greater reduction in depressive symptoms and an increased response rate compared to fluoxetine alone. This study showed that the use of fluoxetine in both the folic acid and placebo groups improved depression, and the use of folic acid did not cause a significant statistical change in the improvement of depressive symptoms. Previous studies have also shown that fluoxetine has a role in treating treatment-resistant depression in children (12, 13).
A retrospective study also showed that adding folic acid to the treatment of depression in children had no effect on improving their depression (14). This study showed that there were no significant differences in red blood cell (RBC), folate, vitamin B12, and homocysteine levels between the beginning and end of the study. However, previous studies have shown that adding folic acid reduces blood homocysteine levels (15, 16). Of course, it is known that this reduction in homocysteine occurs when plasma homocysteine levels are high (16). It has also been determined that since folate is a water-soluble vitamin, in cases where blood levels of folate and B12 increase, the excess amount of this vitamin is excreted through body fluids (17). Therefore, we will not see an increase in blood levels of these vitamins. Hemoglobin levels in the control group decreased from 13.8 to 13.4, which was statistically significant. However, this decrease in hemoglobin levels is not clinically significant. Folic acid is needed for the formation of heme, the pigmented, iron-containing portion of the hemoglobin in RBCs (erythrocytes). However, adding folic acid did not increase hemoglobin levels in this study. In previous studies, the roles of folic acid supplementation on blood hemoglobin levels have been contradictory. Some have shown no effect, while others have shown a positive role for folic acid in increasing blood hemoglobin levels (18, 19). In this study, MCV levels decreased in the folic acid group after three months. Although this decrease in MCV was statistically significant, it is not clinically significant. Folic acid is approved for the treatment of macrocytic anemia and reduces MCV (20). However, in the general population who do not have macrocytic anemia and have normal MCV, this decrease in MCV with the addition of folic acid will not be significant (21).
5.1. Conclusions
Although folic acid has been approved as an adjunctive therapy in the treatment of adult depression, this study found that this vitamin has no role in the treatment of childhood depression. Additionally, adding this supplement to the normal population does not cause changes in blood parameters.