


1. Background
2. Objectives
3. Methods
3.1. Study Design and Setting
3.2. Participants and Sampling
3.3. Randomization and Blinding Method
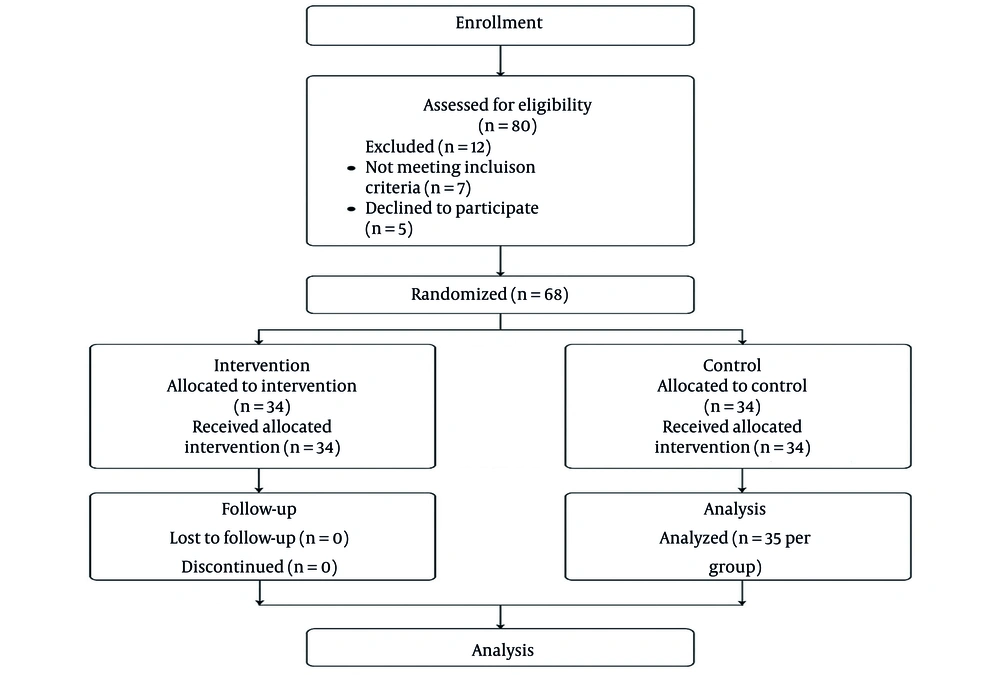
CONSORT flow diagram of participant enrolment, allocation, follow-up, and analysis
3.4. Intervention and Control Groups
3.5. Data Collection
3.6. Statistical Analysis
3.7. Ethical Considerations
4. Results
4.1. Safety and Compliance
4.2. Demographic Characteristics
| Variables | Intervention | Control | Total | P-Value |
|---|---|---|---|---|
| Age (y); mean ± SD | 6.34 ± 1.89 | 6.60 ± 1.53 | 6.47 ± 1.7 | 0.534 |
| Gender | 0.626 | |||
| Male | 20 (57.1) | 22 (62.8) | 42 (60.0) | |
| Female | 15 (42.9) | 13 (37.2) | 28 (40.0) | |
| BMI category | 0.761 | |||
| Underweight | 4 (11.4) | 4 (11.4) | 8 (11.4) | |
| Normal weight | 13 (37.1) | 11 (31.4) | 24 (34.2) | |
| Overweight | 17 (48.5) | 17 (48.5) | 34 (48.6) | |
| Obese | 1 (2.8) | 3 (8.5) | 4 (5.7) |
Abbreviation: BMI, Body Mass Index.
a Values are expressed as No. (%) unless otherwise indicated.
4.3. Outcome Definition
4.4. Frequency of Dry Nights
| Time Points | Intervention | Control | P-Value |
|---|---|---|---|
| Before treatment | 19.2 ± 3.7 | 18.9 ± 4.3 | 0.629 |
| Month 1 | 24.5 ± 4.8 | 22.4 ± 5.1 | < 0.001 |
| Month 2 | 26.0 ± 4.6 | 23.2 ± 4.6 | < 0.001 |
a Values are expressed as mean±SD.
b Dry nights are defined as calendar days without any episodes of nocturnal enuresis.
c Unadjusted descriptive means and P-values from independent t-tests are presented for descriptive purposes only.
d The main inferential results, including adjusted mean differences from the linear mixed-effects model, are provided in Table 3.
| Time Points | Intervention (N =35) | Control (N = 35) | Adjusted Mean Difference (Intervention - Control) | 95% CI | P-Value (LMM) | Cohen’s d (95% CI) |
|---|---|---|---|---|---|---|
| Month 1 | 24.5 ± 4.8 | 22.4 ± 5.1 | 2.1 | 1.2 - 3.0 | 0.002 | 0.45 (0.20 - 0.70) |
| Month 2 | 26.0 ± 4.6 | 23.2 ± 4.6 | 2.8 | 1.8 - 3.8 | < 0.001 | 0.60 (0.35 - 0.85) |
| Group×time interaction | - | - | - | - | 0.004 | - |
a Values are expressed as mean ± SD.
b Adjusted mean differences and P-values were obtained from a linear mixed-effects model with a random intercept for participant, and fixed effects for group, time, and the group×time interaction, with baseline dry nights included as a covariate.
c Missing data were addressed by multiple imputation in the intention-to-treat (ITT) sensitivity analysis.
d The per-protocol analysis included participants with greater than 90% compliance.
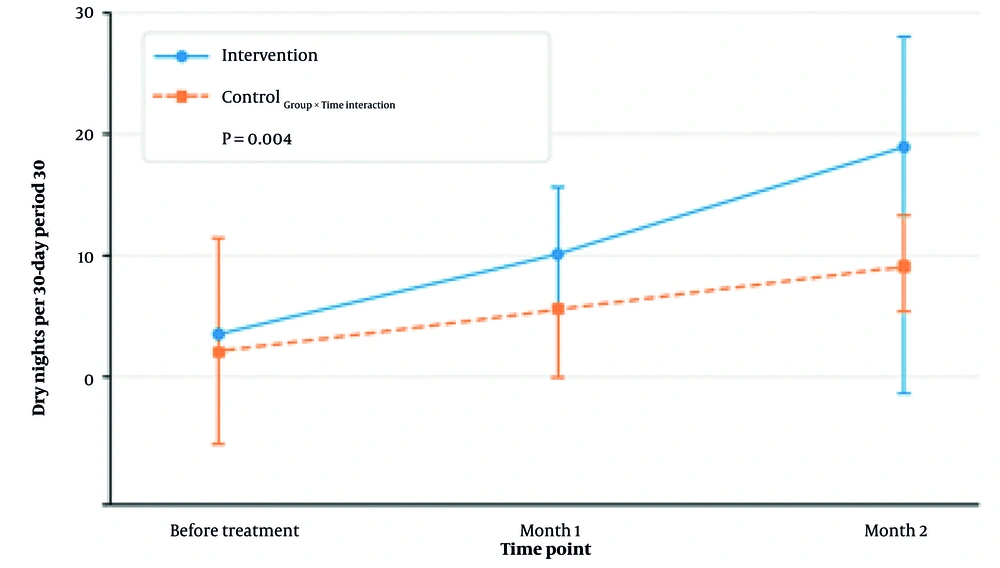
Adjusted marginal means for number of dry nights per 30-Day Period: Mean number of dry nights recorded at baseline (before treatment), month 1, and month 2 for both intervention and control groups. Dry nights are defined as calendar days without any episodes of nocturnal enuresis, based on caregiver reports. Error bars represent 95% confidence intervals (CIs). Sample size per group at each time point (n = 35). The intervention group showed a statistically significant increase in dry nights from month 1 onward compared to the control group.
4.5. Adjusted Mean Differences in Dry Nights
Abbreviation: ITT, intention-to-treat.
a Values are expressed by 95% confidence interval (CI).
b Results confirm that main LMM conclusions are robust to analytic approach.
c The ITT analysis using multiple imputation for missing data.
d Per-protocol: participants with > 90 % compliance.
4.6. Responder Analysis at Month 2
| Outcomes | Intervention | Control | Risk Difference (95% CI) | P-Value | NNT (95% CI) |
|---|---|---|---|---|---|
| ≥ 50% reduction in episodes | 28 (80.0) | 16 (45.7) | 34.3 (15.1 - 53.5) | 0.001 | 2.9 (1.9 - 6.6) |
| Complete dryness | 20 (57.1) | 8 (22.9) | 34.2 (13.2 - 55.2) | 0.002 | 2.9 (1.8 - 7.6) |
Abbreviation: NNT, number needed to treat.
a Risk difference and NNT calculated using standard methods for binary outcomes.
b Values are expressed by No. (%) or 95% confidence interval (CI).

