1. Background
Community-acquired pneumonia (CAP) is an acute disease caused by an infection of the lung parenchyma acquired outside of a hospital setting. It is one of the leading causes of morbidity and mortality in both immunocompetent and immunocompromised individuals. Determining the severity of the disease and detecting the pathogen are crucial for the outcome of the disease (1). The most common pathogens in CAP include Streptococcus pneumoniae, respiratory viruses, Haemophilus influenzae, Klebsiella pneumoniae, Mycoplasma pneumoniae, and Legionella pneumophila (2, 3). Existing fragmented research suggests that CAP incidence is influenced by various factors such as individual characteristics (age, gender, nutritional status, underlying diseases), environmental factors (region, season, weather, air pollutants), and behavioral factors (smoking, alcohol use, prior antibiotic use) (4).
A study in the United States reports an overall CAP incidence of 16 - 23/1000 person-years (5). The CAP incidence is relatively high and exhibits seasonal variation, with higher rates in the spring and winter. Moreover, CAP incidence has been rising annually (6). Worldwide, the incidence of CAP is generally higher in men than in women, and it increases with age, particularly among the elderly (6). Understanding the relationship between specific clinical features and microorganisms in CAP patients can significantly improve early diagnostic capability and aid in the development of personalized treatment plans. Accurate identification of the pathogen is key in the diagnosis of CAP (7).
Traditional microbiologic testing methods, including bacterial culture, serologic testing, and molecular biology techniques (e.g., PCR) (8), have limitations in detecting microorganisms that are mixed infections, atypical pathogens, or difficult to culture, such as the inability to detect anaerobes. It has been shown that anaerobes may be underestimated pathogens in patients with CAP (9). While these methods can help identify common pathogens, they have limitations, especially in detecting mixed infections, atypical pathogens, or microbes that are difficult to culture.
The use of targeted next-generation sequencing (tNGS) on bronchoalveolar lavage fluid (BALF) has increasingly demonstrated its advantages (10-12). The tNGS allows comprehensive detection of all microorganisms in lung samples, including bacteria, viruses, fungi, and other pathogens, without pre-specifying the pathogen type. This makes it particularly advantageous for diagnosing complex, mixed infections and hard-to-culture pathogens (13). Compared to traditional methods, tNGS offers higher sensitivity and specificity, especially in detecting low-abundance pathogens (14). However, the high cost of tNGS, the complexity of data interpretation, and challenges in interpreting commensal microbes still pose limitations for its routine clinical application (15). Therefore, tNGS is especially useful for diagnosing difficult cases and multiple infections, and with technological advances, its clinical application holds significant promise.
2. Objectives
This study aims to precisely identify high-risk populations and pathogens by comprehensively analyzing the statistical relationship between CAP patients' baseline characteristics, laboratory results, imaging data, and microorganisms, providing new insights into pathogen resistance research and driving the development of resistance management and personalized treatment strategies. This research provides valuable data support for epidemiological and public health fields.
3. Methods
3.1. Sample Collection
This study was conducted at Zibo First Hospital. Clinical data from 50 CAP patients treated between January and December 2024 were retrospectively analyzed. Information was collected using Excel software, with two healthcare providers independently collecting and cross-checking data for accuracy.
3.2. Inclusion and Exclusion Criteria
The diagnosis was based on the "Chinese Adult Community-Acquired Pneumonia Diagnosis and Treatment Guidelines (2016 Edition)" (16) and the "Infectious Diseases Society of America/American Thoracic Society Community-Acquired Pneumonia Guidelines" (17). The specific diagnostic criteria for CAP included: (1) Community onset, with symptoms presenting within 10 days prior to medical consultation; (2) clinical manifestations meeting at least one of the following: Fever, cough, sputum production, or exacerbation of pre-existing respiratory symptoms, with or without purulent sputum, chest pain, shortness of breath, or hemoptysis; lung consolidation signs and/or the presence of rales; peripheral blood white blood cell count > 10 × 109 or < 4 × 10⁹, with or without a left shift in the neutrophil count; (3) Chest imaging showing newly appeared patchy infiltrates, lobar or segmental consolidation, ground-glass opacities, or interstitial changes, with or without pleural effusion. Exclusion criteria included immunosuppressive conditions or immunodeficiency-related gene defects, such as malignancies, organ transplants, HIV infection, or continuous use of immunosuppressive agents within the previous 30 days; non-infectious pneumonia, including pulmonary tuberculosis, lung cancer, non-infectious interstitial lung disease, pulmonary edema, atelectasis, pulmonary embolism, eosinophilic pneumonia, and vasculitis.
3.3. Clinical Data Collection
Direct immune-related markers included white blood cell count, neutrophil absolute value/ratio, lymphocyte absolute value/ratio, monocyte absolute value/ratio, eosinophil/ratio, basophil absolute value/ratio, neutrophil/lymphocyte ratio, globulin level, adenosine deaminase (ADA), and procalcitonin (PCT). Baseline information included gender, age, past medical history, temperature, blood pressure, pulse, and respiratory rate. Laboratory data included urinalysis, bronchoscopy lavage fluid culture results, sputum culture results, blood tests (complete blood count, blood biochemistry, ESR), liver, kidney, and thyroid function, and myocardial markers. Imaging data included chest Computed Tomography (CT) results (64-slice spiral CT, SOMATOM Drive, Siemens Healthineers, Germany).
3.4. Bronchoalveolar Lavage Fluid Collection
The BALF samples were collected following the "Expert Consensus on Pathogen Detection in Bronchoalveolar Lavage Fluid for Pulmonary Infectious Diseases (2017 Edition)" (18). All CAP patients provided informed consent prior to the procedure. After selecting the lavage lung segment, patients underwent local anesthesia with 2% lidocaine and received multiple (20 - 50 mL) injections of room-temperature sterile saline for lavage, with negative pressure aspiration to collect the BALF in sterile containers. The samples were sent for traditional microbiological testing and mNGS.
3.5. Bronchoalveolar Lavage Fluid High-Throughput Sequencing
Before nucleic acid extraction, samples were inactivated. The library was prepared by fragmenting DNA, repairing ends, attaching sequencing adapters, and performing PCR amplification, followed by sequencing. Data were quality-controlled (sequencing reads > 50 bp and > 20M data) and filtered (removal of host sequences) before aligning with microbial databases. Pathogen microorganisms were identified based on unique reads matching the database with > 1% of the total reads (≥ 10 bp). All sample testing was entrusted to KingMed Diagnostics Group Co., Ltd., and primer and kit information is referenced in the article (19). The microbial species that could be identified by the tNGS technique were placed by us in Appendix 1. Peptostreptococcus micros, Fusobacterium nucleatum, and S. intermedius were anaerobes.
3.6. Statistical Analysis
Data were processed and analyzed using SPSS 25.0 software (IBM Corporation, USA). Continuous variables were expressed as mean ± SD, and categorical variables as N (%). Independent sample t-tests were used for inter-group comparisons of continuous variables; chi-square tests were used for categorical variables. Stepwise forward logistic regression was performed to analyze factors associated with microbial species. A P-value of < 0.05 was considered statistically significant.
4. Results
4.1. Baseline Information
Among the 50 CAP patients included in the analysis, 15 (30%) were female and 35 (70%) were male. The median age was 67.00 years (range: 49.00 - 76.00), with a median temperature of 36.70°C (range: 36.50 - 37.50), median pulse rate of 86.00 beats/min (range: 79.50 - 98.00), and median respiratory rate of 19.00 breaths/min (range: 18.00 - 21.25). Among 50 patients with CAP, P. micros was detected in 9 cases, F. nucleatum in 12 cases, and S. intermedius in 3 cases. There was no statistically significant difference between the CAP patients infected with anaerobes (n = 16) and those not infected with anaerobes (n = 34) in terms of age, gender distribution, marital and childbearing histories, smoking history, and alcohol consumption history (P > 0.05) (Table 1).
Table 1.
Baseline Information and Anaerobic Infections in Community-Acquired Pneumonia Patients a
| Variables | Anaerobic Infection | All Patients | P-Value | |
|---|---|---|---|---|
| No (N = 34) | Yes (N = 16) | |||
| Age | 64.00 (36.50, 77.80) | 71.00 (55.00, 76.00) | 67.00 (49.00, 76.00) | 0.632 |
| Pulse (beats/min) | 85.00 (75.80, 96.50) | 90.00 (80.00, 101.00) | 86.00 (76.50, 98.00) | 0.274 |
| Temperature (℃) | 36.50 (36.30, 37.50) | 36.75 (36.50, 37.50) | 36.70 (36.50, 37.50) | 0.228 |
| Respiration (breaths /min) | 19.50 (18.00, 21.30) | 19.00 (18.00, 22.50) | 19.00 (18.00, 21.25) | 0.992 |
| Gender | 0.427 | |||
| Female | 9 (26.47) | 6 (37.50) | 15 (30.00) | |
| Male | 25 (73.53) | 10 (62.50) | 35 (70.00) | |
| History of smoking | 0.551 | |||
| No | 25 (73.53) | 13 (81.25) | 38 (76.00) | |
| Yes | 9 (26.47) | 3 (18.75) | 12 (24.00) | |
| History of drinking alcohol | 0.197 | |||
| No | 27 (79.41) | 15 (93.75) | 42 (84.00) | |
| Yes | 7 (20.59) | 1 (6.25) | 8 (16.00) | |
| History of diabetes | 0.725 | |||
| No | 27 (79.41) | 12 (75.00) | 39 (78.00) | |
| Yes | 7 (20.59) | 4 (25.00) | 11 (22.00) | |
| History of hypertension | 0.567 | |||
| No | 24 (70.59) | 10 (62.50) | 34 (68.00) | |
| Yes | 10 (29.41) | 6 (37.50) | 16 (32.00) | |
| History of surgery | 0.427 | |||
| No | 25 (73.53) | 10 (62.50) | 35 (70.00) | |
| Yes | 9 (26.47) | 6 (37.50) | 15 (30.00) | |
| History of tumors | 0.507 | |||
| No | 30 (88.24) | 13 (81.25) | 43 (86.00) | |
| Yes | 4 (11.76) | 3 (18.75) | 7 (14.00) | |
a Values are expressed as No. (%).
4.2. Microbial Detection Results
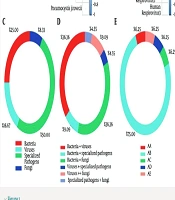
The five most frequently detected bacteria were K. pneumoniae (n = 15), F. nucleatum (n = 12), Moraxella catarrhalis (n = 9), Acinetobacter baumannii (n = 7), and S. pyogenes (n = 7). The top five frequencies of viruses were Epstein-Barr virus (EBV) (n = 14), Cytomegalovirus (CMV) (n = 6), and Herpes simplex virus type 1 (HSV-1) (n = 5). The highest frequency of occurrence of specific pathogens was M. pneumoniae (n = 10). The fungi with the highest frequency of occurrence were Candida albicans (n = 14), C. parapsilosis (n = 6), and Pneumocystis jirovecii (n = 6). Microbial detection in all CAP patients is shown in Figure 1C - E. Strong collinearity (R > 0.80, P < 0.05) was observed between the following microbial pairs: Proteus mirabilis and Serratia marcescens, enterovirus D68 and S. pneumoniae, Aspergillus versicolor and M. catarrhalis, H. influenzae and S. intermedius (Figure 1A and B) (Appendix 1 in Supplementary File).
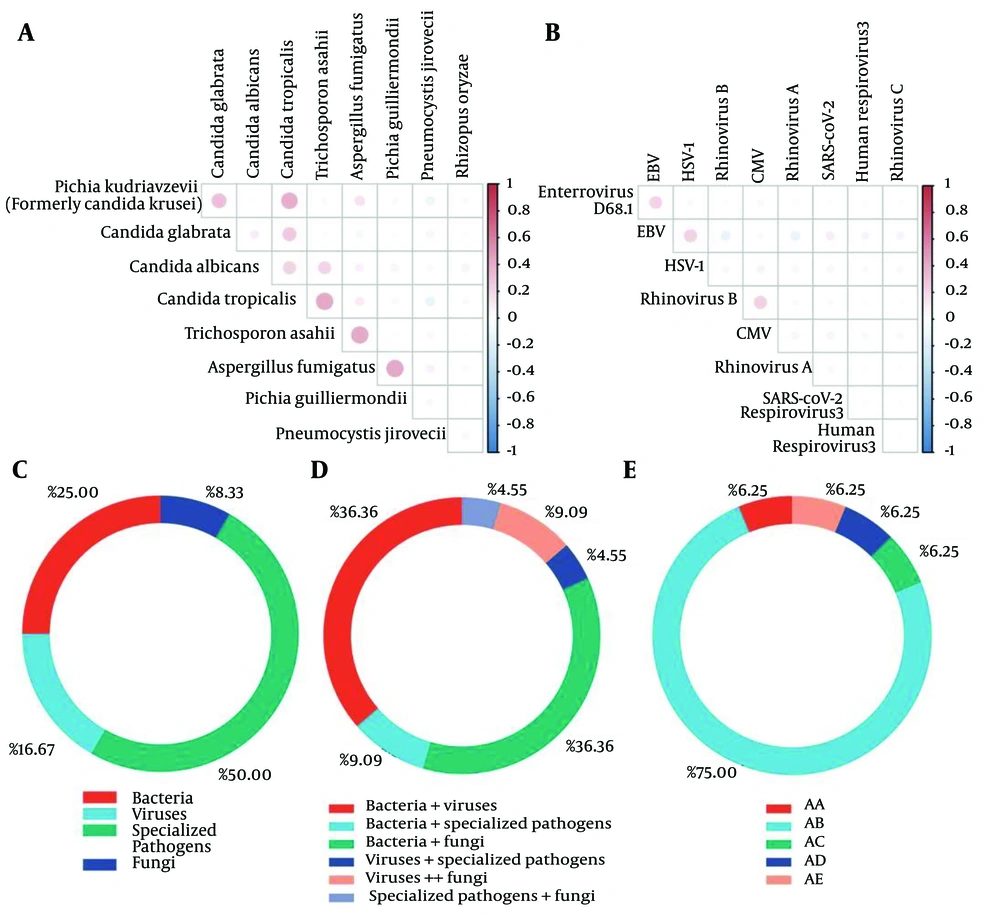
Figure 1.
Distribution of microorganisms detected by bronchoalveolar lavage fluid (BALF) in community-acquired pneumonia (CAP) patients: A, fungal covariance; B, viral covariance; C, proportion of CAP patients with only 1 of the categories of bacteria/fungi/viruses/specialized pathogens; D, proportion of CAP patients with ≥ 2 of the categories of bacteria/fungi/viruses/specialized pathogens detected, and E, the CAP patients with 0/3/4 categories; AA, patients infected with bacteria, viruses and specialized pathogens; AB, patients infected with bacteria, viruses and fungi; AC, patients infected with bacteria, specialized pathogens and fungi; AD, patients infected with both bacteria, viruses, specialized pathogens and fungi; AE, patients with no detectable infecting microorganisms.
4.3. Microbial and Baseline Differences
Non-parametric tests were employed to assess differences in microbial distribution across variables such as sex and age. A significant difference in Staphylococcus aureus abundance was observed between sexes. Female patients exhibited a significantly higher rate of S. aureus infection compared to male patients (U = 192.50, z = -3.15, P = 0.002). A history of smoking showed a significant association with the M. tuberculosis complex (U = 190.00, z = -2.54, P = 0.011). A history of diabetes was significantly associated with C. tropicalis (U = 167.00, z = -2.14, P = 0.032). Surgical history showed a significant difference in the presence of M. pneumoniae (U = 187.50, z = -2.29, P = 0.022). Tumor history was significantly associated with L. pneumophila (U = 111.00, z = -2.68, P = 0.007), P. jirovecii (U = 96.50, z = -2.68, P = 0.007), and A. fumigatus (U = 93.00, z = -3.09, P = 0.002).
4.4. Microbial-Immune Marker Associations
To explore microbial-immune associations, we analyzed immune marker differences for microorganisms with a frequency ≥ 9 among CAP patients. Brevundimonas diminuta was significantly associated with four immune parameters: Leukocyte count (P = 0.043), absolute neutrophil count (P = 0.029), neutrophil-to-lymphocyte ratio (P = 0.011), and globulin levels (P = 0.047). Mycoplasma pneumoniae was significantly associated with five immune parameters: Absolute monocyte count (P = 0.027), absolute eosinophil count (P = 0.011), lymphocyte ratio (P = 0.016), eosinophil ratio (P = 0.019), and PCT levels (P = 0.031). No other microorganisms demonstrated significant associations with immune markers (Table 2).
Table 2.
Differences in Microbiological-Immunological Indicators
| Variables | Microcystis aeruginosa | Mycoplasma pneumoniae | ||||
|---|---|---|---|---|---|---|
| U | Z | P | U | Z | P | |
| White blood cells | 104.50 | -2.028 | 0.043 a | 121.50 | -1.912 | 0.056 |
| Absolute neutrophils | 98.50 | -2.178 | 0.029 a | 134.50 | -1.593 | 0.111 |
| Absolute lymphocytes | 159.00 | -0.646 | 0.518 | 126.50 | -1.788 | 0.074 |
| Absolute monocytes | 143.00 | -1.051 | 0.293 | 109.00 | -2.214 | 0.027 a |
| Absolute eosinophils | 163.50 | -0.533 | 0.594 | 96.00 | -2.533 | 0.011 a |
| Absolute basophils | 170.00 | -0.370 | 0.711 | 148.50 | -1.263 | 0.207 |
| Neutrophil ratio | 128.50 | -1.418 | 0.156 | 124.00 | -1.849 | 0.064 |
| Lymphocyte ratio | 148.50 | -0.912 | 0.362 | 100.50 | -2.420 | 0.016 a |
| Monocyte ratio | 172.00 | -0.317 | 0.752 | 168.00 | -0.778 | 0.436 |
| Eosinophil ratio | 180.50 | -0.101 | 0.919 | 103.50 | -2.351 | 0.019 a |
| Basophil ratio | 171.00 | -0.345 | 0.730 | 159.50 | -0.993 | 0.321 |
| Neutrophil/lymphocyte ratio | 84.50 | -2.533 | 0.011 a | 120.00 | -1.946 | 0.052 |
| Calcitoninogen | 181.50 | -0.076 | 0.939 | 111.50 | -2.158 | 0.031 a |
| Globulin | 106.00 | -1.985 | 0.047 a | 129.00 | -1.725 | 0.085 |
| ADA | 167.00 | -0.460 | 0.646 | 156.50 | -1.097 | 0.273 |
Abbreviation: ADA, adenosine deaminase.
a P < 0.05
4.5. Radiological Findings and Microbial Associations
Radiological data collected included pulmonary nodules, pleural effusion, and tracheal stenosis. CAP patients with pulmonary nodules showed a significant association with B. diminuta (χ2 = 7.352, P = 0.007). Patients with pleural effusion demonstrated a significant association with Kodamaea ohmeri (formerly C. krusei) (χ2 = 5.104, P = 0.024) (Table 3).
Table 3.
Intergroup Differences in Imaging Information and Microbial Data a
| Title | Values | Total | X2 | P |
|---|---|---|---|---|
| Imaging Abnormal | Imaging Normal | |||
| Microcystis aeruginosa | 7.352 | 0.007 b | ||
| Not detected | 25 (96.15) | 16 (66.67) | ||
| Detected | 1 (3.85) | 8 (33.33) | ||
| No Pleural Effusion | Pleural Effusion Present | |||
| Candida kudri azwaiensis (Candida krönigii) | 5.104 | 0.024 c | ||
| Not detected | 27 (100.00) | 19 (82.61) | ||
| Detected | 0 (0.00) | 4 (17.39) |
a Values are expressed as No. (%).
b P < 0.01
c P < 0.05
4.6. Regression Analysis
A stepwise regression analysis was conducted using gender, age, body temperature (°C), pulse (beats/min), and respiratory rate (breaths/min) as independent variables, and the total number of microorganisms as the dependent variable. The final model identified only age as a significant variable with an R-squared value of 0.245, indicating that age accounts for 24.5% of the variation in the total microbial species count. The model passed the F-test (F = 15.589, P = 0.000 < 0.05), confirming its validity (Table 4). The model equation was: Total microorganisms = 0.622 + 0.052 × age. The regression coefficient for age was 0.052 (t = 3.948, P = 0.000 < 0.01), indicating a significant positive relationship between age and microbial species count. In the regression model, the detection of Tropheryma whipplei, Human rhinovirus A, M. pneumoniae, and S. pneumoniae showed significant negative correlations with patient age (adjusted R2 = 0.69, Durbin-Watson statistic = 2.20, P < 0.01), suggesting younger patients are more susceptible to infections with these pathogens.
Table 4.
Stepwise Regression Analysis Results
| Variables | Regression Coefficient (95% CI) | VIF | Tolerance |
|---|---|---|---|
| Constant | 58.679 (16.456) a | - | - |
| Whipple's disease | 30.845574 | 1.136 | 0.88 |
| Virus | 6.412 (2.557) b | 1.159 | 0.863 |
| Rhinovirus type A | -27.330 (-2.926) a | 1.083 | 0.923 |
| Mycoplasma pneumoniae | -24.522 (-4.971) a | 1.259 | 0.794 |
| Fungi | 5.942 (3.270) a | 1.164 | 0.859 |
| Streptococcus pneumoniae | 34.83706 | 1.168 | 0.856 |
a P < 0.05
b P < 0.01
5. Discussion
Our study indicates that K. pneumoniae, EBV, M. pneumoniae, and C. albicans are among the most frequently encountered microbes in CAP patients. Gender differences in CAP patients revealed a significant effect on S. aureus. Stepwise regression analysis revealed that viral and fungal diversity in CAP patients increases with age, while younger patients showed heightened susceptibility to infections caused by T. whipplei, Human rhinovirus A, M. pneumoniae, and S. pneumoniae. The EBV is often reactivated in immunocompromised individuals. Goh et al. reported that EBV reactivation is associated with immunosuppression in CAP and correlates with increased morbidity and prolonged ICU stay (20). Huang et al. found that C. albicans infections in immunocompromised patients are often co-infected with other pathogens, complicating disease progression (21).
Fusobacterium nucleatum, an anaerobe commonly found in the oral microbiota, is infrequent in CAP but can lead to severe complications, such as necrotizing pneumonia, especially when co-infected with influenza virus (22). Additionally, Alvarez et al. identified F. nucleatum in pleural effusion infections, suggesting its potential pathogenic role in certain pulmonary infections (23). However, our study did not find a clear association between F. nucleatum and pleural effusions, warranting further research with larger sample sizes. Although anaerobic bacteria are generally uncommon in pulmonary infections, they are relatively frequent in specific conditions such as aspiration pneumonia, lung abscesses, necrotizing pneumonia, and empyema (24). Yamasaki et al. used 16S rRNA gene clone library analysis of BALF from CAP patients and found significantly higher detection rates of anaerobes and oral bacteria compared to traditional cultures, suggesting the role of anaerobes in CAP may be underestimated (25).
Fadell et al. observed a declining contribution of anaerobes in aspiration pneumonia due to the increasing prevalence of gram-negative bacilli (26, 27). In contrast, Fernández-Barat maintained that anaerobes remain key pathogens in pneumonia, especially in cases of oral microbiota imbalance (27). Traditional microbiological methods often fail to detect anaerobes, whereas tNGS provides a powerful tool for identifying and managing these pathogens (28), as demonstrated in a case of severe pneumonia with empyema. In our study, anaerobic infections accounted for 32% of CAP cases, underscoring the need to consider anaerobes in clinical management.
Our results also indicated sex-based differences in S. aureus detection among CAP patients, consistent with previous studies. This phenomenon may be attributed to several factors. One study reported a higher incidence of S. aureus infections in male patients, often associated with more severe clinical manifestations, such as increased hospitalization rates and longer lengths of stay (29). Male patients are also more prone to complications such as empyema and lung abscesses.
Sex differences may influence immune responses to S. aureus. Some studies suggest that females may exhibit a stronger immune response to S. aureus infections, potentially due to hormonal influences (30). While this may lead to more efficient pathogen clearance, it may also increase the risk of immune-mediated complications. Moreover, antibiotic resistance profiles of S. aureus may differ between sexes. Studies have shown higher detection rates of methicillin-resistant S. aureus (MRSA) in male patients, possibly due to more frequent healthcare exposure and higher antibiotic usage (31). These resistance differences could affect treatment choices and prognosis. Finally, sex differences may also influence the epidemiology and transmission of S. aureus. Research indicates that men are more likely to be carriers, increasing the risk of community and hospital transmission (32). Further research is needed to elucidate these mechanisms to inform personalized treatment and management strategies.
The observed increase in viral and fungal diversity with age in CAP patients may be due to a combination of immunological and environmental factors. Studies show that non-influenza viral infections are more common in older CAP patients and have similar impacts on disease severity and clinical outcomes as influenza viruses (33). Common respiratory viruses in elderly patients, such as RSV and adenovirus, have high infection rates, likely due to immunosenescence. In addition, fungal infections — such as those caused by RSV and adenovirus — are more frequently observed in older CAP patients, potentially due to compromised immune defenses (34). Rhinovirus A is also frequently detected in adult CAP cases and is associated with respiratory failure and severe clinical outcomes in elderly individuals (35).
This study has several limitations. First, the observational design inherently limits the ability to establish causal relationships between clinical factors and microbial pathogens in CAP patients. Second, data were collected from a single center, which may affect the generalizability of findings to other healthcare settings or populations with different demographic and clinical characteristics. Additionally, the accuracy and completeness of clinical, laboratory, and imaging data depended on medical records, which may contain missing information or variability in clinical practices. Finally, potential sequencing errors associated with NGS and the inability to detect microorganisms below the 100 copies/mL threshold may have impacted the results.
5.1. Conclusions
This study highlights the role of various pathogens in CAP, revealing significant associations between age, gender, and the diversity of microbial species in patients. Our findings underscore the importance of considering patient demographics, such as age and gender, when diagnosing and treating CAP. Further research is needed to explore the mechanisms behind these associations and to optimize patient management.