1. Background
Hypertension, characterized by persistently elevated blood pressure, imposes a substantial global health burden; high systolic blood pressure alone accounted for approximately 11 million deaths worldwide in 2021 (1). In China, hypertension is a leading contributor to stroke and cardiovascular mortality, and population-based studies have documented substantial regional and environmental variation in disease burden (2). As a major risk factor for cardiovascular disease, its pathogenesis involves complex interactions between genetic predisposition and environmental factors, with the latter playing a predominant role (3). Key determinants of hypertension risk include nonmodifiable demographic factors (sex, age) and modifiable physiological risk factors (body weight and lipid levels) (4, 5). Abnormal lipid profiles frequently co-occur with hypertension, synergistically increasing cardiovascular risk (5).
Recent population-based studies have extended the microbiota–hypertension axis across diverse ethnic and geographic cohorts. A 2023 study reported gut microbiota alterations associated with blood pressure in Northwestern China, revealing sex-specific taxonomic and functional signatures (6). Hogue et al. further demonstrated differential correlations between gut microbiota and blood pressure status in African American collegiate athletes, highlighting that microbiome–blood pressure associations persist even in physically active populations (7). Most recently, Chen et al. identified multi-kingdom gut microbiota dysbiosis in pulmonary arterial hypertension, expanding the spectrum of hypertension in which microbial signatures may play a role (8). Proposed mechanisms involve microbial metabolites such as short-chain fatty acids (SCFAs) acting through host receptors, including the blood pressure-raising Olfr78 and the blood pressure-lowering Gpr41 (9); depletion of specific taxa and their metabolites, such as Flavonifractor plautii-derived phytosphingosine, has also been associated with metabolic disorders (10). Furthermore, gut dysbiosis has been linked to conditions closely intertwined with hypertension, such as obesity and dyslipidemia (11). Differences in gut microbial composition and function have also been directly observed in hypertensive individuals compared with normotensive individuals (12-15).
2. Objectives
We conducted a hypothesis-generating, cross-sectional case-control study to characterize gut microbiota profiles in hypertensive individuals from the Chaoshan region, a population with documented HLA-A/HLA-B and Y-chromosomal polymorphisms that differ from those in other Han Chinese subgroups (16, 17). We also compared microbiota composition across strata defined by sex, age, body mass index (BMI), and lipid levels, thereby providing foundational data on population-specific microbial ecology to inform future genetically informed investigations. Direct host genotyping was beyond the scope of the present study; the documented population background is provided only as context for interpreting microbiota patterns, not as an explanation for them.
3. Methods
3.1. Study Participants
This unmatched cross-sectional case-control study recruited 50 antihypertensive-naïve residents from the Chaoshan region in China between July 2017 and July 2018 using convenience sampling. All assessments other than blood pressure measurement were conducted at a single visit; blood pressure was measured on three separate days. There was no longitudinal follow-up. Participants were recruited from The First Affiliated Hospital of Shantou University Medical College and its affiliated community health settings. Of 65 individuals initially screened, 15 did not enroll (8 were excluded for antibiotic use within 4 weeks, 4 for significant liver or kidney disease, and 2 for gastrointestinal disorders; 1 declined participation), leaving 50 enrolled participants (34 hypertensive, 16 normotensive). A participant-flow diagram detailing the screening and exclusion pathway is provided as Figure S1 in the Supplementary File.
Blood pressure was measured using calibrated Omron HEM-7201 electronic sphygmomanometers on three separate days without antihypertensive medication. During data collection in 2017 - 2018, clinical definitions followed contemporary Chinese guidelines: normotension was defined as sustained blood pressure < 140/90 mmHg, and hypertension as systolic blood pressure ≥ 140 mmHg and/or diastolic blood pressure ≥ 90 mmHg (2010 Chinese Hypertension Guidelines); obesity as BMI ≥ 28 kg/m2, the threshold in force for Chinese adults during the recruitment period; and dyslipidemia as total cholesterol > 5.2 mmol/L (2016 Chinese Guidelines for Dyslipidemia Prevention and Treatment).
Trained investigators administered structured questionnaires covering demographics, medical history, dietary habits, and lifestyle factors. Potential secondary hypertension was screened via a structured patient questionnaire, and participants were excluded if they self-reported a history of renal artery stenosis, endocrine disorders (e.g., hyperthyroidism), medication-induced hypertension, physician-diagnosed chronic kidney disease, liver cirrhosis, or other systemic diseases known to cause hypertension. Questionnaire validity was enhanced by providing plain-language explanations of medical terms (e.g., “kidney artery narrowing” instead of “renal stenosis”) and cross-checking responses against available personal medical records. Additional exclusion criteria included significant liver or kidney disease, gastrointestinal disorders (e.g., inflammatory bowel disease, colorectal cancer), any prior use of antihypertensive medication (i.e., lifetime nonuse was required), and the use of antibiotics or probiotics within 4 weeks before sampling. Medication history was obtained using an investigator-administered structured questionnaire and cross-checked against personal medical records where available. All 50 enrolled participants met these criteria.
The study protocol was approved by the Ethics Committee of the First Affiliated Hospital of Shantou University Medical College (approval no. 2018087), and all participants provided written informed consent in accordance with the Declaration of Helsinki. This study is reported in accordance with the Strengthening the Reporting of Observational Studies in Epidemiology (STROBE) guidelines (18).
3.2. Sample Collection and Processing
Fasting venous blood (3 mL) was collected in serum separator tubes, centrifuged at 3,500 rpm for 5 min, and the serum was stored at -80 °C. Fresh stool samples (≥ 20 g) were collected in sterile containers without preservatives immediately after spontaneous defecation, and collection time was recorded relative to the last meal (all samples were collected within 2 h of a bowel movement). Samples were immediately placed on ice and transported to the laboratory within 2 h, then stored at -80 °C until DNA extraction. All samples were collected at the same time of day to minimize diurnal variation in microbiota composition.
3.3. DNA Extraction and 16S rRNA Sequencing
Genomic DNA was extracted from approximately 200 mg of stool using the CTAB method as described (19). Samples were homogenized in CTAB buffer (2% CTAB, 100 mM Tris-HCl pH 8.0, 20 mM EDTA, 1.4 M NaCl), incubated at 65 °C for 60 min, and purified by chloroform:isoamyl alcohol (24:1) extraction and isopropanol precipitation. DNA concentration and purity were verified by 1% agarose gel electrophoresis, and the DNA was then diluted to 1 ng/μL in sterile water. The V4 region of bacterial 16S rRNA genes was amplified using primers 515F (5’-GTGCCAGCMGCCGCGGTAA-3’) and 806R (5’-GGACTACHVGGGTWTCTAAT-3’) with barcoded forward primers. PCR reactions (25 μL) contained 1× Phusion High-Fidelity PCR Master Mix with GC Buffer (New England Biolabs), 0.2 μM primers, and 10 ng DNA template. Cycling conditions included 98 °C for 1 min, 30 cycles of 98 °C for 10 s, 55 °C for 30 s, and 72 °C for 30 s, followed by a final extension at 72 °C for 5 min.
PCR products were purified using Agencourt AMPure XP beads (Beckman Coulter). Libraries were constructed using the TruSeq DNA PCR-Free Library Prep Kit (Illumina) and sequenced on the Illumina HiSeq 2500 platform (2 × 250 bp) by Novogene Bioinformation Technology Co., Ltd. (Beijing, China).
3.4. Bioinformatics Analysis
Raw sequences were processed using USEARCH (v7.0) (20). Paired-end reads were merged allowing a maximum of 10 nucleotide differences and were quality-filtered (maximum expected errors = 1.0). After quality filtering, a mean of 75,820 ± 13,117 high-quality reads per sample (range: 49,416 - 94,937) was obtained, with a mean retention rate of 97% (range: 96%–98%). The mean Q20 and Q30 values were 99.2% and 98.4%, respectively, and the mean read length after primer trimming was 253 bp, consistent with the V4 amplicon length. No sample was discarded after quality control, and no sample was excluded after sequencing. Operational taxonomic units (OTUs) were clustered at 97% similarity using the -cluster_otus command, and chimeras were removed using UCHIME against the Gold database. OTU representative sequences were taxonomically annotated against the SILVA SSU rRNA database (release 132) (21) using MOTHUR (v1.39.5) with an 80% confidence threshold. Phylogenetic trees were reconstructed using MUSCLE (v3.8.31) (22).
To standardize sequencing depth across samples, all samples were rarefied to 35,000 reads per sample before alpha-diversity analysis; all samples had sufficient high-quality reads to meet this threshold (minimum: 49,416 reads). Alpha-diversity indices (Chao1, ACE, Shannon, Simpson) were calculated in QIIME (v1.9.1) (23). Beta-diversity analysis used Bray-Curtis dissimilarity matrices, with ordination performed using nonmetric multidimensional scaling (NMDS) in R (v3.6.1). Group differences were assessed using analysis of similarities (ANOSIM) and multi-response permutation procedure (MRPP) tests (999 permutations). ANOSIM and MRPP were used as rank-based, distribution-free tests of group separation on Bray–Curtis dissimilarities; PERMANOVA and a formal test of multivariate dispersion were not performed.
Exploratory taxon ranking was performed using linear discriminant analysis effect size (LEfSe) (linear discriminant analysis, LDA > 2.0) (24). Between-group comparisons of individual taxa were performed using Wilcoxon rank-sum tests at an unadjusted threshold of P < 0.05; no correction for multiple comparisons was applied, and these comparisons are therefore reported as descriptive rather than confirmatory. Microbial co-occurrence networks were constructed based on Spearman correlations (|ρ| > 0.6, P < 0.05).
3.5. Biochemical Analysis
Serum lipid profiles were quantified enzymatically using a Beckman Coulter AU5800 analyzer. For total cholesterol, triglycerides (TG), and high- and low-density lipoprotein cholesterol (HDL-C/LDL-C), an enzymatic colorimetric assay, the glycerol-3-phosphate oxidase-peroxidase method, and homogeneous enzymatic assays were used, respectively.
3.6. Statistical Analysis
Continuous clinical variables are summarized as the mean ± standard deviation and were compared using Welch's two-sample t-test; categorical variables were compared using the chi-square test. Microbiota relative abundances are non-normally distributed and were compared between the normotensive and hypertensive groups using Wilcoxon rank-sum tests at an unadjusted threshold of P < 0.05. Because many taxa were examined relative to the sample size, no false-discovery-rate correction was applied; no taxon-level comparison is therefore presented as confirmatory, and all between-group taxonomic differences are reported as descriptive associations. Within the hypertensive group, the sex, age, BMI, and lipid strata contained as few as seven participants; given these small strata and the large number of taxa compared, formal testing was not applied to stratified comparisons, which are reported as exploratory numerical summaries intended to generate hypotheses for future validation.
4. Results
4.1. Clinical Characteristics of Study Participants
This cross-sectional case-control study included 50 antihypertensive-naïve participants from China’s Chaoshan region, stratified into normotensive (n = 16) and hypertensive (n = 34) groups based on blood pressure criteria (Table 1). Hypertensive participants had significantly higher systolic (154.24 ± 16.88 mmHg vs 120.12 ± 9.64 mmHg, P < 0.001) and diastolic blood pressure (94.62 ± 12.82 mmHg vs 77.56 ± 4.24 mmHg, P < 0.001) than the normotensive group. The hypertensive group tended to be older (61.36 ± 11.09 years vs 56.88 ± 13.91 years, P = 0.270) and had a lower proportion of males (26.5% vs 50.0%, P = 0.129), although these differences were not statistically significant. Height was lower in the hypertensive group (155.79 ± 7.03 cm vs 160.56 ± 7.01 cm, P = 0.033), consistent with the higher proportion of women. Body weight (P = 0.674) and BMI (P = 0.112) were comparable between groups. Among serum lipids, total cholesterol was significantly higher in the hypertensive group (5.54 ± 0.88 mmol/L vs 5.04 ± 0.67 mmol/L, P = 0.041), whereas triglycerides (P = 0.487), HDL-C (P = 0.061), and LDL-C (P = 0.088) did not differ significantly. Fasting glucose was higher in the hypertensive group, although the difference did not reach the conventional threshold (6.97 ± 2.69 vs 5.83 ± 1.05 mmol/L, P = 0.054).
Table 1.
Baseline Demographic and Clinical Characteristics of Study Participants (units are indicated in row labels) a
| Characteristic | Normotensive (n = 16) | Hypertensive (n = 34) | P Value |
|---|---|---|---|
| Gender | 0.129 | ||
| Male | 8 (50.0) | 9 (26.5) | |
| Female | 8 (50.0) | 25 (73.5) | |
| Age (y) | 56.88 ± 13.91 | 61.36 ± 11.09 | 0.270 |
| Height (cm) | 160.56 ± 7.01 | 155.79 ± 7.03 | 0.033 |
| Weight (kg) | 60.81 ± 6.45 | 61.83 ± 10.45 | 0.674 |
| BMI (kg/m2) | 23.71 ± 3.21 | 25.56 ± 4.67 | 0.112 |
| Systolic BP (mmHg) | 120.12 ± 9.64 | 154.24 ± 16.88 | < 0.001 |
| Diastolic BP (mmHg) | 77.56 ± 4.24 | 94.62 ± 12.82 | < 0.001 |
| Total cholesterol (mmol/L) | 5.04 ± 0.67 | 5.54 ± 0.88 | 0.041 |
| Triglycerides (mmol/L) | 1.48 ± 0.66 | 1.66 ± 1.05 | 0.487 |
| HDL-C (mmol/L) | 1.24 ± 0.30 | 1.43 ± 0.29 | 0.061 |
| LDL-C (mmol/L) | 3.31 ± 0.54 | 3.63 ± 0.62 | 0.088 |
| Uric acid (μmol/L) | 396.80 ± 113.24 | 382.32 ± 88.58 | 0.671 |
| Fasting glucose (mmol/L) | 5.83 ± 1.05 | 6.97 ± 2.69 | 0.054 |
a Values are expressed as No. (%) or mean ± SD. Continuous variables were compared using Welch's two-sample t-test; the sex distribution was compared using the chi-square test. Between-group comparisons were unadjusted for multiple testing. Abbreviations: BMI, Body Mass Index; HDL-C, high-density lipoprotein cholesterol; LDL-C, low-density lipoprotein cholesterol.
4.2. Overall Gut Microbiota Composition and Between-Group Differences in Hypertension
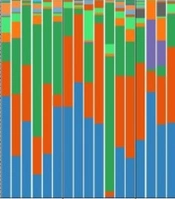
Analysis of the 16S rRNA sequencing data revealed compositional differences in the gut microbiota associated with hypertension. A total of 3,831 OTUs were identified, spanning 45 phyla. The dominant phyla in both the normotensive (n = 16) and hypertensive (n = 34) groups were Firmicutes, Bacteroidetes, Proteobacteria, and Actinobacteria (Figure 1A). Species richness was higher in the normotensive group, as indicated by the species diversity curves (Figure 1B and C) and supported by sample accumulation curves indicating adequate sampling depth (Figure 1D). Taxonomic composition differed between the two groups. At the phylum level, the hypertensive group showed higher Firmicutes (73.7% vs 61.2%) and lower relative abundances of Bacteroidetes (12.1% vs 16.9%) and Proteobacteria (8.2% vs 17.3%) (Wilcoxon rank-sum test, unadjusted P < 0.05). The corresponding ratio of group-mean Firmicutes to group-mean Bacteroidetes abundance was 6.1 in the hypertensive group and 3.6 in the normotensive group; this descriptive index was derived from group means rather than computed per participant, and no inferential test was applied. Relative abundances of the dominant taxa are provided in Table 2. Notably, genus-level alterations further characterized the dysbiotic profile, including higher Blautia and lower relative abundances of Escherichia and Faecalibacterium in the hypertensive group (unadjusted P < 0.05). Multi-level cladogram analysis (Figure 1E) resolved the phylogenetic hierarchy spanning from phylum to genus levels, revealing structural relationships among dominant microbial taxa. Cluster analysis of genus-level abundances (Figure 1F) showed segregation between Firmicutes-dominated hypertensive profiles and Bacteroidetes/Proteobacteria-enriched normotensive clusters.
Table 2.
Relative Abundance (%) of the Dominant Taxa in the Normotensive and Hypertensive Groups a
| Taxonomic Level and Taxon Name | Normotensive (%) | Hypertensive (%) |
|---|---|---|
| Phylum | ||
| Firmicutes | 61.2 | 73.7 |
| Bacteroidetes | 16.9 | 12.1 |
| Proteobacteria | 17.3 | 8.2 |
| Actinobacteria | 2.6 | 2.6 |
| Class | ||
| Clostridia | 51.0 | 62.8 |
| Gammaproteobacteria | 15.5 | 7.2 |
| Bacteroidia | 16.5 | 12.0 |
| Negativicutes | 4.1 | 1.3 |
| Order | ||
| Clostridiales | 51.1 | 62.8 |
| Bacteroidales | 16.5 | 12.0 |
| Enterobacterales | 12.8 | 7.0 |
| Selenomonadales | 4.1 | 1.3 |
| Family | ||
| Lachnospiraceae | 29.5 | 43.8 |
| Ruminococcaceae | 15.6 | 10.3 |
| Enterobacteriaceae | 12.8 | 7.0 |
| Bacteroidaceae | 10.6 | 9.7 |
| Genus | ||
| Blautia | 8.3 | 14.0 |
| Bacteroides | 10.6 | 9.7 |
| Escherichia | 6.9 | 2.9 |
| Faecalibacterium | 6.0 | 2.0 |
a Values are group mean relative abundances. As a large number of taxa were compared relative to the sample size, no false-discovery-rate correction was applied; the differences shown are descriptive and are not presented as confirmatory.
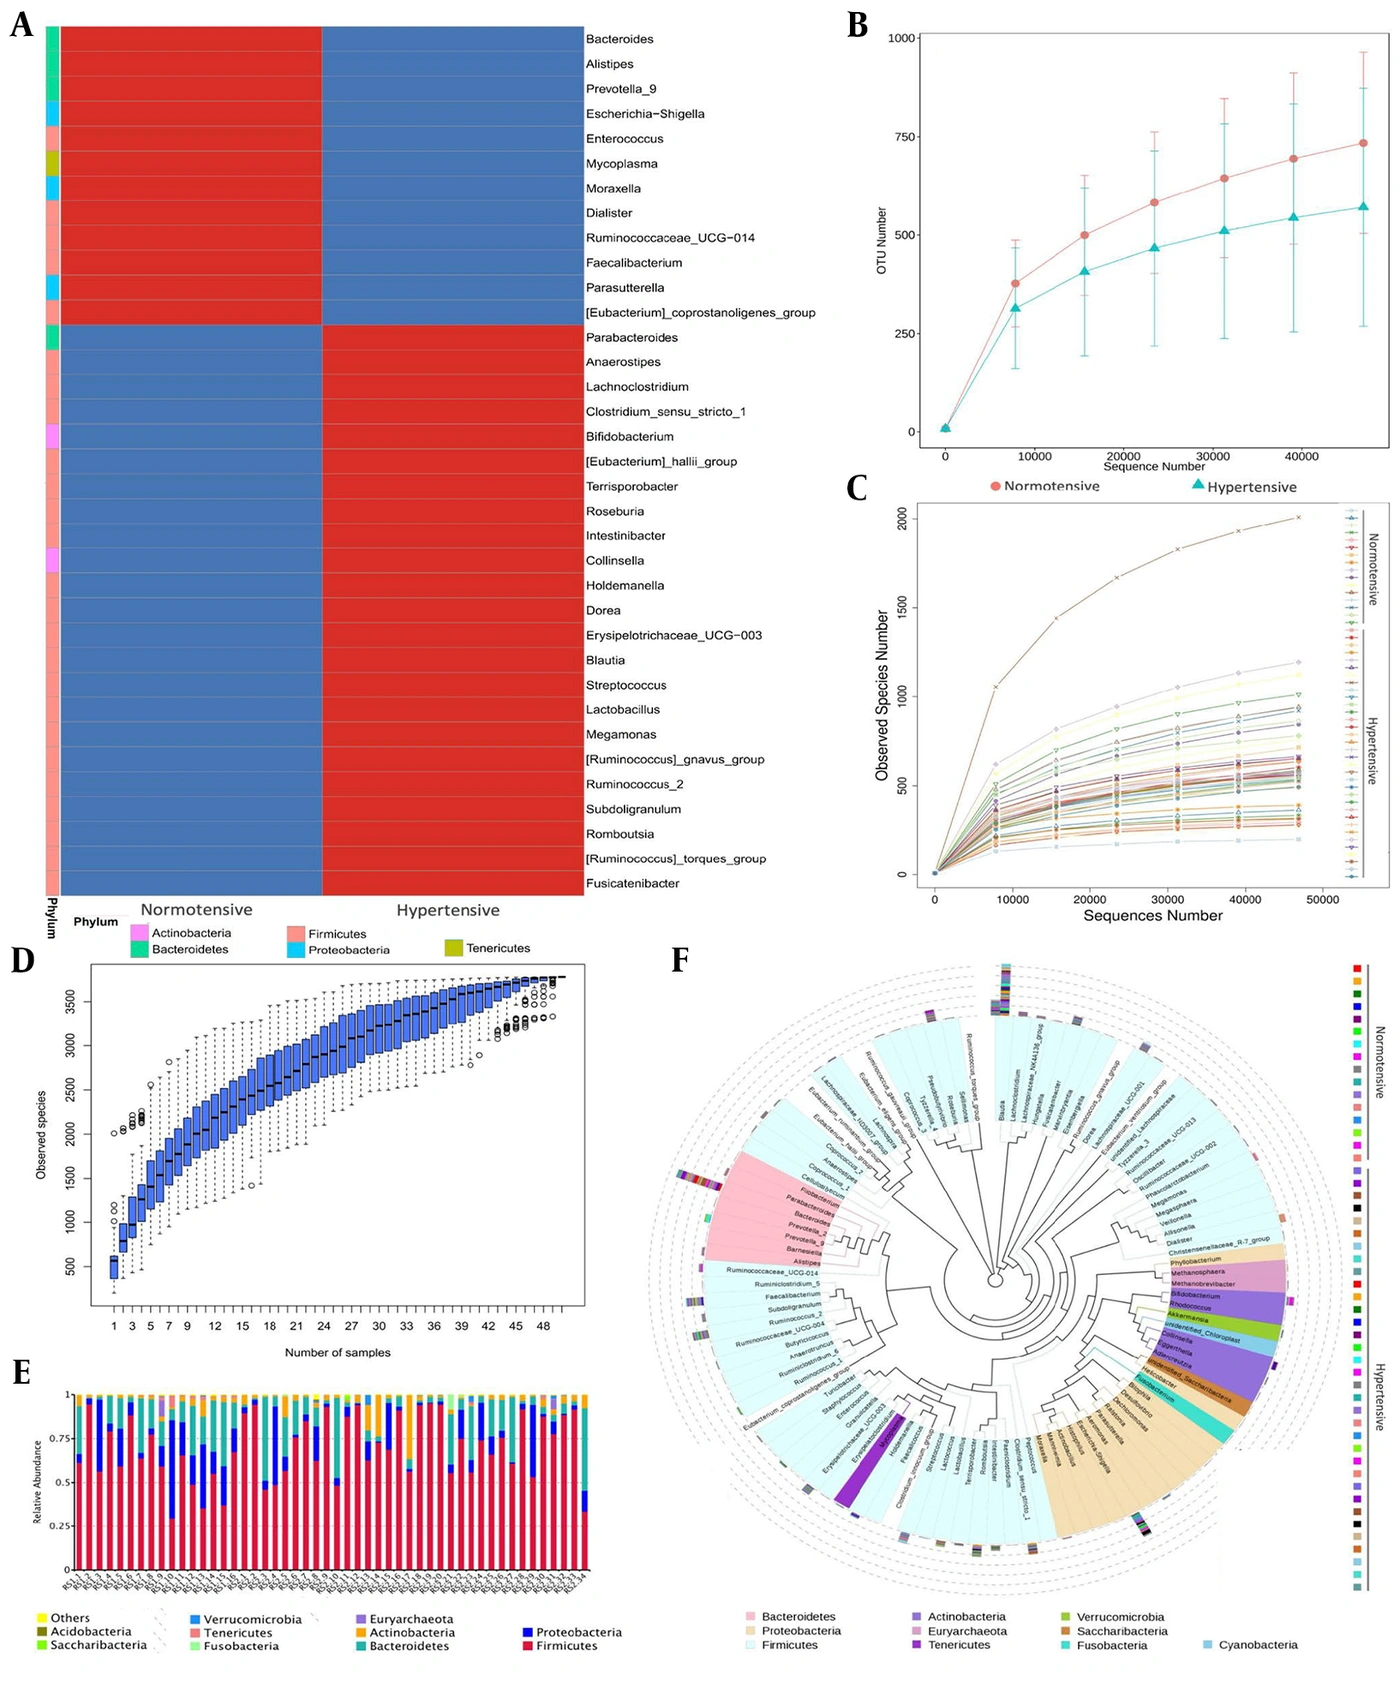
Figure 1.
Overall gut microbiota composition in normotensive (n = 16) and hypertensive (n = 34) groups. (A) Relative abundance histogram at the phylum level (red, high abundance; blue, low abundance); species diversity curves of (B) all samples and (C) analysis by group; (D) species accumulation boxplot; (E) cladogram showing the phylogenetic hierarchy from phylum to genus level; and (F) cluster analysis of genus-level relative abundances between groups.
4.3. Alpha-Diversity Analysis
Alpha-diversity metrics indicated lower microbial richness in the hypertensive group. The normotensive group exhibited higher Chao1, ACE, and observed-species values (all unadjusted P < 0.05; ACE index shown in Figure 2A). Although the Shannon index, reflecting both richness and evenness, was also higher in the normotensive group, this difference was not statistically significant (Figure 2B). Rank abundance curves visually depicted differences in richness and evenness between the two groups (Figure 2C).
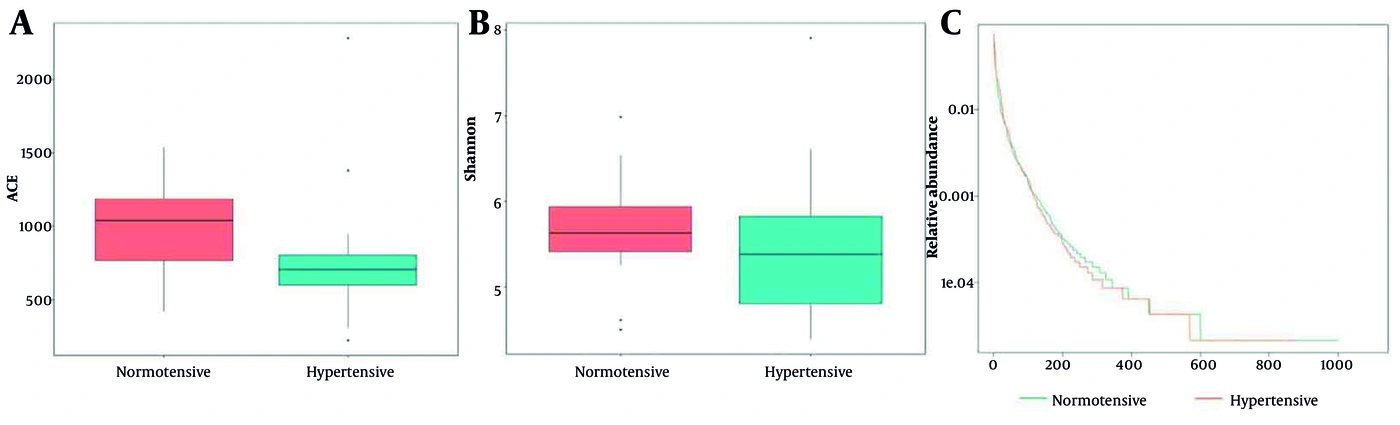
Figure 2.
Alpha-diversity analysis of gut microbiota in normotensive (n = 16) and hypertensive (n = 34) groups. Box plots of the (A) ACE index and (B) Shannon index, and (C) rank abundance curves. Wilcoxon rank-sum tests were used; P values are unadjusted and no correction for multiple comparisons was applied.
4.4. Beta-Diversity and Exploratory Taxon Ranking
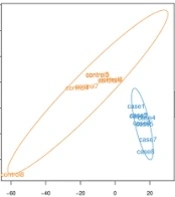
Beta-diversity analysis indicated separation between the gut microbial communities of normotensive and hypertensive individuals. NMDS plots showed differentiation between the two groups (Figure 3A). ANOSIM (r = 0.149, P = 0.019) and MRPP (A = 0.020, P < 0.01) indicated that between-group dissimilarity exceeded within-group dissimilarity; the low R value indicates that the two groups nevertheless overlap substantially (Figure 3B). Network analysis suggested a less complex architecture of microbial co-occurrence in the hypertensive group than in normotensive participants (Figure S2 in the Supplementary File). Exploratory LEfSe ranking (LDA > 2.0) highlighted taxa that differed between groups (Figure 3C and D). Taxa ranked highest in the hypertensive group included members of the Firmicutes phylum, notably the genus Blautia and the family Lachnospiraceae. Taxa ranked highest in the normotensive group included the phylum Proteobacteria and the genera Escherichia, Bacteroides, and Faecalibacterium. Unadjusted Wilcoxon rank-sum tests of specific taxa were consistent with the abundance differences observed in the overall compositional analysis (Figure 3E).
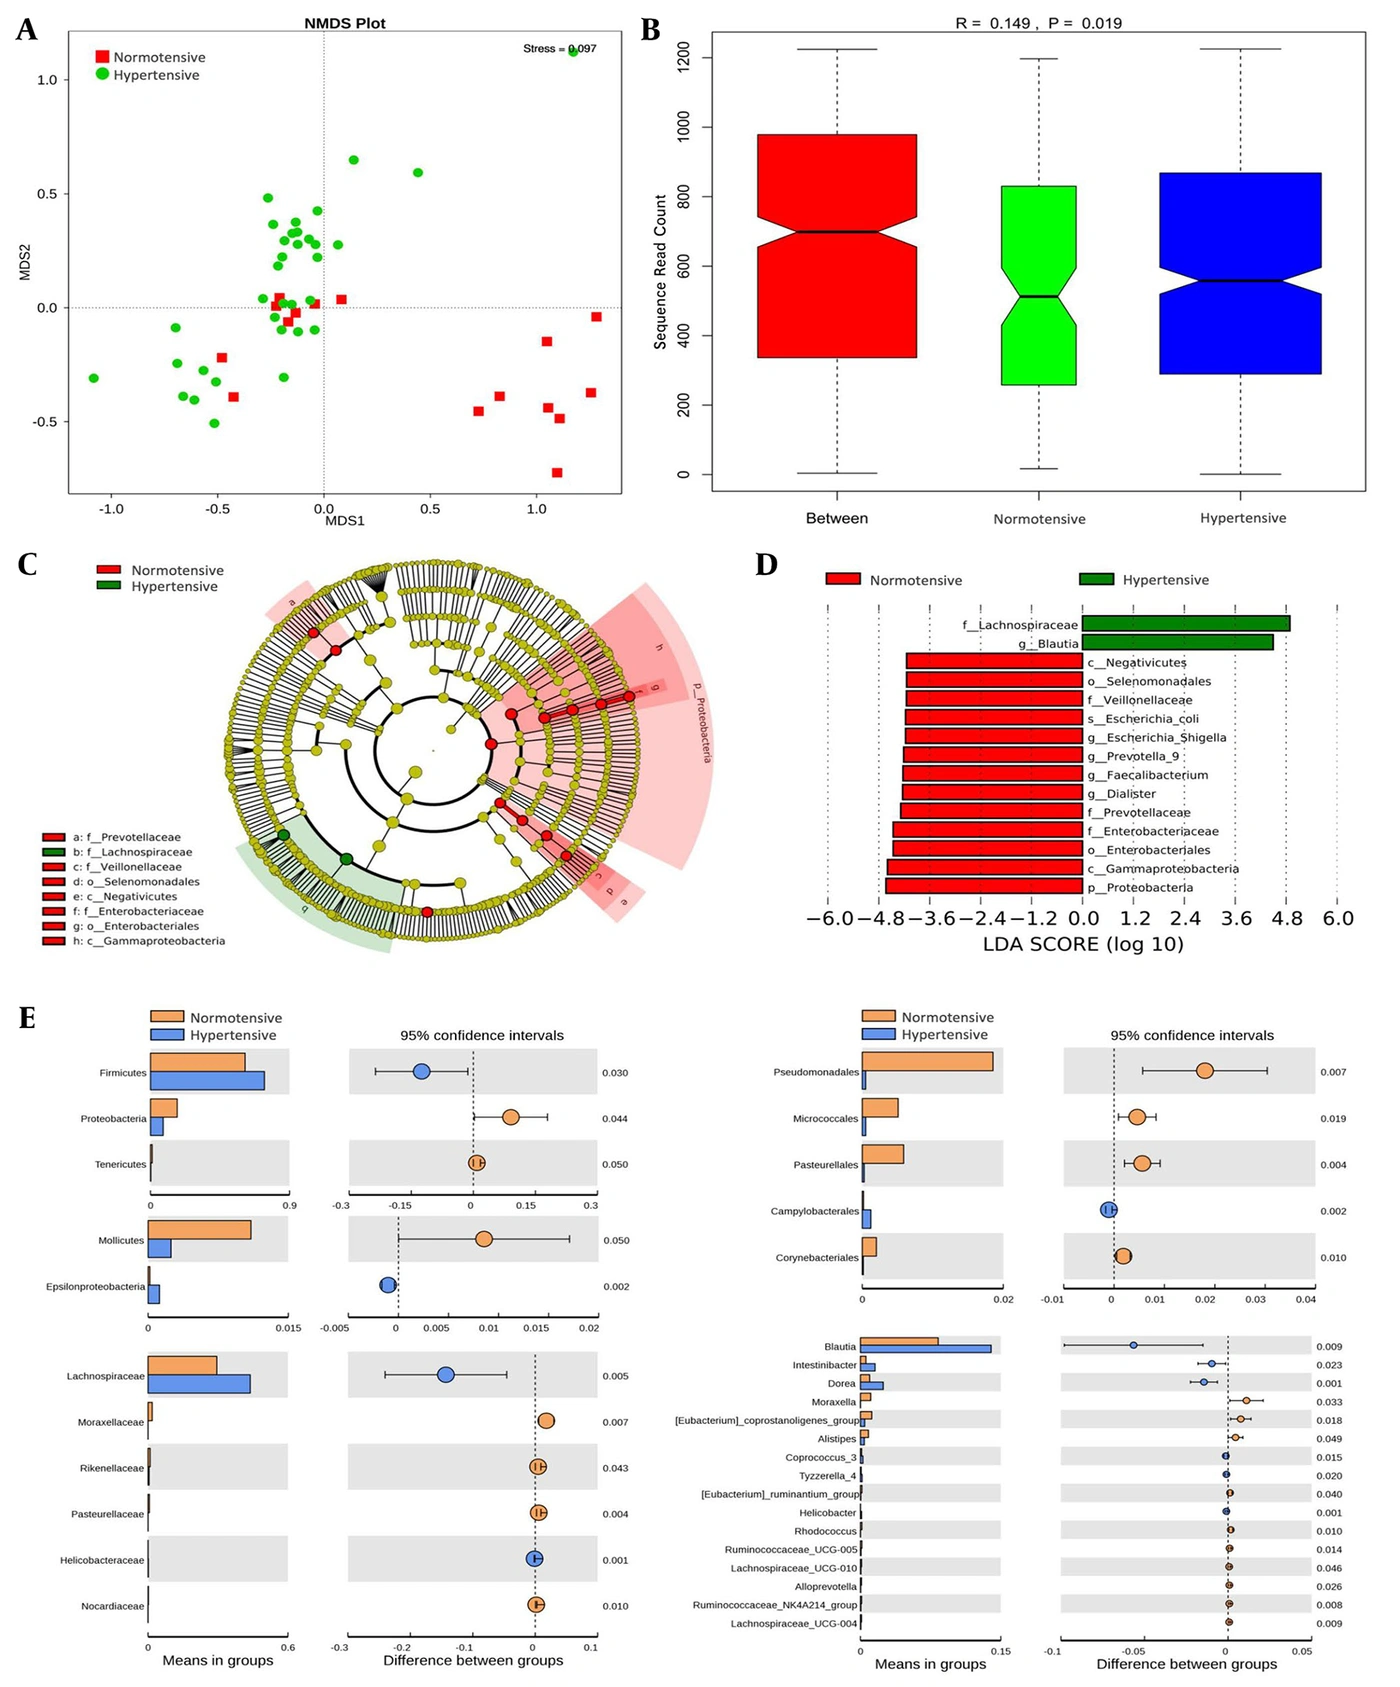
Figure 3.
Beta-diversity analysis of gut microbiota in normotensive (n = 16) and hypertensive (n = 34) groups. (a) NMDS (nonmetric multidimensional scaling) plot, (b) ANOSIM (analysis of similarities) analysis, (c-d) exploratory LEfSe ranking, and (e) unadjusted Wilcoxon rank-sum tests of relative abundance differences in specific taxa between groups. ANOSIM r = 0.149, P = 0.019; MRPP A = 0.020, P < 0.01; LEfSe LDA > 2.0.
4.5. Gut Microbiota Composition Across Demographic and Metabolic Strata in Hypertension
The hypertensive group yielded a total of 2,734 OTUs. Analyses within the hypertensive group (n = 34) showed differences in gut microbiota composition across sex, age, BMI, and lipid strata. Although these analyses reveal factor-specific microbiota patterns within hypertension, the observed differences may reflect either hypertension-specific effects or general population variation unrelated to blood pressure status. The cross-sectional design precludes causal inference. Given the small strata (as few as seven participants) and the large number of taxa evaluated, all stratified comparisons in this section are presented as descriptive, hypothesis-generating summaries without formal statistical testing.
4.5.1. Sex
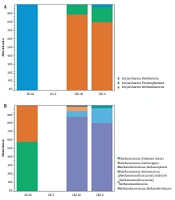
Male hypertensive participants (n = 9) showed a higher Firmicutes-to-Bacteroidetes (F/B) ratio, higher relative abundance of Proteobacteria, and lower relative abundance of Actinobacteria than female participants (n = 25; Figure 4A); this is a within-hypertensive-group comparison and does not contradict the lower overall Proteobacteria abundance in the hypertensive group versus the normotensive group reported in Section 4.2. At the family level, male hypertensive participants showed relatively higher abundances of Enterobacteriaceae and Streptococcaceae and lower abundance of Bacteroidaceae. Exploratory LEfSe ranking placed Fusobacterium highest in men (Figure 4B).
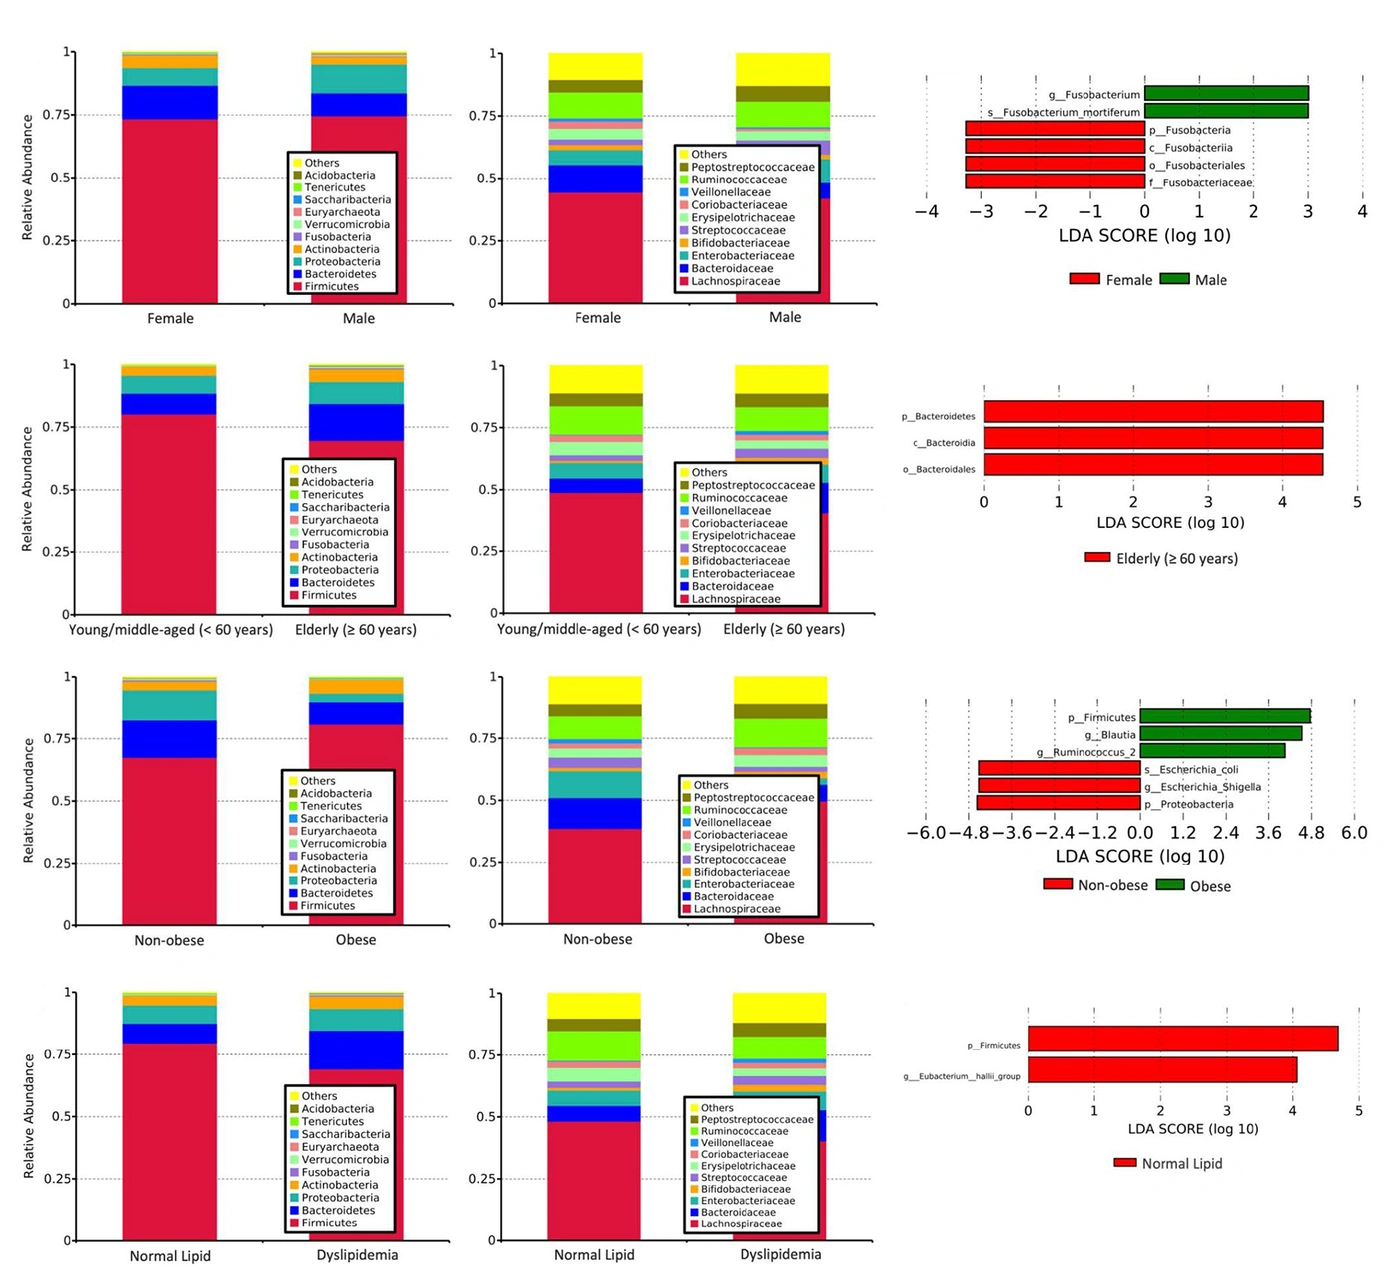
Figure 4.
Gut microbiota across demographic and metabolic strata in the hypertensive group (n = 34). Relative abundance histogram and LEfSe analysis for (A, B) sex strata, male (n = 9), female (n = 25); (C, D) age strata, elderly (≥ 60 years, n = 20) vs young and middle-aged (< 60 years, n = 14); (E, F) BMI strata, non-obese (n = 27) vs obese (n = 7); and (G, H) lipid strata, normal (n = 18) vs dyslipidemia (n = 16). All stratum comparisons are descriptive without formal testing (see Methods 3.6).
4.5.2. Age
Hypertensive participants aged ≥ 60 years (68.70 ± 6.11 years, n = 20) showed a lower F/B ratio and higher relative abundances of Proteobacteria and Actinobacteria than participants aged < 60 years (n = 14) (Figure 4C). At the family level, older hypertensive participants (≥ 60 years) showed relatively lower abundances of Lachnospiraceae and Ruminococcaceae and higher abundance of Bacteroidaceae. Exploratory LEfSe ranking placed Bacteroidetes, Bacteroidia, and Bacteroidales highest in the ≥ 60-year subgroup (Figure 4D).
4.5.3. Body Mass Index
Among the 34 hypertensive participants, 7 had a BMI ≥ 28 kg/m2 (obese group) and 27 had a BMI < 28 kg/m2 (non-obese group). The obese group had a mean BMI of 33.23 ± 3.21 kg/m2, whereas the non-obese group had a mean BMI of 23.45 ± 1.78 kg/m2 (Figure 4E). At the family level, obese hypertensive participants showed relatively higher abundances of Lachnospiraceae and Ruminococcaceae, whereas Enterobacteriaceae abundance was numerically lower. Exploratory LEfSe ranking placed Firmicutes, Blautia, and Ruminococcus highest in the obese subgroup and Escherichia and Proteobacteria highest in the non-obese subgroup (Figure 4F).
4.5.4. Lipid Levels
Sixteen of the 34 hypertensive participants met the prespecified criteria for dyslipidemia (total cholesterol > 5.2 mmol/L); their mean total cholesterol was 6.17 ± 0.57 mmol/L. Compared with those with normal lipids, the dyslipidemic subgroup showed a numerically lower F/B ratio, driven primarily by higher Bacteroidetes abundance (Figure 4G). At the family level, participants with dyslipidemia showed relatively higher abundance of Bacteroidaceae, whereas Enterobacteriaceae abundance was similar in the two subgroups (Figure 4G). Exploratory LEfSe ranking placed Firmicutes and Eubacterium highest in the normal-lipid subgroup (Figure 4H).
A summary of the phylum-level abundance trends associated with these influencing factors within the hypertensive group is presented in Table 3.
Table 3.
Summary of Phylum-Level Abundance Trends Associated with Influencing Factors in the Hypertensive Group a
| Influencing Factor | Firmicutes | Bacteroidetes | Proteobacteria | Actinobacteria |
|---|---|---|---|---|
| Gender | ||||
| Male | ↑ | ↑ | ||
| Female | ↑ | ↑ | ||
| Age (y) | ||||
| < 60 | ↑ | |||
| ≥ 60 | ↑ | ↑ | ↑ | |
| Weight | ||||
| Non-obese | ↑ | ↑ | ||
| Obese | ↑ | ↑ | ||
| Lipid levels | ||||
| Normal | ↑ | |||
| Dyslipidemia | ↑ | ↑ | ↑ |
a The upward arrow (↑) indicates relatively higher abundance of the phylum in that subgroup based on descriptive comparison. Formal statistical testing was not performed given the large number of taxonomic comparisons across subgroups, which would necessitate stringent multiple testing correction and reduce statistical power. These subgroup analyses, based on group mean relative abundances, are exploratory and intended to generate hypotheses, not to confirm differences.
5. Discussion
5.1. Key Gut Microbiota Alterations in Hypertension
In this Chaoshan sample, gut microbiota composition differed between hypertensive and normotensive participants. Consistent with previous research (13, 14), we observed reduced alpha-diversity (species richness) in the hypertension group compared with the normotensive group. Beta-diversity analysis indicated differences in community structure, although the low ANOSIM R value indicates considerable overlap between groups. At the phylum level, hypertensive individuals exhibited a higher F/B ratio, driven primarily by higher Firmicutes abundance (73.7% vs 61.2%) and lower Bacteroidetes (12.1% vs 16.9%) and Proteobacteria (8.2% vs 17.3%). These findings are consistent with studies linking an elevated F/B ratio to hypertension (13, 15). However, the F/B ratio is a coarse summary index whose biological and diagnostic value has been questioned, as it is strongly influenced by sequencing and bioinformatic methodology, diet, and population background; therefore, we report it descriptively and do not treat it as a biomarker of hypertension or dysbiosis. Notably, taxa ranked highest by exploratory LEfSe—Blautia and Lachnospiraceae in the hypertension group, and Bacteroides and Escherichia in the normotensive group—highlight specific taxa potentially involved in blood pressure regulation. The enrichment of Blautia and Lachnospiraceae in our study contrasts with the findings of Li et al. (15), which may reflect differences in geography, diet, sampling, and laboratory methodology between cohorts; host genotype was not measured here and therefore cannot be evaluated as an explanation. Some normotensive participants clustered close to the hypertensive group in the NMDS ordination (Figure 3A). Given the single time point, lack of genotyping, and absence of measurements of barrier function or microbial metabolites, this overlap cannot be interpreted mechanistically and is reported only as a feature of the ordination. Mendelian randomization approaches have begun to clarify causal directions in microbiota–disease associations (25), but such causal inference methods were beyond the scope of the present descriptive cross-sectional study.
5.2. Microbiota Composition Across Demographic and Metabolic Strata in Hypertension
Within the hypertensive group, composition differed across strata. Because these strata were small (as few as seven participants) and many taxa were compared, the patterns below are presented as descriptive, hypothesis-generating summaries rather than tested differences. Male hypertensive participants showed a higher F/B ratio and lower Actinobacteria abundance than females, with enrichment of Enterobacteriaceae, whereas females showed higher Bacteroidaceae abundance; these differences may relate to sex hormones and immune variation, neither of which was measured in this study. Age-related patterns were also observed: hypertensive participants aged ≥ 60 years had a lower F/B ratio and higher relative abundances of Proteobacteria, Actinobacteria, and Bacteroidetes-related taxa (also ranked highest by exploratory LEfSe) than those < 60 years, consistent with findings of increased Bacteroidetes in older primates and humans (26, 27). Composition also differed across BMI strata: obese hypertensive participants showed reduced richness, an elevated F/B ratio, and higher Ruminococcaceae abundance, a pattern reported in obesity (11); functional capacity was not assessed. Composition likewise differed across lipid strata: dyslipidemic hypertensive participants showed a lower F/B ratio with Bacteroidaceae enrichment and Eubacteriaceae depletion; these are taxonomic observations only, and short-chain fatty acid and bile-acid metabolism were not measured.
5.3. The Chaoshan Population as a Unique Context for Future Genetic-Microbiota Studies
The Chaoshan population has distinct genetic polymorphisms, including variation at the HLA-A and HLA-B loci, that differentiate it from northern Han Chinese and group it with southern Han Chinese (17). Although this study did not directly assess genotype–microbiota associations, the well-documented genetic architecture of the Chaoshan population makes it a suitable cohort for future hypothesis-driven investigations into how host genetics modulate microbiota–hypertension interactions. The specific discrepancies observed in our study—enriched Blautia and reduced Proteobacteria, in contrast to other reports (6, 15)—cannot be attributed to any single cause; population genetic background is one of several potential contributors, alongside diet, geography, and differences in sampling and sequencing methodology. Population-level variation in gut microbiota composition is increasingly recognized (27), and genetic variation can influence immune responses, mucosal barrier function, and metabolite processing, all of which shape the gut ecosystem. Based on our descriptive findings, we propose that future mechanistic studies should explicitly investigate how Chaoshan-specific polymorphisms interact with the identified microbiota alterations to influence hypertension susceptibility. This genetic context may be relevant to the development of targeted interventions.
5.4. Therapeutic Potential and Mechanisms
The considerations in this section are hypotheses outside the present dataset; none was tested here. The observed compositional differences, reduced diversity, an elevated F/B ratio, and taxon-specific changes have been proposed to make the gut microbiota a potential therapeutic target, although no intervention was tested in the present study. Enrichment of Blautia and Lachnospiraceae in hypertension warrants investigation of their functional roles and metabolites. Conversely, reduced abundance of SCFA-producing bacteria in hypertension may impair blood pressure regulation, as short-chain fatty acids such as acetate and propionate have been reported to influence blood pressure through Olfr78 and Gpr41 in experimental models (9). Potential strategies include restoring beneficial taxa (e.g., Faecalibacterium) or reducing detrimental taxa (e.g., specific Firmicutes). Probiotics, prebiotics, and fecal microbiota transplantation offer potential avenues (28, 29), although outcomes are strain-specific. FMT, while successful in other conditions (30), requires rigorous donor screening and a deeper understanding of optimal microbial consortia for hypertension. Microbial modulation represents a promising novel approach to complement traditional pharmacotherapy.
5.5. Limitations and Future Directions
First, the sample of 50 participants was relatively small, and subgroup sizes were even smaller (as few as seven obese participants). Given these small strata and the large number of taxonomic comparisons, formal statistical testing was not performed for subgroup analyses; all stratified comparisons are descriptive and hypothesis-generating. Between-group taxon comparisons were also unadjusted for multiple testing, and no covariate-adjusted models were fitted. Confidence intervals and effect sizes were not computed for these descriptive taxonomic comparisons. Group separation was assessed using ANOSIM and MRPP rather than PERMANOVA with a formal test of multivariate dispersion, and the low ANOSIM R value of 0.149 indicates modest separation. The unequal group sizes (16 normotensive versus 34 hypertensive) further reduced statistical power. In addition, the F/B ratio could be derived only from group means, as participant-level sequence counts needed to reconstruct an individual-level F/B distribution were unavailable. Therefore, all taxonomic differences reported here require confirmation in an independent, larger cohort.
Second, the unmatched case-control design may not have fully controlled for confounders. The hypertensive group had a higher proportion of females (73.5% vs 50.0%), which may confound sex-specific microbiota patterns and warrants adjustment in future larger cohorts. Secondary hypertension was screened using a structured questionnaire rather than systematic clinical diagnosis, which may introduce misclassification. The cross-sectional design precludes causal inference between dysbiosis and hypertension; longitudinal studies are needed to determine whether the observed differences are consequences of, or contributors to, hypertension pathogenesis. No external comparison population was recruited, and no host genotyping was performed; therefore, neither regional specificity nor any genotype–microbiota relationship was tested. Nevertheless, this pragmatic design reflects real-world clinical recruitment constraints and is consistent with similar observational microbiome studies (7).
Third, several key exposures were measured with limited precision. Dietary habits were collected via questionnaire, but quantitative dietary assessment (e.g., 3-day food records or a full food-frequency questionnaire) was not performed, limiting our ability to fully disentangle diet–microbiota interactions; diet is a major modulator of gut microbiota composition (31). Although all participants reported no lifetime antihypertensive use and responses were cross-checked against available medical records, medication history relied on self-report, and residual misclassification cannot be excluded.
Finally, 16S rRNA sequencing reveals taxonomic shifts but not functional capacity (e.g., SCFA/TMAO production). The data are compositional, and differential-abundance methods that account for this, such as ANCOM-BC or ALDEx2, were not applied; future analyses should use compositionally aware approaches together with effect sizes and false-discovery-rate control. Technical replicates were not run, and negative extraction controls and PCR blanks were not included in the sequencing run; therefore, low-level contamination cannot be definitively excluded. However, the dominant taxa observed (Firmicutes, Bacteroidetes, Proteobacteria, and Actinobacteria) are consistent with well-characterized gut microbiota profiles, making substantial contamination unlikely. Recent advances in multi-kingdom microbiota analysis, such as the identification of bacterial–fungal–viral dysbiosis in pulmonary arterial hypertension (8), underscore the need to move beyond bacterial 16S profiling and to integrate multi-compartment metabolomics in future multi-omics work (32).
5.6. Conclusions
This cross-sectional case-control study describes differences in gut microbiota composition between hypertensive and normotensive participants from the Chaoshan region of China, including reduced species richness, modest community-level separation, an elevated group-mean F/B ratio, and taxon-specific changes such as higher Blautia and lower Faecalibacterium in the hypertensive group. Within hypertension, composition also differed across sex, age, weight, and lipid strata, although these stratified comparisons are descriptive and hypothesis-generating. Discrepancies from other reported cohorts may reflect population background, diet, geography, or methodological variation; host genotype was not measured and cannot be evaluated here. These descriptive findings warrant confirmation in larger, longitudinal studies that integrate multi-omics approaches and host genetics to clarify the microbiota–hypertension axis and inform potential microbiota-based interventions.