
1. Background
Paraquat (1, 1’-dimethyl-4, 4’-bipyridinium dichloride, PQ) also called as Gramoxone or methylviologen, is a quaternary nitrogen herbicide commonly used for broadleaf weed control in farming due to its great efficiency and minimal residue in crops (1).
PQ is the main concern to humans when exposed through direct contact, voluntary intake or incidental oral administration, or via bioaccumulation in food chain (2) .Globally, 250,000 to 370,000 individuals annually die from PQ poisoning (1). Pulmonary fibrosis is the main cause of death from PQ poisoning (3, 4).
PQ is principally accumulated in the lung via a process of active transporter into the Clara cells and alveolar types I and II epithelial cells (5). PQ-induced pulmonary fibrosis occurs in 2 different phases: 1, An early destructive phase or acute injury, within a few days, characterized by damage and destruction of alveolar epithelial cells and pulmonary edema; 2, Final pulmonary fibrotic phase, lasts for several weeks, occurrence of pulmonary interstitial fibrosis (PIF) via infiltration of inflammatory cells followed by fibroblast proliferation and collagen deposition (6).
The main potential mechanism of PQ toxicity is mediated by generation of reactive oxygen species (7) including superoxide anions, singlet oxygen, and other free radicals (8). These mediators induce the expression of proinflammatory cytokines such as interleukin 1β (IL-1β), interleukin 6 (IL-6), tumor necrosis factor α (TNF-α), and transforming growth factor-β1 (TGF-β1) that may be the core of PQ-induced lung injury and fibrosis (9).
Specific antidotes or effective treatment is still unavailable for PQ poisoning, consequently the mortality rate following PQ intake is high (10).
Phenolic compounds have different benefit pharmacological effects that appear to correlate with their potent possession of antioxidant effects (11). The radical-scavenging activity of phenolic compounds is mainly due to their potent ability to scavenge free radicals (superoxide anions, hydrogen peroxides, and hydroxyl radicals) and protect cells from oxidative damage (12).
Gallic acid (3, 4, 5-trihydroxybenzoic acid, GA) has the most important polyphenol compounds (13). Berries, mango, green tea, walnut, and grapes are the rich sources of GA (14). Due to free radical scavenger effect, the GA-containing plant extracts have anti-inflammatory and anti-fibrotic effects (15). Authors’ pervious study showed that GA, by its antioxidant properties, attenuates oxidative damage and fibrosis induced by bleomycin (15). The current study aimed at evaluating the therapeutic effect of GA, as an effective antioxidant against toxicant-induced oxidative stress to reduce PQ-induced pulmonary fibrosis in experimental rats.
2. Methods
2.1. Chemicals
Chloramine T, 5,5’-dithiobis (2-nitrobenzoic acid) (DTNB), reduced glutathione (GSH), trichloro acetic acid (TCA), bovine serum albumin (BSA), GA, PQ, hydroxyproline, Bradford reagent, p-dimethylaminobenzaldehyde, and thiobarbituric acid (TBA) were obtained from Sigma-Aldrich Chemical company (St. Louis, MO). All other chemicals were of analytical grade.
2.2. Animals
Male Wistar rats, 8-week-old and weighting 200 ± 25 g, were obtained from animal house and research center of Jundishapur University of Medical Sciences, Ahvaz, Iran. The rats were kept, at controlled condition of temperature (25 ± 2°C) with a 12:12 hour light/dark cycle, in polycarbonate cages. All of them were given standard rat chow and drinking water ad libitum. All experimental procedures were performed according to the ethical standards and protocols approved by the committee of animal experimentation of Ahvaz Jundishapur University of Medical Sciences, Ahvaz, Iran (Reg. No. IR.AJUMS.REC.1395.108).
2.3. Experimental Design
The animals were randomly divided into 5 experimental groups, each containing 14 rats. Group 1 received normal saline (2 mL/kg, orally) for 21 days, group 2 received a single dose of PQ (50 mg/kg, orally), groups 3 to 5 were treated with different doses of GA (50, 100, 200 mg/kg, orally) 1 hour after single dose of PQ (50 mg/kg, orally) for 21 days.
2.4. Tissue Collection
On days 7 and 21, seven rats of each group were sacrificed using ketamine and xylazine over dose. After starting the pleural cavities, lungs were removed immediately and washed with saline. Then, the weight of collected tissue was recorded for each animal. The left lung lobe was separated and saved in 10% buffered formalin for histopathological evaluation. The right lung lobes were kept in -80°C until used for biochemical assay.
2.5. Body Weight and Lung Index
Throughout the course of the research, the body weight of animal was recorded on 0, 7, and 21 days. When the animals expired, the lung index showed the ratio of wet lung weight (mg) to body weight (g).
2.6. Hydroxyproline Content Assay
The amount of collagen in the lung was measured by HP quantitation. A colorimetric assay was used to determine the HP content of the lung tissue as described by Reddy and Enwemeka (16). Briefly, 100 mg samples were homogenized in KCl (150 mM, pH 7.4) and then, digested in HCl 6 M at 130°C for 5 hours. To each sample was added NaOH to adjust the pH to 6.5 - 7.0 and the volume of samples was adjusted to 30 mL with distilled water. Then, 1.0 mL of chloramine T solution (0.05 M/L) was added to sample solutions (1 mL) and the mixture was allowed to stay at room temperature for 20 minutes. After the addition of 1 mL of 20% dimethylbenzaldehyde solution, the mixture was placed at 60°C for 20 minutes. For each sample, the absorbance was read at 550 nm and data were expressed as HP (mg) per wet lung weight (g) using HP standards.
2.7. Measurement of TGF-β1, IL-6, and TNF-α Levels
The samples were homogenized in Tris-HCl buffer (pH = 7.4) containing protease inhibitors (trypsin and other serine and cysteine proteases). All homogenized samples were centrifuged at 20,000 × g, 4°C in a refrigerated centrifuge for 20 minutes and the supernatant was taken and frozen at -80°C. Supernatant samples were thawed and analyzed for cytokine TGF-β1, TNF-α, and IL-6 levels using specific ELISA kits (eBioscience). TGF-β1, TNF-α, and IL-6 concentrations in the samples were expressed as cytokine (pg) /protein (mg).
2.8. Lipid Peroxidation (MDA) Assay
MDA level was measured based on the Buege and Aust method (17). Briefly, 2.5 mL of TCA (10%, w/v) was added to 0.5 mL of homogenized tissue (prepared with 0.1 M Tris-HCl buffer (pH 7.4) at 4°C) and centrifuged at 3000 rpm for 10 minutes. One milliliter of TBA solution (0.67%, w/v) was added to 2 mL of samples supernatant in pipes. Then, all pipes containing samples supernatant and TBA solution were kept in boiling water for 10 minutes until forming a pink-colored solution. After cooling, the absorbance was measured at 532 nm by a spectrophotometer. The concentration of MDA was calculated using the absorbance coefficient of the TBA-MDA complex (ε = 1.56 × 105 cm-1 M-1). To express the results of certain parameters, the protein content in homogenates was measured using the Bradford method (18).
2.9. GSH Level Assay
The levels of GSH in the tissue homogenate was measured following the method described by Ellman (19) based on the formation of a yellow-colored complex with Ellman reagent (DTNB). The tissue homogenate samples (prepared with 0.1 M Tris-HCl buffer (pH 7.4) at 4°C) were immediately precipitated with 0.1 mL of 25% TCA and the precipitate was removed after centrifugation. Free endogenous-SH was assayed in a 3-mL glass by addition of 2 mL of 0.5 mM DTNB prepared in 0.2 M phosphate buffer (pH = 8) to 0.1 mL of the supernatant, and the developed yellow-colored was read at 412 nm using a spectrophotometer (UV-1650 PC, Shimadzu, Japan). GSH content was expressed as nM/mg protein.
2.10. Catalase Activity Assay
CAT activity in the tissue was assayed bases on the Aebi protocol (20). In a cuvette containing 200 µL phosphate buffer and 50 µL of tissue supernatant (obtained after centrifugation of tissue homogenate at 12,000 g for 20 minutes at 4°C), 250 µL of 0.066 M H2O2 was added and decrease in optical density (OD) was measured at 240 nm for 60 seconds. One unit of activity equals to the moles of H2O2 degraded (per minute), divided by the number of milligrams of protein in the tissue supernatant. The molar extinction coefficient of 43.6 M-1 cm-1 was used to determine catalase activity.
2.11. Superoxide Dismutase Activity Assay
SOD activity in the tissue was assayed using the Martin method (21). Briefly, tissue supernatant attained after centrifugation at 12,000 g for 20 minutes at 4°C was assessed spectrophotometrically by determining the rate of inhibition of auto-oxidation of hematoxylin and expressed as U/mg protein.
2.12. Glutathione Peroxidase Assay
GPx is the common term of an enzyme group with peroxidase activity that its major biological function is to protect the organism from oxidative injury. The biochemical operate of GPx is to reduce lipid hydroperoxides to their corresponding alcohols and reduce free hydrogen peroxide to water (22). The activity of GPX in the lung tissue was measured by GPx activity measured with the GPX kit (Randox Labs, Crumlin, UK).
2.13. Lung Histological Studies
On the days 7 and 21, after blood collection, the left lung lobes of rats were fixed in 10% formalin solution, and then, dehydrated in graded alcohol concentrations and embedded in paraffin. Sections of 4 - 6-µm were prepared and stained with the Masson trichrome and hematoxylin and eosin (H and E). Six microscopic slides per animal were examined to assess the histological changes such as congestion of red blood cells (RBCs), and infiltration of inflammatory cells; fibrotic changes were analyzed using the quantitative fibrotic scale (the Ashcroft scale) (23). For each slide, the mean of 6 fields was calculated at a magnification of × 400 and the average score of all fields was considered as the fibrotic score. Slides were evaluated in a blind fashion.
2.14. Statistical Analysis
The results were expressed as mean ± standard deviation (SD). The statistical analyses were performed using one-way ANOVA followed by the Tukey test by GraphPad Prism version 5.01 (GraphPad Software Inc., San Diego, CA, USA). For all tests, differences with values of P < 0.05 were considered significant.
3. Results
3.1. Survival Rate
There was no animal mortality due to PQ treatment in the current study.
3.2. Effects of GA and PQ on Lung Indices
On the day 7, the lung index increased significantly in the PQ-treated and the PQ plus GA (50, 100, and 200 mg/kg) groups compared with the control group. The lung index in the PQ and the PQ plus GA groups (50 and 100 mg/kg, P < 0.001and 200 mg/kg; P < 0.05) significantly increased compared with that of the control group on the day 21. Though, the lung index significantly decreased in rats treated with GA (100 and 200 mg/kg) (P < 0.001) compared with the PQ group (Figure 1) on the day 21.
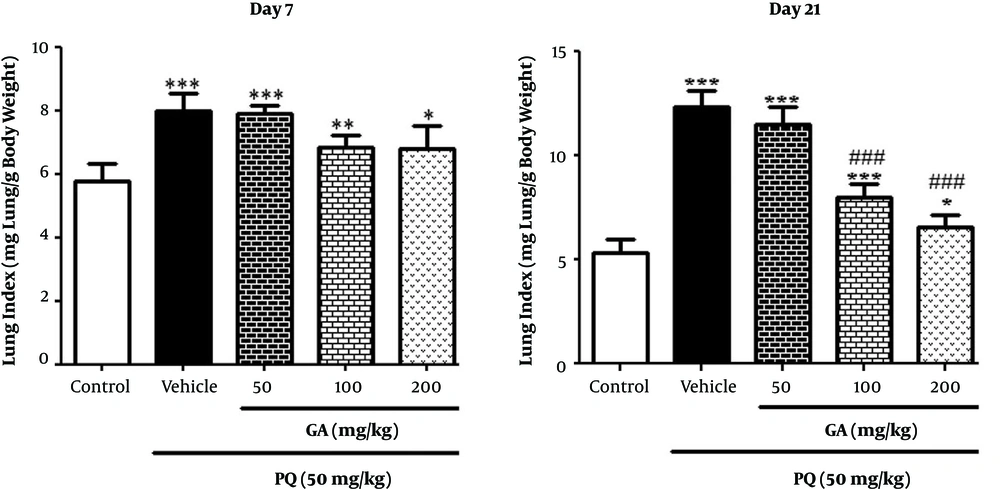
Figure 1.
Values are expressed as mean ± SD (n = 7). Data were analyzed by the one-way ANOVA test followed by the Tukey post hoc test for multiple comparisons. * Significant increase of lung index in comparison with the control group (*P < 0.05, **P < 0.01, ***P < 0.001). # Significant decrease of lung index in comparison with the PQ group (#P < 0.05, ##P < 0.01, ###P < 0.001)
3.3. Effects of GA and PQ on HP Content of Lung Tissue
The current study measured the HP content as a fibrosis marker in the lung tissue on the days 7 and 21. As shown in Figure 2, on the day 7, the HP content increased significantly in the lungs of PQ-treated and PQ plus GA (50 and 100 mg/kg; P < 0.001) groups compared with those of the control group. Treatment with GA (100 and 200 mg/kg; P < 0.01 and P < 0.001, respectively) significantly reduced the content of HP in lung tissue compared to that of the PQ-treated group.
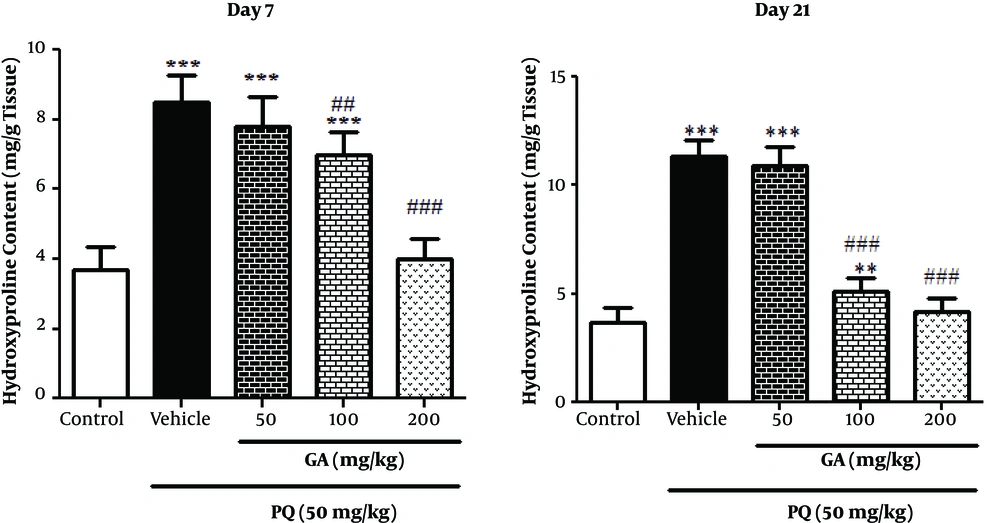
Figure 2.
Values are expressed as mean ± SD (n = 7). Data were analyzed by the one-way ANOVA test followed by the Tukey post hoc test for multiple comparisons. * Significant increase of lung index in comparison with the control group (*P < 0.05, **P < 0.01, ***P < 0.001). # Significant decrease of lung index in comparison with the PQ group (#P < 0.05, ##P < 0.01, ###P < 0.001).
On the day 21 the HP content in lungs of the PQ-treated and PQ plus GA (50 and 100 mg/kg) rats significantly increased compared with that of the ones in the control group (P < 0.001 and P < 0.01, respectively). Administration of GA (100 and 200 mg/kg) significantly reduced the content of HP in lung tissue compared with that of the ones in the PQ-treated group (P < 0.001).
3.4. The Effects of GA and PQ on the MDA Level
On the day 7, the study data showed a significant rise in MDA level and a lipid peroxidation index, in lungs of rats exposed to PQ and PQ plus GA (P < 0.001) when compared with the control group. As shown in Figure 3, on the day 7 a significant decrease was observed in MDA level in rats treated with GA (200 mg/kg) compared with the ones in the PQ group (P < 0.05). Results obtained from Figure 3 showed a significant rise in MDA level in lungs of rats exposed to PQ and PQ plus GA at the dose of 50 mg/kg (P < 0.001) and PQ plus GA at the dose of 100 mg/kg (P < 0.01) when compared with that of the ones in the control group. In addition, decrease in MDA level was observed in rats treated with GA 100 and 200 mg/kg (P < 0.001) on the day 21 compared with that of the ones in the PQ group.
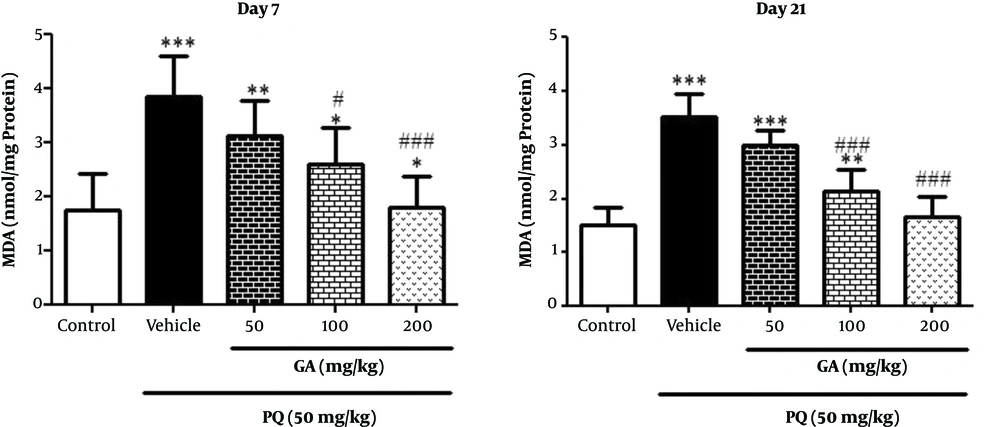
Figure 3.
Values are expressed as mean ± SD (n = 7). Data were analyzed by the one-way ANOVA test followed by the Tukey post hoc test for multiple comparisons. * Significant increase of lung index in comparison with the control group (*P < 0.05, **P < 0.01, ***P < 0.001). # Significant decrease of lung index in comparison with the PQ group (#P < 0.05, ##P < 0.01, ###P < 0.001).
3.5. The Effects of GA and PQ on the GSH Level
Results obtained from Figure 4, on the day 7 showed that GSH level significantly decreased in the lungs of rats exposed to PQ and PQ plus GA 50 and 100 mg/kg (P < 0.001) and 200mg/kg (P < 0.05) when compared with that of the ones in the control group. As shown in Figure 4, on the day 7 enhancement in GSH level was observed in rats treated with GA (200 mg/kg; P < 0.001) compared with the ones in the PQ group. On the day 21, PQ treatment significantly increased (P < 0.001) GSH level in PQ, while PQ plus GA at the dose of 50 mg/kg and treatment with 2 doses of GA 100 and 200 mg/kg significantly inhibited (P < 0.001) the PQ-induced reduction of GSH content on the day 21 (Figure 4).
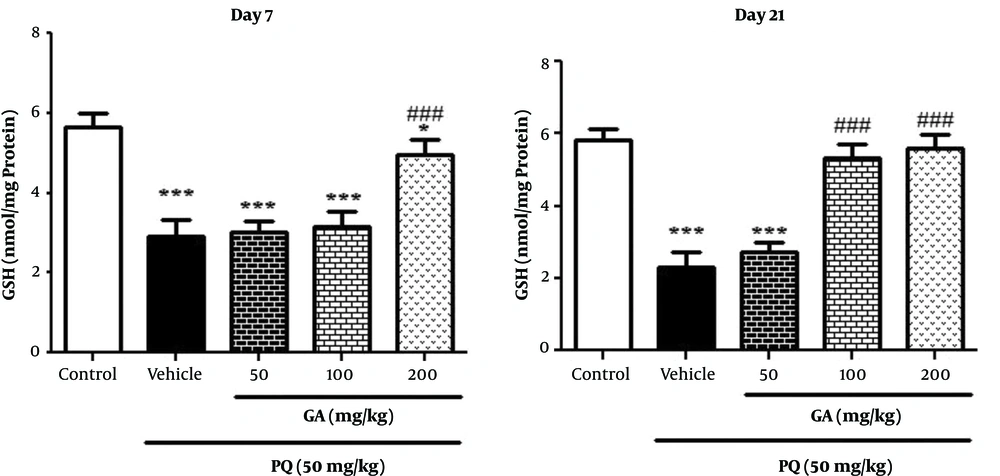
Figure 4.
Values are expressed as mean ± SD (n = 7). Data were analyzed by the one-way ANOVA test followed by the Tukey post hoc test for multiple comparisons. * Significant increase of lung index in comparison with the control group (*P < 0.05, **P < 0.01, ***P < 0.001). # Significant decrease of lung index in comparison with the PQ group (#P < 0.05, ##P < 0.01, ###P < 0.001).
3.6. The Effects of GA and PQ on Enzymatic Antioxidant Status
As presented in Figure 5, PQ and PQ plus GA (50 and 100 mg/kg) significantly decreased the SOD activity, compared with the control group on the day 7 (P < 0.001). The treatment with GA at the dose of 200 mg/kg significantly increased the SOD activity, in comparison with the PQ group on the day 7 (P < 0.01). On the day 21, PQ and PQ plus GA (50 and 100 mg/kg) significantly decreased the SOD activity, compared with the control group (P < 0.001 and P < 0.01, respectively) (Figure 5); while treatment with GA at the doses of 100 and 200 mg/kg significantly increased the SOD activity, in comparison with the PQ group on the day 21 (P < 0.05 and P < 0.01, respectively).
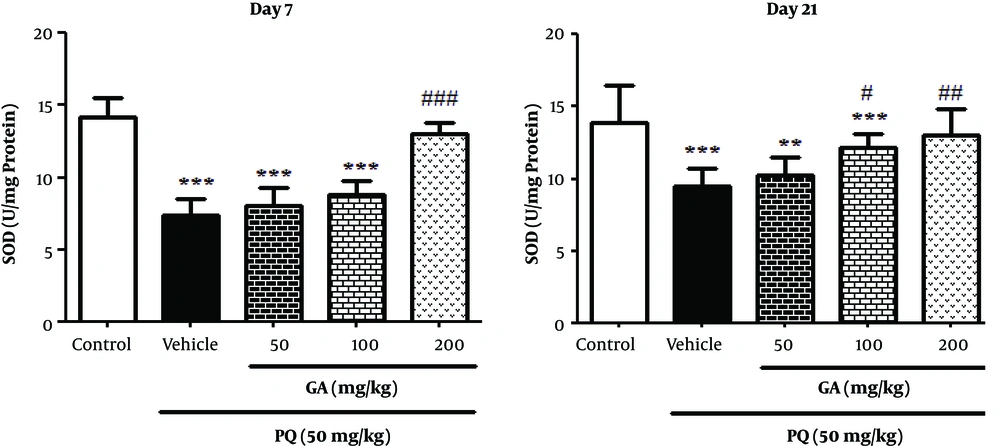
Figure 5.
Values are expressed as mean ± SD (n = 7). Data were analyzed by the one-way ANOVA test followed by the Tukey post hoc test for multiple comparisons. * Significant increase of lung index in comparison with the control group (*P < 0.05, **P < 0.01, ***P < 0.001). # Significant decrease of lung index in comparison with the PQ group (#P < 0.05, ##P< 0.01, ###P < 0.001).
Result obtained from Figure 6 showed that PQ and PQ plus GA at the dose of 50 mg/kg significantly decreased the CAT activity, compared with the control group (P < 0.001) and the treatment with GA at doses of 100 and 200 mg/kg significantly increased the CAT activity, in comparison with the PQ group on the day 7 (P < 0.05 and P < 0.01, respectively). As shown in Figure 6, CAT activity significantly decreased in PQ and PQ plus GA (50 and 100 mg/kg) groups compared with the control group (P < 0.001 and P < 0.01, respectively) on the day 21 and also GA at 2 doses of 100 and 200 mg/kg (P < 0.01 and P < 0.001, respectively) significantly prevented the depletion of CAT activity.
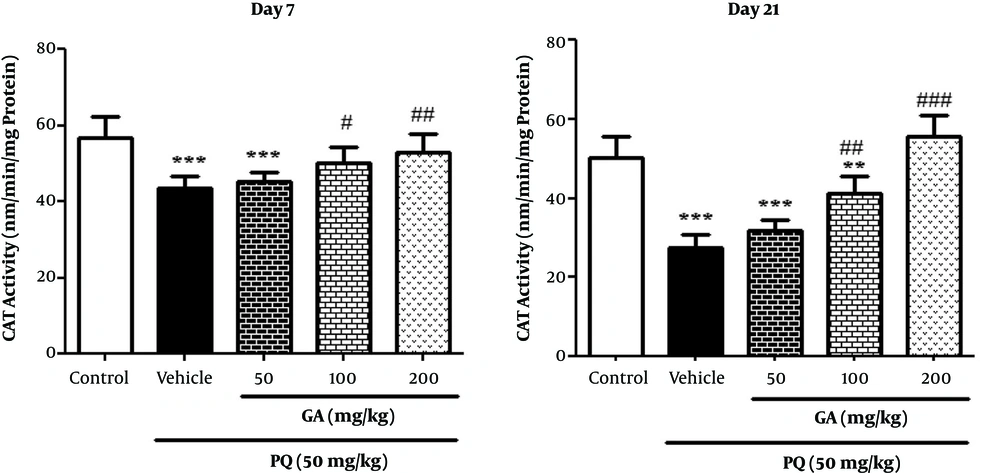
Figure 6.
Values are expressed as mean ± SD (n = 7). Data were analyzed by the one-way ANOVA test followed by the Tukey post hoc test for multiple comparisons. * Significant increase of lung index in comparison with the control group (*P < 0.05, **P < 0.01, ***P < 0.001). # Significant decrease of lung index in comparison with the PQ group (#P < 0.05, ##P < 0.01, ###P < 0.001).
Results in Figure 7 showed that PQ significantly decreased GPx activity in PQ and PQ plus GA (50,100, and 200 mg/kg) groups compared with the control group on the day 7 (P < 0.001). Treatment with GA at the dose of 200 mg/kg significantly increased GPx activity, compared with that of the PQ group on the day 7 (P < 0.05). On the day 21, PQ intoxication resulted in a significant decreases in pulmonary GPx activity, which was remarkably reversed by treatment with GA at the doses of 100 and 200 mg/kg (P < 0.01 and P < 0.001, respectively) (Figure 7).
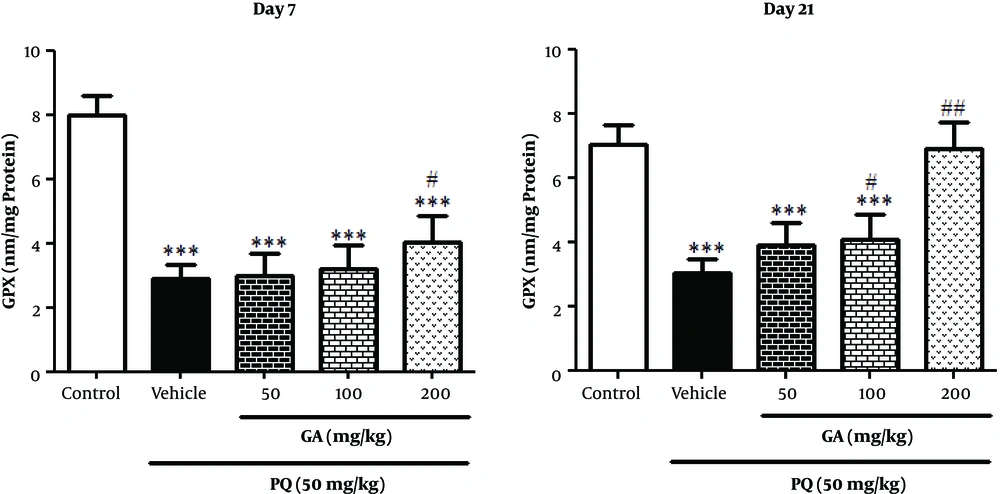
Figure 7.
Values are expressed as mean ± SD (n = 7). Data were analyzed by the one-way ANOVA test followed by the Tukey post hoc test for multiple comparisons. * Significant increase of lung index in comparison with the control group (*P < 0.05, **P < 0.01, ***P < 0.001). # Significant decrease of lung index in comparison with the PQ group (#P < 0.05, ##P < 0.01, ###P < 0.001).
3.7. Effect of GA and PQ on the Levels of TNF-α, IL-6, and TGF-β1 in Lung Tissue
Administration of PQ significantly elevated the tissue levels of TNF-α, IL-6, and TGF-β1 as compared with the control group on the days 7 and 21 (P < 0.001). Treatment of rats with GA at the doses of 100 and 200 mg/kg significantly reduced PQ-induced production of TNF-α on the days 7 and 21 (P < 0.001). Treatment of rats with GA at 3 doses of 50, 100, and 200 mg/kg significantly reduced PQ-induced production of IL-6 on days 7 and 21 (P < 0.05 and P < 0.001, respectively) (Figure 8). Treatment of rats with GA in 2 doses of 100 and 200 mg/kg significantly reduced PQ-induced production of TGF-β1 compared with that of the PQ group in a dose-dependent manner on the days 7 and 21(100 mg/kg; P < 0.01 and 200 mg/kg; P < 0.001) (Figure 8).
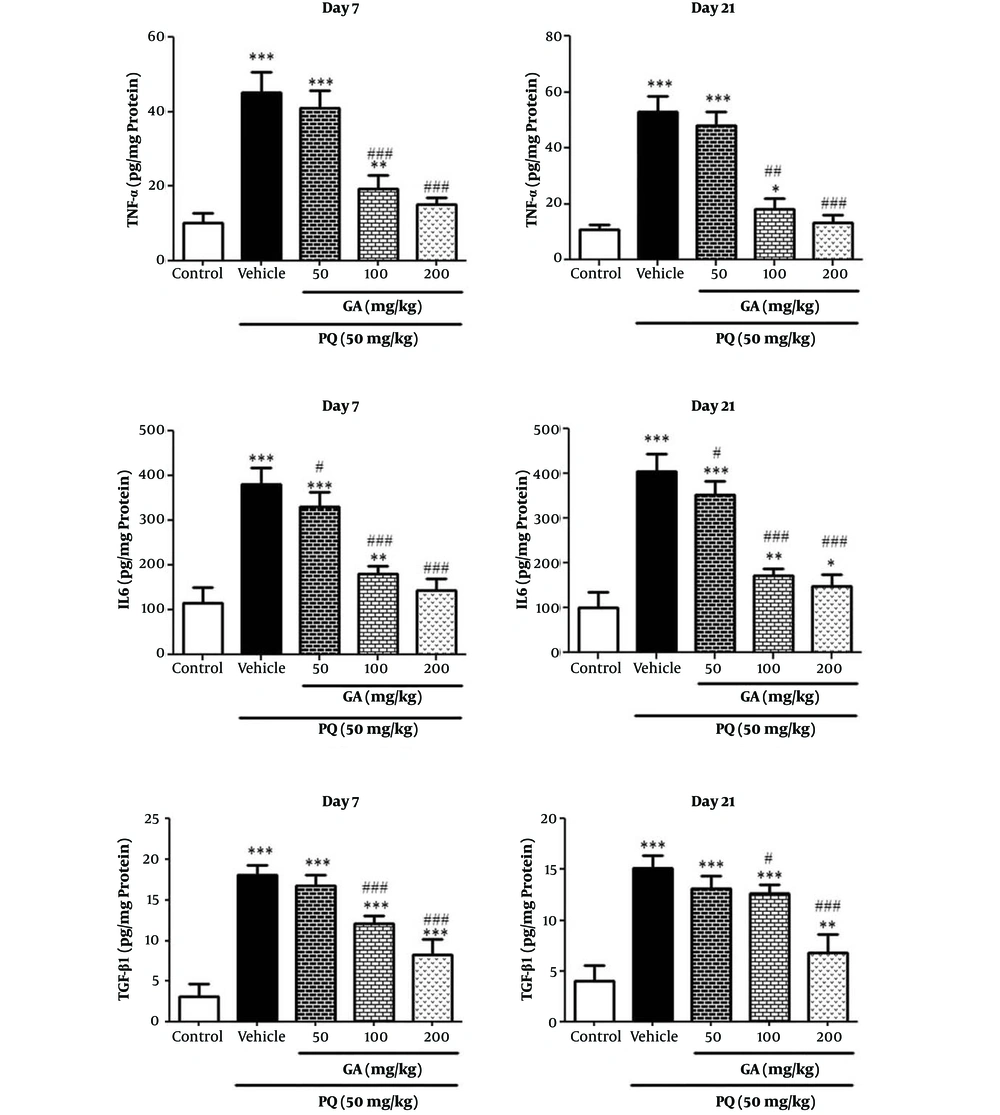
Figure 8.
Values are expressed as mean ± SD (n = 7). Data were analyzed by the one-way ANOVA test followed by the Tukey post hoc test for multiple comparisons. * Significant increase of lung index in comparison with the control group (*P < 0.05, **P < 0.01, ***P < 0.001). # Significant decrease of lung index in comparison with the PQ group (#P < 0.05, ##P < 0.01, ###P < 0.001).
3.8. The Light Microscopic Findings
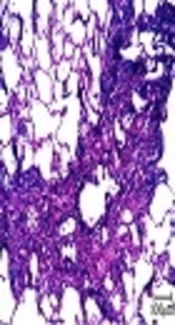
Histopathological evaluations after staining with H and E and the Masson trichrome of sections prepared from the dissected left lobe of rat lungs showed significant changes between PQ and saline groups (Figures 9 and 10, Tables 1 and 2). On the days 7 and 21, PQ showed considerable changes such as congestion of RBC and infiltration of inflammatory cells (Figure 9B1 and B2, Tables 1 and 2). PQ induced fibrosis on the day 21 via deposition of collagen fibers (Figure 10B2, Table 2). GA treatment, at the dose of 200 mg/kg, decreased congestion of RBC and inflammatory cell infiltration on the day 7, with less degree of pulmonary fibrosis (Figure 9E1, Figure 10E10E1 and Table 1). On the day 21, oral treatment with GA at the doses 100 and 200 mg/kg still showed focal inflammation in alveolar spaces and septum; however, it blocked the progression of fibrosis (Figure 10E2, Table 2).
Table 1.
Effect of GA on Lung Inflammatory and Fibrotic Scores in Rats with Pulmonary Fibrosis Induced by PQa
| Histological Criteria | Day 7 | ||||
|---|---|---|---|---|---|
| Control | PQ | PQ + 50 GA | PQ + 100 GA | PQ + 200 GA | |
| Congestion of RBC | 1.25 ± 0.44 | 3.18 ± 0.65b | 3.06 ± 0.68b | 1.87 ± 0.72c | 1.43 ± 0.51c |
| Infiltration of inflammation cells | 1 ± 0.02 | 3.57 ± 0.53b | 3.28 ± 0.75b | 3.57 ± 0.53b,c | 1.71 ± 0.48c |
| Fibrosis (the Ashcroft scale) | 0.66 ± 0.65 | 4.25 ± 1.60b,c | 4.50 ± 1.00b,c | 4.00 ± 1.12b,c | 3.25 ± 1.21b,c |
aValues are expressed as mean ± SD (n = 7). Data were analyzed by the one-way ANOVA test followed by the Tukey post hoc test for multiple comparisons.
bSignificant increase in comparison with the control group (P < 0.05).
cSignificant decrease in comparison with the PQ group (P < 0.05).
Table 2.
Effect of GA on Lung Inflammatory and Fibrotic Scores in Rats with Pulmonary Fibrosis Induced by PQa
| Histological Criteria | Day 21 | ||||
|---|---|---|---|---|---|
| Control | PQ | PQ + 50 GA | PQ + 100 GA | PQ + 200 GA | |
| Congestion of RBC | 1.12 ± 0.34 | 2.43 ± 0.62b | 2.06 ± 0.68b | 1.56 ± 0.62c | 1.31 ± 0.47c |
| Infiltration of inflammation cells | 1 ± 0 | 2.57 ± 0.95b | 2.50 ± 0.57b | 1.25 ± 0.50c | 1.501 ± 0.57c |
| Fibrosis (the Ashcroft scale) | 1.08 ± 0.66 | 5.66 ± 1.07b | 5.23 ± 0.83b | 4.00 ± 1.12b,c | 2.00 ± 0.42b,c |
aValues are expressed as mean ± SD (n = 7). Data were analyzed by the one-way ANOVA test followed by the Tukey post hoc test for multiple comparisons.
bSignificant increase in comparison with the control group (P < 0.05).
cSignificant decrease in comparison with the PQ group (P < 0.05).
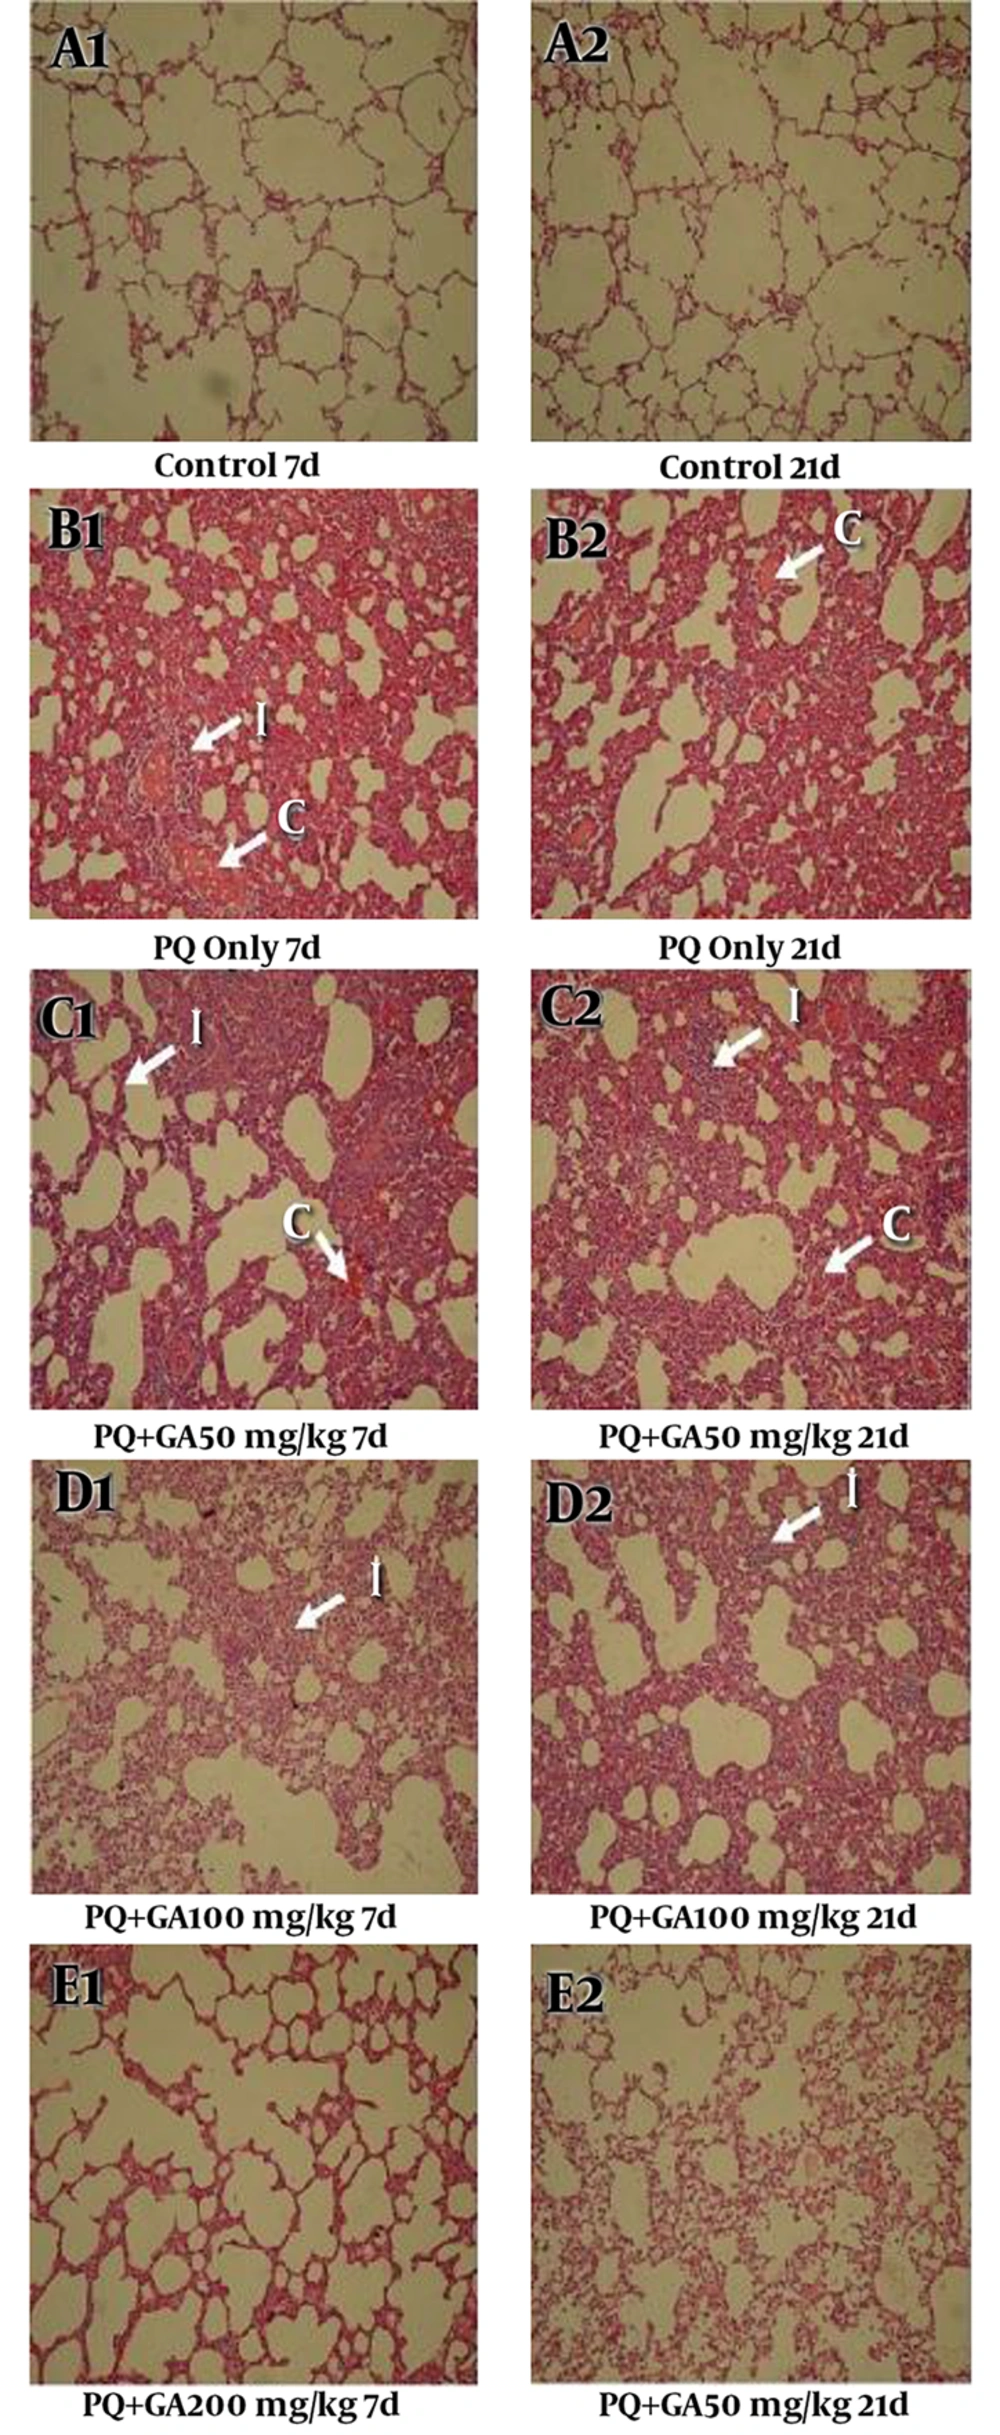
Figure 9.
The lung sections were analyzed by H and E staining (magnification × 400). Histopathological appearance of the lung sections in (A1 and A2) control, (B1 and B2) PQ, (C1 and C2) PQ + GA (50 mg/kg), (D1 and D2) PQ + GA (100 mg/kg), and (E1 and E2) PQ + GA (200 mg/kg) groups Lung parenchyma of control is well preserved and intact. Extensive congestion of RBC, interstitial infiltration and fibrosis showing in group received PQ.
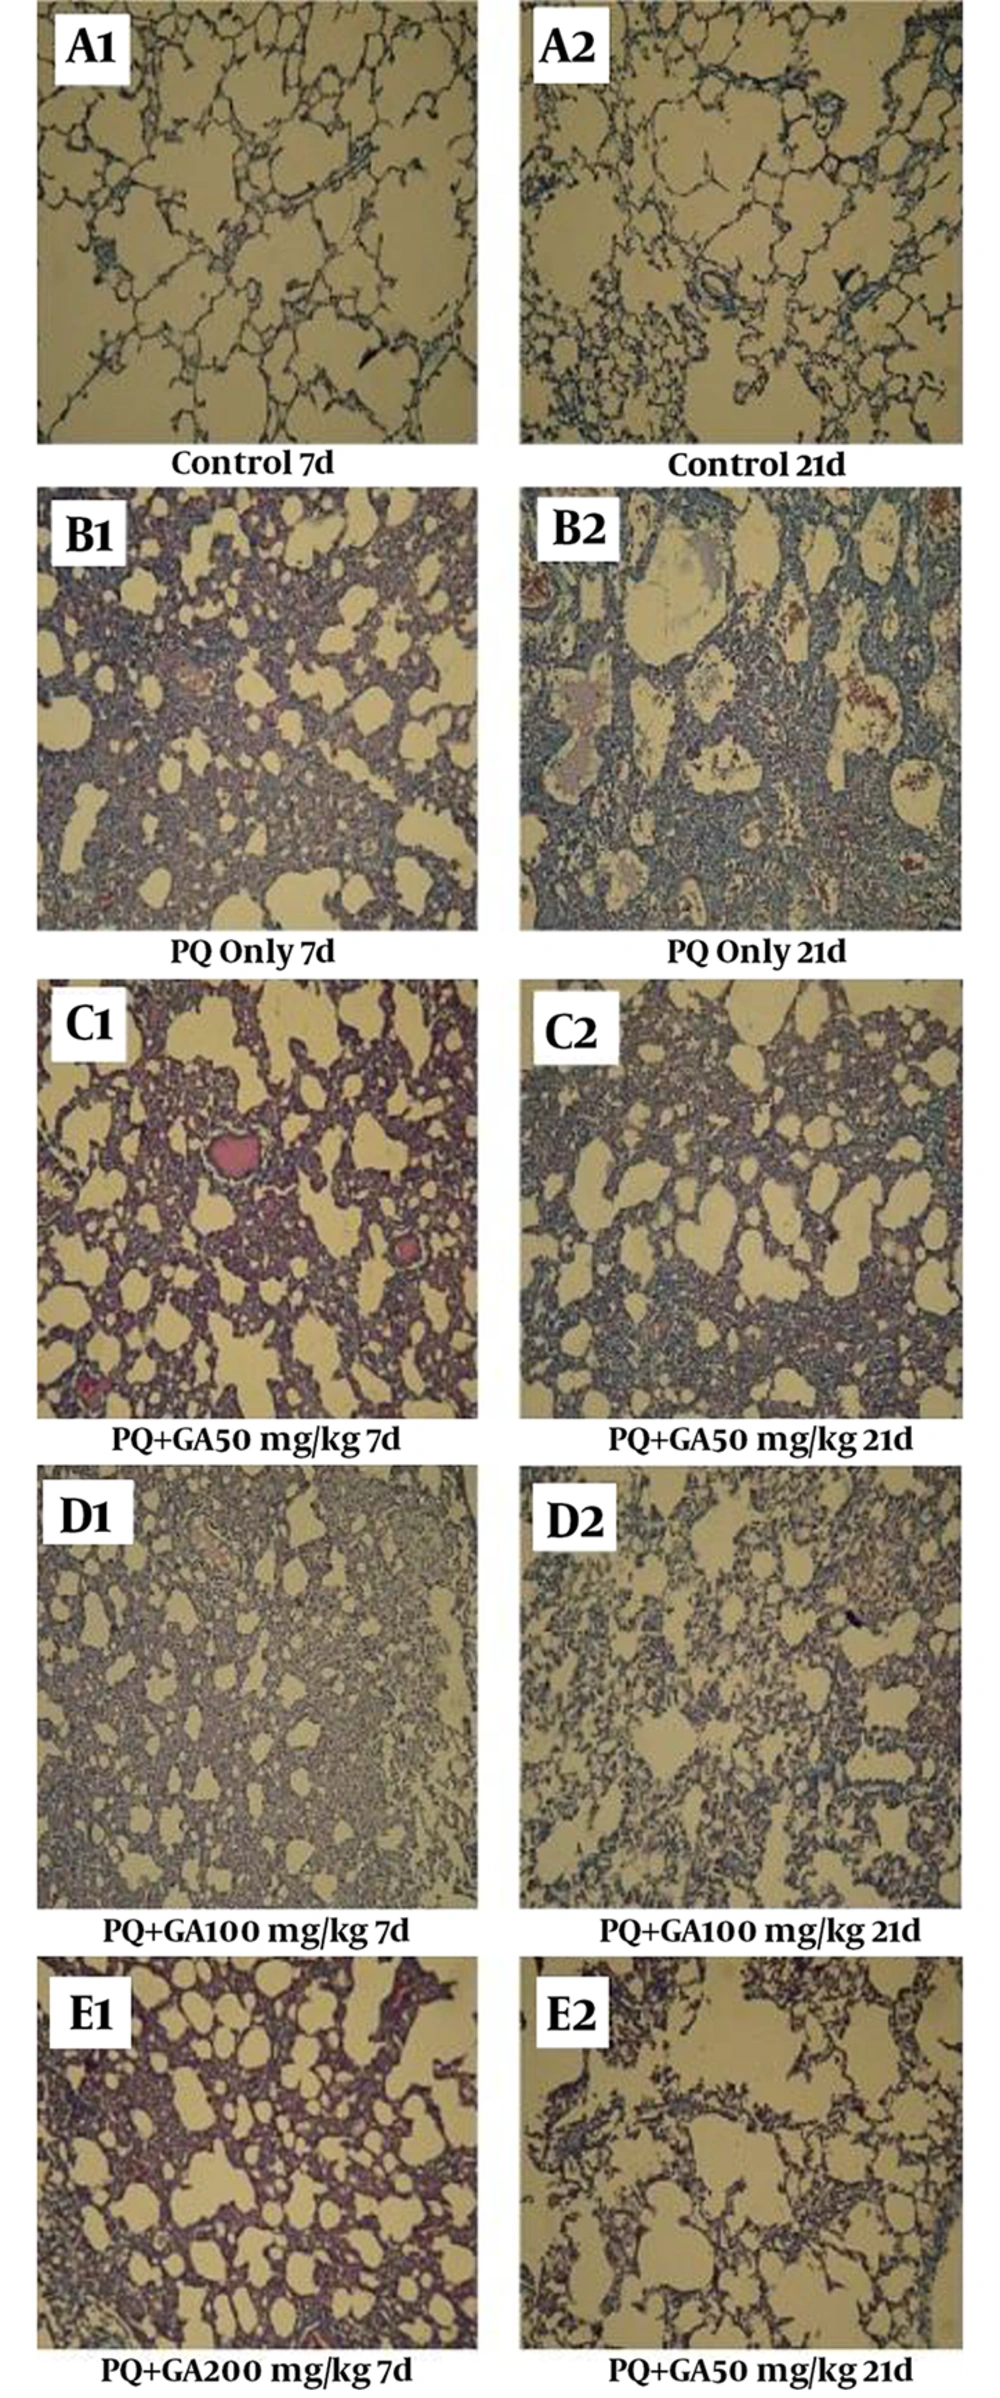
Figure 10.
The lung sections were analyzed by the Masson trichrome staining (magnification × 400). Histopathological appearance of the lung sections in (A1 and A2) control, (B1 and B2) PQ, (C1 and C2) PQ + GA (50 mg/kg), (D1 and D2) PQ + GA (100 mg/kg), and (E1 and E2) PQ + GA (200 mg/kg) groups. Control group is showing intact alveolar spaces with scant and thin connective tissue in the Masson trichrome. On the day 21, in PQ-treated group, blue-dyed collagen fibers within the alveolar walls and alveolar spaces increased, while these changes were lesser in the GA-treated group (100 and 200 mg/kg).
4. Discussion
The progression of lung damage by PQ develops in various phases. Destructive phase characterized by the generation of a pulmonary hemorrhage proteinaceous edema and infiltration of the interstitial tissue and also air spaces of the lung with inflammatory cells (24-26). Proliferative phase accompanied by the proliferation of pneumocyte and fibroblast resulting collagen deposition ensuing extensive pulmonary fibrosis and severe anoxia (27).
ROS (reactive oxygen species such as OH, O2-, RO, ROO, and NO) has a key role in triggering PQ-mediated lung injury (28). It is shown that several inflammatory and profibrogenic cytokines such as TNF-α, IL-6, and TGF-β1 play an important role in PQ-induced pulmonary fibrosis (29, 30).
Results obtained from the current study showed that all animals that received a single dose of oral PQ (50 mg/kg) presented a significant increase in MDA content as well as reduction in SOD, CAT, GPx activity, and GSH level in lung tissue on the days 7 and 21. GA administration in a dose-dependent manner could decrease the level of MDA and increase the activity of SOD and CAT and content of GSH on the days 7 and 21.
Thus, based on the current study results and previously published studies, co-administration of different doses of GA ameliorated the activity of this antioxidant enzyme and reduced the level of MDA in the normal state, might be due to phenolic nature of GA (14, 15, 31, 32). The current study results were in agreement with those of the authors` previous study reporting that GA effectively reduced MDA level production in lung of rat induced by bleomycin (15). Consistent with previous observations, the current study showed that oral administration of GA could increase the level of GSH, which was utilized to assess the non-enzymatic defense potential of the cells against the oxidative stress and enhance the activities of antioxidant enzymes such as SOD, CAT, and GPx, which implied that this compound could improve the oxidative stress response against induced pulmonary fibrosis in adult rats (15, 33).
The expressions of several inflammatory cytokines, particularly TNF-α, TGF-β1, and IL-6, which are usually typical proinflammatory mediators playing key roles in initiating inflammatory cells after acute lung injury, are involved in the pathogenesis of lung injury and pulmonary fibrosis induced by PQ (34). TNF-α, one of the initial cytokines, has a pivotal role in early inflammatory and delayed fibrotic phases of lung injury. TNF-α stimulates release of IL-6 as a proinflammatory cytokine (15). Moreover, IL-6 released from alveolar macrophages is also implicated in the pathogenesis of rat lung fibrosis (35). TGF-β1 as a vital growth factor initiates lung fibrosis. In PQ intoxication, TGF-β1 is the most potent fibrogenic cytokine and plays an essential role in the pathogenesis of pulmonary fibrosis via increased collagen gene expression and protein deposition (6, 36, 37).
Results of the current study showed that the levels of inflammatory cytokines including TNF-α, IL-6, and TGF-β1 increased in the PQ-treated rats on the days 7 and 21. Results of the current study were in agreement with those of the previous studies (29, 38, 39). The current study results on the days 7 and day 21 confirmed that GA treatment also blocked induction of TNF-α and IL-6 levels, which contributed to acute lung injury and pulmonary fibrosis. Moreover, by detecting lung TGF-β1 in different groups, on the day 21 it was found that GA treatment, in a dose dependent manner, really decreased lung TGF-β1, which plays a significant role in rats’ process of acute lung injury and pulmonary fibrosis. Results of the current study were in agreement with those of authors` previous study and other studies that showed significant anti-inflammatory and anti-fibrotic effects of GA (15, 40).
Since determination of HP concentration, transformed by praline via the action of hydroxylase in the process of collagen synthesis, may indirectly reveal collagen content, it is known as a marker of sever lung fibrosis (3). The current study results indicated that GA, in a dose dependent manner, had effective anti-fibrotic properties in PQ-induced lung fibrosis on the days 7 and 21, via decreasing the production rate of HP in the lungs of rats. Results of previous studies confirmed that GA had a potent protective effect against decrease of HP content in lung fibrosis (15).
Results of the current study were similar to the results of previous studies that showed the pathological alterations after PQ intoxication included congestion of RBC, fibroblast migration, infiltration of inflammation cells and proliferation, as well as increased collagen synthesis in lung mediating via enhancement of MDA level, aggregation of collagen, and overexpression of fibrogenic cytokines such as TGF-β1 (6, 29, 37, 39). The current study results also revealed that treatment with GA, at a dose dependent manner, remarkably attenuated PQ-induced lung injury characterized by infiltration of various inflammatory cells and congestion of RBC on the days 7 and 21.
In brief, GA, as a potent free radical scavenger with antioxidant activity, improved lung fibrosis induced by PQ. Such an effect was due to its anti-oxidative, reduction of anti-fibrotic cytokines such as TGFB1, and anti-inflammatory effects, as well as downregulating of IL-6 and TNF-a cytokines. Obstruction of several key events in PQ-induced lung fibrosis offered GA as an encouraging anti-fibrotic agent for pulmonary fibrosis. Clinical studies may also indicate that the GA ameliorates the toxic effects of PQ and treatment of pulmonary fibrosis.
4.1. Conclusion
The results of the current study revealed that oral GA can be utilized to treat lung tissues against PQ-induced oxidative stress. Future studies should be directed on the mechanism of anti-fibrotic effect of GA.