Ellagic Acid Mitigates Hepato-renal Toxicity Induced by Tacrolimus in Wistar Rats

Author(s):
Mohammad Amin BehmaneshMohammad Amin BehmaneshMohammad Amin Behmanesh ORCID1, Sima JanatiSima JanatiSima Janati ORCID2, Mohammad KhanifarMohammad Khanifar3, Fardis MasoudipourFardis Masoudipour3, Fatemeh PourmotahariFatemeh Pourmotahari4, Seyedeh Mahsa PoormoosaviSeyedeh Mahsa PoormoosaviSeyedeh Mahsa Poormoosavi ORCID5,*
1Department of Histology, School of Medicine, Dezful University of Medical Sciences, Dezful, Iran
2Department of Obstetrics and Gynecology, Research and Clinical Center for Infertility, School of Medicine, Dezful University of Medical Sciences, Dezful, Iran
3Student Research Committee, Dezful University of Medical Sciences, Dezful, Iran
4Department of Biostatistics, School of Medicine, Dezful University of Medical Sciences, Dezful, Iran
5Department of Histology, Research and Clinical Center for Infertility, School of Medicine, Dezful University of Medical Sciences, Dezful, Iran

Shiraz E-Medical Journal:Vol. 27, issue 3; e167211
Published online:Mar 31, 2026
Article type:Research Article
Received:Nov 05, 2025
Accepted:Mar 16, 2026
How to Cite:Behmanesh MA, Janati S, Khanifar M, Masoudipour F, Pourmotahari F, et al. Ellagic Acid Mitigates Hepato-renal Toxicity Induced by Tacrolimus in Wistar Rats. Shiraz E-Med J. 2026;27(3):e167211. doi: https://doi.org/10.5812/semj-167211

Abstract

Background:

Tacrolimus is commonly prescribed to prevent transplant rejection and manage autoimmune disorders; however, it can cause severe nephrotoxicity and hepatotoxicity. Previous research has highlighted the protective role of ellagic acid (EA) against tacrolimus-induced toxicity.

Objectives:

This study aimed to evaluate the protective effects of EA against tacrolimus-induced hepatorenal toxicity in Wistar rats.

Methods:

In this experimental study, 24 male Wistar rats (200 ± 20 g, 8 weeks old) were randomly assigned to four groups (n = 6 each): the control group received intraperitoneal normal saline once daily; the tacrolimus group received tacrolimus 1 mg/kg/day by intraperitoneal injection; the tacrolimus + EA group received tacrolimus plus oral EA 50 mg/kg/day; and the EA group received oral EA 50 mg/kg/day. After 28 days, serum levels of ALT, AST, ALP, BUN, and creatinine were measured, along with oxidative stress indicators, including malondialdehyde (MDA), total antioxidant capacity (TAC), thiol proteins (GSH), and 8-hydroxy-2′-deoxyguanosine (8-OHdG). Histopathological analyses of liver and kidney tissues were also performed. Group comparisons were conducted using one-way ANOVA, Welch ANOVA, or the Kruskal-Wallis test, as appropriate, followed by post hoc corrections for multiple comparisons. Statistical significance was set at P < 0.05.

Results:

Tacrolimus administration induced significant hepatorenal toxicity and oxidative stress compared with the control group, as evidenced by marked increases in serum AST (153.50 ± 13.35 vs. 83.50 ± 1.78 U/L, P = 0.006), creatinine (1.31 ± 0.04 vs. 0.42 ± 0.01 mg/dL, P = 0.002), and MDA (22.26 ± 1.05 vs. 10.30 ± 0.29 nmol/mL, P < 0.001). Co-treatment with EA significantly attenuated tacrolimus-induced oxidative stress, reducing MDA to 15.67 ± 0.73 (P = 0.001) and restoring GSH to 3.96 ± 0.31 µmol/L (P = 0.007), compared with the tacrolimus group.

Conclusions:

Ellagic acid exerts protective effects against tacrolimus-induced hepatorenal toxicity by reducing lipid peroxidation and enhancing antioxidant defenses, suggesting its potential as an adjuvant therapy for patients receiving tacrolimus.

1. Background

Tacrolimus (FK506) is an essential calcineurin inhibitor used to prevent allograft rejection and treat autoimmune disorders. Its immunosuppressive activity results from binding to FKBP and subsequent inhibition of T-cell activation pathways (1, 2). Although the nephrotoxic and hepatotoxic effects of tacrolimus are well documented, the underlying mechanisms, particularly those involving oxidative stress and mitochondrial dysfunction, remain an active area of investigation. Excessive production of reactive oxygen species (ROS) and impaired antioxidant defense systems have been implicated as key contributors to tacrolimus-induced organ injury (3, 4).
Ellagic acid (EA), a natural polyphenolic compound found in fruits and nuts, including raspberries, strawberries, and walnuts, exhibits potent antioxidant and cytoprotective properties. Experimental studies have demonstrated that EA mitigates renal and hepatic damage in various toxicological models by suppressing oxidative stress, restoring endogenous antioxidant capacity, and inhibiting inflammatory and apoptotic pathways (5, 6). However, despite these promising findings, data specifically addressing the protective effects of EA against tacrolimus-induced nephrotoxicity and hepatotoxicity remain limited.

2. Objectives

Given the widespread and increasing clinical use of immunosuppressants, and the susceptibility of the liver and kidneys to oxidative damage, there is a clear need to investigate potential adjuvant therapies to mitigate drug-induced organ toxicity. Therefore, the present study was designed to evaluate the protective effects of EA against tacrolimus-induced renal and hepatic injury, with a focus on biochemical markers of organ function and oxidative stress.

3. Methods

3.1. Ethical Considerations

The study protocol followed ethical guidelines for the use and care of laboratory animals in accordance with the institutional guidelines of Dezful University of Medical Sciences, Dezful, Iran (ethics code: IR.DUMS.REC.1400.019).

3.2. Animals

In this experimental study, 24 male Wistar rats (200 ± 20 g, 8 weeks old) were obtained from the Animal House of Dezful University of Medical Sciences, Dezful, Iran. All animals were housed in standard polycarbonate cages (6 rats per cage) under controlled laboratory conditions, including 50% - 60% relative humidity, a temperature of 25 ± 2°C, and a 12-hour light/12-hour dark cycle. Rats had free access to standard chow and tap water.

3.3. Experimental Protocol

After the acclimatization period, all rats were assigned identification numbers and randomly allocated to four experimental groups (n = 6 per group) using a computer-generated randomization sequence, as follows:
1) Control group: received normal saline intraperitoneally once daily.
2) Tacrolimus group: received tacrolimus 1 mg/kg intraperitoneally once daily for 28 days.
3) Tacrolimus + EA group: received tacrolimus 1 mg/kg intraperitoneally plus EA 50 mg/kg orally once daily for 28 days.
4) EA group: received EA 50 mg/kg orally once daily for 28 days (7).
Tacrolimus was obtained from Astellas Pharma Ltd. (Addlestone, UK), and EA powder was obtained from Sigma-Aldrich (USA).
Twenty-four hours after the final dose, rats were anesthetized with sodium thiopental (30 mg/kg, intraperitoneally). Blood samples were collected from the heart using a 2-mL syringe without anticoagulant and then centrifuged at 3000 rpm for 10 minutes to isolate serum. Serum samples were stored at -20°C until biochemical assessment.

3.4. Histopathological Assessment

Liver and renal tissues were excised, weighed, and fixed in 10% neutral buffered formalin for histopathological and histomorphometric evaluations. Sections (5 - 6 µm) were cut using a rotary microtome, stained with hematoxylin and eosin, and examined under an Olympus optical microscope (Japan). Images were captured using a Dino-Lite digital camera at 4×, 10×, and 40× magnifications from four randomly selected fields per section and analyzed using Dino-Lite software.
For each tissue sample, at least five randomly selected, non-overlapping microscopic fields were examined at 400× magnification. The histopathological score for each animal was determined based on the predominant severity observed across the examined fields. When necessary, the mean score across fields was recorded to minimize observer bias.

3.5. Functional Variables

Serum levels of the liver enzymes AST, ALT, and ALP were assessed using spectrophotometric enzymatic assays. ALT and AST activities were measured based on the formation of phenylhydrazone at λ = 546 nm using the AST Activity Assay Kit (Abcam, Cambridge, UK; Cat. No. ab105135) and Alanine Transaminase Activity Assay Kit (Abcam, Cambridge, UK; Cat. No. ab105134). ALP activity was assessed by detecting phenol release at λ = 520 nm from a phenyl phosphate substrate in the presence of potassium ferricyanide and 4-aminophenazone using the Alkaline Phosphatase Assay Kit (Abcam, Cambridge, UK; Cat. No. ab83369).
Renal function markers, including serum BUN and creatinine (Cr), were measured using colorimetric methods according to Fawcett and Scott (8) and Peters (9), respectively.

3.6. Oxidative Stress Assays

Oxidative stress biomarkers were measured as follows.
Lipid peroxidation was assessed by measuring serum MDA as an index of lipid peroxidation using the thiobarbituric acid reactive substances method (Abcam, Cambridge, UK; Cat. No. ab118970). Briefly, MDA reacts with thiobarbituric acid under acidic conditions and high temperature to form a colored complex, which was quantified spectrophotometrically (10).
Serum thiol protein (GSH) levels were determined using the method described by Cohn and Lyle (11), with absorbance read at 450 nm (Sigma-Aldrich, St. Louis, MO, USA; Cat. No. CS0260). Thiol groups react with specific chromogenic reagents to produce colored compounds, and absorbance was measured at 450 nm.
Total antioxidant capacity was determined using the ferric-reducing antioxidant power assay. In this method, antioxidants in serum reduce ferric ions (Fe3+) to ferrous ions (Fe2+), producing a blue-colored complex whose absorbance was measured spectrophotometrically (Abcam, Cambridge, UK; Cat. No. ab65329) (12).
Oxidative nucleic acid damage, including 8-OHdG, was quantified using a commercial ELISA kit (ZellX®, Berlin, Germany; Cat. No. STA-320-T) according to the manufacturer’s instructions. This assay is based on the competitive binding of oxidized nucleic acid products to specific antibodies, followed by spectrophotometric detection.

3.7. Statistical Analysis

Values are reported as mean ± standard error of the mean (SEM). The Shapiro-Wilk test was used to assess normality, and the Levene test was used to evaluate homogeneity of variances. When the assumptions of normality and homogeneity were satisfied, one-way analysis of variance (ANOVA) followed by Bonferroni post hoc testing was performed for multiple comparisons. If the assumption of homogeneity was violated, Welch ANOVA followed by the Dunnett T3 test was applied. When normality was not satisfied, the Kruskal-Wallis test was applied as a non-parametric alternative. Analyses were conducted using SPSS version 26.0, and P < 0.05 was considered statistically significant. All statistical graphs were generated using Python with the Matplotlib library.

4. Results

4.1. Effects of Ellagic Acid on Tacrolimus-Induced Changes in Body and Organ Weights

Exposure to tacrolimus caused no significant change in final body weight compared with the control group (P = 0.223). However, liver weight was significantly increased in the tacrolimus group compared with the control group (P < 0.001). Co-administration of EA with tacrolimus, as well as EA alone, did not produce significant differences in body or liver weight compared with the control group (P = 0.215). Kidney weights were not significantly affected by any treatment (Table 1).
Table 1.Effects of Tacrolimus Exposure Alone and Following EA Administration on Body and Organ Weights and Renal Function a
Groups/ParametersControlTacrolimusEllagic AcidTacrolimus + Ellagic AcidP-Value b
Weight (g)
Body248 ± 1.67254 ± 1.22249 ± 1.23250 ± 1.420.223
Liver7.65 ± 1.229.12 ± 1.8 c7.78 ± 1.61 d7.97 ± 1.43 d< 0.001
Kidney2.12 ± 1.112.33 ± 1.132.88 ± 1.452.67 ± 1.470.215
Renal function (mg/dL)
BUN19.20 ± 1.0551.83 ± 4.47 c22.80 ± 0.60 d43.47 ± 3.84 c, e< 0.001
Cr0.42 ± 0.011.31 ± 0.04 c0.38 ± 0.01 d0.93 ± 0.10 e< 0.001

a All data are expressed as mean ± SEM.

b P values are related to comparisons of factor distributions among the four groups and were calculated using one-way ANOVA, Kruskal-Wallis, or Welch tests, as appropriate.

c Significantly different from the control group.

d Significantly different from the tacrolimus group.

e Significantly different from the ellagic acid group.

4.2. Effects of Ellagic Acid on Tacrolimus-Induced Hepatic Function Biomarkers
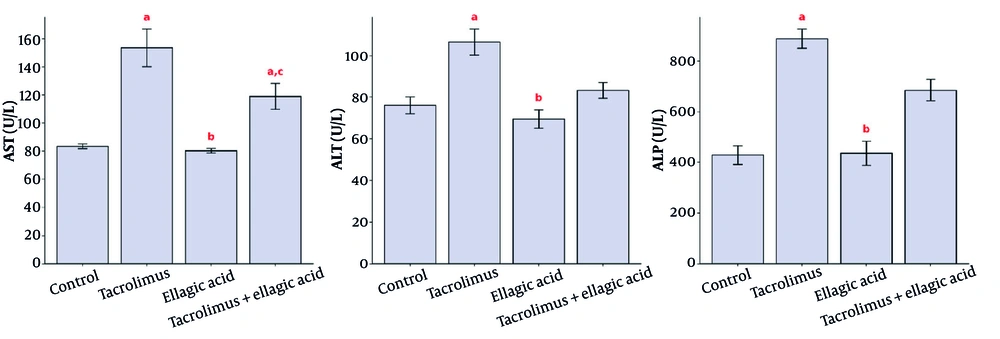
As shown in Figure 1, serum levels of ALT (P = 0.001), AST (P < 0.001), and ALP (P < 0.001) were significantly elevated in the tacrolimus group compared with the control group, indicating hepatocellular injury. Co-treatment with EA reduced these enzyme concentrations compared with the tacrolimus group; however, these decreases were not significant.
Effect of ellagic acid on tacrolimus-induced hepatic function biomarkers; A, AST; B, ALT; and C, ALP. a: Significantly different from the control group. b: Significantly different from the tacrolimus group. c: Significantly different from the ellagic acid group.
Figure 1.

Effect of ellagic acid on tacrolimus-induced hepatic function biomarkers; A, AST; B, ALT; and C, ALP. a: Significantly different from the control group. b: Significantly different from the tacrolimus group. c: Significantly different from the ellagic acid group.

4.3. Effects of Ellagic Acid on Tacrolimus-Induced Renal Function Parameters

Tacrolimus administration significantly increased BUN (P = 0.001) and Cr (P < 0.001) concentrations compared with the control group, suggesting impaired renal function. In the tacrolimus + EA group, both BUN (P = 0.649) and Cr (P = 0.992) concentrations were non-significantly lower than those in the tacrolimus group. The EA group showed values comparable to those of the control group (Table 1).

4.4. Effects of Ellagic Acid on Tacrolimus-Induced Oxidative Stress Biomarkers
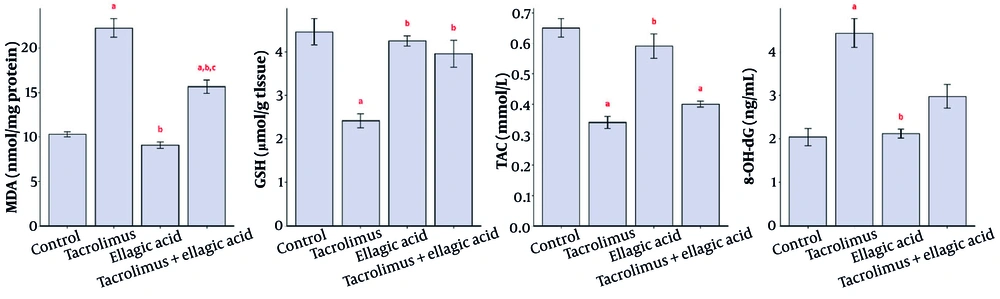
As shown in Figure 2, serum MDA concentrations markedly increased in the tacrolimus group compared with the control group (P < 0.001), indicating increased lipid peroxidation. Co-treatment with EA significantly reduced MDA concentrations compared with the tacrolimus group (P = 0.001).
Effect of ellagic acid on tacrolimus-induced oxidative stress biomarkers; A, MDA; B, GSH; C, TAC; and D, 8-OHdG. a: Significantly different from the control group. b: Significantly different from the tacrolimus group. c: Significantly different from the ellagic acid group.
Figure 2.

Effect of ellagic acid on tacrolimus-induced oxidative stress biomarkers; A, MDA; B, GSH; C, TAC; and D, 8-OHdG. a: Significantly different from the control group. b: Significantly different from the tacrolimus group. c: Significantly different from the ellagic acid group.

Tacrolimus also caused a notable reduction in total TAC (P < 0.001) and in GSH concentrations (P = 0.001). EA treatment significantly restored GSH concentrations compared with the tacrolimus group (P < 0.001). TAC concentrations in the tacrolimus + EA group were higher than those in the tacrolimus group, but the difference was not significant (P = 0.241).
8-OHdG concentrations were significantly elevated in the tacrolimus group compared with the control group (P = 0.002). Co-administration of EA decreased 8-OHdG concentrations compared with the tacrolimus group, although this reduction was not significant (P = 0.499).

4.5. Histopathological Evaluation

Histological examination of liver sections (Table 2; Figure 3A - 3F) showed normal hepatic architecture in the control group (Figure 3A). In contrast, the tacrolimus group exhibited marked pathological alterations, including hepatocyte necrosis (Figure 3B), dilated and congested central veins (Figure 3C), enlarged sinusoids, increased Kupffer cell proliferation (Figure 3D), focal mild inflammation based on the presence, distribution, and density of inflammatory cells, and lymphocytic infiltration (Figure 3E).
Table 2.Comparison of Liver and Kidney Histopathological Changes in the Studied Groups a
Histopathological ChangesControl GroupTacrolimus GroupEllagic Acid GroupTacrolimus + Ellagic Acid Group
Liver
Necrotic cells-++++-+
Sinusoid dilation-++++-++
Inflammatory cellular infiltrates-++++-+
Sinusoidal congestion-+++-+
Kidney
Tubular necrosis-+++-++
Tubular dilation-+++++++
Tubular cast-+++-+
Glomerular enlargement-++-+
Glomerular hyperemia-+++-++
Intratubular hemorrhage-+++++++

a (-) = No detectable lesion; (+) = Minimal change (< 10% of the examined field); (++) = Mild change (10% - 25%); (+++) = Moderate change (26% - 50%); (++++) = Severe change (> 50% of the examined field).

Light photomicrographs of the liver; A, control group: shows a central vein (star) with hepatocytes arranged in cords. Cords of hepatocytes enclose blood sinusoids (arrow) (H&amp;E, X400). B, tacrolimus-treated group: some hepatocytes show dark nuclei and dense acidophilic cytoplasm (arrow) (H&amp;E, X400). C, tacrolimus-treated group: dilated and congested central veins (star) (H&amp;E, X400). D, tacrolimus-treated group: dilated sinusoids with increased proliferation of Kupffer cells (arrow) (H&amp;E, X400). E, tacrolimus-treated group: shows lymphocytic infiltration and mild inflammatory areas (arrows) (H&amp;E, X400). F, tacrolimus + EA group: shows a normal central vein (star) without congestion and ameliorated cords of hepatocytes enclosing blood sinusoids (arrow) (H&amp;E, X100).
Figure 3.

Light photomicrographs of the liver; A, control group: shows a central vein (star) with hepatocytes arranged in cords. Cords of hepatocytes enclose blood sinusoids (arrow) (H&E, X400). B, tacrolimus-treated group: some hepatocytes show dark nuclei and dense acidophilic cytoplasm (arrow) (H&E, X400). C, tacrolimus-treated group: dilated and congested central veins (star) (H&E, X400). D, tacrolimus-treated group: dilated sinusoids with increased proliferation of Kupffer cells (arrow) (H&E, X400). E, tacrolimus-treated group: shows lymphocytic infiltration and mild inflammatory areas (arrows) (H&E, X400). F, tacrolimus + EA group: shows a normal central vein (star) without congestion and ameliorated cords of hepatocytes enclosing blood sinusoids (arrow) (H&E, X100).

In rats treated with EA + tacrolimus, histological alterations were significantly reduced compared with those in the tacrolimus group, with liver morphology similar to that of the EA group (Figure 3F). Liver structure in the EA group was comparable to that of the control group.
For microscopic examination of the kidney (Table 2), three sections from each rat were randomly selected, and four fields were evaluated from each section. Normal histological features were observed in the control group (Figure 4A). In the tacrolimus group, multiple pathological changes were observed, including acute tubular necrosis (Figure 4B), tubular hemorrhage, and cast formation (Figure 4C - 4E). Treatment with EA alongside tacrolimus significantly mitigated renal damage, as shown by reduced tubular necrosis, tubular dilatation, cast formation, glomerular congestion, and hemorrhage (Figure 4F). Renal architecture in the EA group was similar to that of the control group.
Light photomicrographs of the kidney; A, control group: normal renal glomeruli (star), proximal convoluted tubules (thick arrow), and distal tubules (thin arrow) (H&amp;E, X400). B, tacrolimus-treated group: some tubules with necrotic and damaged epithelial cells (arrow) (H&amp;E, X400). C, tacrolimus-treated group: hyaline casts in some tubules (arrow) (H&amp;E, X400). D and E, tacrolimus-treated group: hemorrhage in the tubules (arrow) and congestion (star) (H&amp;E, X400 and X100). F, tacrolimus + EA group: shows normal renal glomeruli and tubules without congestion or damaged cells (H&amp;E, X400).
Figure 4.

Light photomicrographs of the kidney; A, control group: normal renal glomeruli (star), proximal convoluted tubules (thick arrow), and distal tubules (thin arrow) (H&E, X400). B, tacrolimus-treated group: some tubules with necrotic and damaged epithelial cells (arrow) (H&E, X400). C, tacrolimus-treated group: hyaline casts in some tubules (arrow) (H&E, X400). D and E, tacrolimus-treated group: hemorrhage in the tubules (arrow) and congestion (star) (H&E, X400 and X100). F, tacrolimus + EA group: shows normal renal glomeruli and tubules without congestion or damaged cells (H&E, X400).

5. Discussion

This study evaluated whether EA can counteract tacrolimus-induced hepatorenal toxicity in Wistar rats. Consistent with previous reports (13-15), our results showed that tacrolimus did not alter final body weight but produced a significant increase in relative liver mass. Schulte-Hermann suggested that liver enlargement after xenobiotic exposure reflects an adaptive hypertrophic response to increased metabolic load (13), which is consistent with our findings.
Our results showed that tacrolimus caused marked elevations in serum ALT, AST, and ALP, confirming hepatocellular injury. These biochemical changes paralleled the histological evidence of hepatocyte necrosis, sinusoidal dilatation, and Kupffer cell proliferation. Elevated levels of these biomarkers indicate loss of hepatocyte membrane integrity and increased cellular leakage, suggesting that tacrolimus may act as a plasma membrane-destabilizing compound. Although EA co-administration lowered enzyme activities, the reductions did not reach statistical significance, indicating only partial biochemical protection. Nevertheless, the clear histological improvement, including near-normal lobular architecture with minimal inflammatory infiltrate, suggests that EA limits structural damage even when serum enzyme levels remain above baseline. Similar hepatoprotective effects of EA, attributed to membrane-stabilizing and free radical-scavenging properties, have been documented in other toxin models (16).
Tacrolimus induced significant elevations in BUN and Cr, accompanied by acute tubular necrosis, cast formation, and glomerular congestion, consistent with previous reports of tacrolimus-associated nephrotoxicity (17). These changes, including increased BUN and Cr levels, are likely due to podocyte foot process damage, which impairs interactions with the glomerular basement membrane and disrupts filtration. These results highlight the need for careful monitoring of renal function in patients receiving both acute and long-term tacrolimus therapy. In this study, co-treatment with EA mitigated these effects, resulting in non-significant reductions in BUN and Cr levels and attenuation of histopathological lesions, such as tubular necrosis and hemorrhage. These findings support previous evidence that polyphenols can protect against drug-induced renal injury by preserving tubular structure and glomerular integrity (18-20).
Oxidative stress is a pathogenic condition resulting from chemical interactions of free radicals that damage biological components. The literature demonstrates that oxidative stress plays an important role in some clinical conditions, including liver and kidney damage (14). Similar to the findings of Zakaria et al. (21), our study showed that oxidative stress increased in Wistar rats treated with tacrolimus. The toxic profile of tacrolimus was strongly linked to redox imbalance: MDA increased significantly, whereas total TAC and GSH decreased, and 8-OHdG increased. EA normalized MDA and GSH and partially restored TAC, underscoring its potent antioxidant action. Although the decline in 8-OHdG did not reach statistical significance, the downward trend implies reduced oxidative DNA/RNA injury, consistent with studies in which EA limited nucleic acid oxidation under diverse oxidative challenges (21-25). In addition, EA improved histological changes in the kidney and the corresponding biochemical indicators. Sepand et al. (20) showed that this improvement is related to decreased lipid peroxidation and enhanced antioxidant capacity and concluded that EA improved renal infiltration and kidney performance.
Overall, the biochemical and histopathological datasets converge on a shared mechanism: tacrolimus generates excess ROS that overwhelm endogenous defenses, whereas EA, acting as a direct radical scavenger and GSH-sparing agent, re-establishes redox homeostasis. The incomplete normalization of some parameters, including ALT, AST, ALP, BUN, creatinine, TAC, and 8-OHdG, suggests that higher EA doses, prolonged exposure, or combination with additional antioxidants may be required for full protection.

5.1. Limitations and Future Directions

Our sample size permitted robust detection of large effect sizes but may have lacked sufficient power to confirm modest differences in some endpoints. We examined only one EA dose and a single time point; therefore, dose-response and time-course studies, as well as mechanistic work on signaling pathways, such as Nrf2 and NF-κB, are warranted. Translational studies should further explore pharmacokinetic interactions between EA and tacrolimus in transplant recipients.

5.2. Conclusions

Our findings indicate that EA confers meaningful, although incomplete, protection against tacrolimus-induced hepatorenal toxicity, principally by curbing lipid peroxidation and strengthening antioxidant defenses. Given its efficacy, safety, and natural abundance, EA may be a promising adjuvant for safeguarding vital organs in patients requiring tacrolimus therapy. Future research should delineate the molecular pathways underlying this protection and determine optimal dosing strategies to maximize clinical benefit.

Acknowledgments

Footnotes

References

  • 1.
    Terzi F, Ciftci MK. Protective effect of silymarin on Tacrolimus-induced kidney and liver toxicity. BMC Complement Med Ther. 2022;22(1). 331. [PubMed ID: 36514062]. [PubMed Central ID: PMC9746137]. https://doi.org/10.1186/s12906-022-03803-x.
  • 2.
    Koc S, Aktas A, Sahin B, Ozer H, Zararsiz GE. Protective effect of ursodeoxycholic acid and resveratrol against Tacrolimus-induced hepatotoxicity. Biotech Histochem. 2023;98(7):471-478. [PubMed ID: 37381715]. https://doi.org/10.1080/10520295.2023.2228697.
  • 3.
    Ong SC, Gaston RS. Thirty years of Tacrolimus in clinical practice. Transplantation. 2021;105(3):484-495. [PubMed ID: 32541562]. https://doi.org/10.1097/TP.0000000000003350.
  • 4.
    Munteanu IG, Apetrei C. Analytical methods used in determining antioxidant activity: A review. Int J Mol Sci. 2021;22(7):3380. [PubMed ID: 33806141]. [PubMed Central ID: PMC8037236]. https://doi.org/10.3390/ijms22073380.
  • 5.
    Bentata Y. Tacrolimus: 20 years of use in adult kidney transplantation. What we should know about its nephrotoxicity. Artif Organs. 2020;44(2):140-152. [PubMed ID: 31386765]. https://doi.org/10.1111/aor.13551.
  • 6.
    Fatima N, Sheikh N, Satoskar AR, Akhtar T, Tayyeb A, Ashfaq I, et al. Effect of short-term Tacrolimus exposure on rat liver: an insight into serum antioxidant status, liver lipid peroxidation, and inflammation. Mediators Inflamm. 2021;2021(1). 6613786. [PubMed ID: 33679236]. [PubMed Central ID: PMC7929660]. https://doi.org/10.1155/2021/6613786.
  • 7.
    Pari L, Sivasankari R. Effect of ellagic acid on cyclosporine A-induced oxidative damage in the liver of rats. Fundam Clin Pharmacol. 2008;22(4):395-401. [PubMed ID: 18705750]. https://doi.org/10.1111/j.1472-8206.2008.00609.x.
  • 8.
    Fawcett JK, Scott JE. A rapid and precise method for the determination of urea. J Clin Pathol. 1960;13(2):156-159. [PubMed ID: 13821779]. [PubMed Central ID: PMC480024]. https://doi.org/10.1136/jcp.13.2.156.
  • 9.
    Peters JH. The determination of creatinine and creatine in blood and urine with the photoelectric colorimeter. J Biol Chem. 1942;146(1):179-186. https://doi.org/10.1016/S0021-9258(18)72463-0.
  • 10.
    Senthilkumar M, Amaresan N, Sankaranarayanan A. Estimation of Malondialdehyde (MDA) by Thiobarbituric Acid (TBA) Assay. In: Plant-Microbe Interactions. Springer Protocols Handbooks. Humana, New York. 2021;NY:103-105. https://doi.org/10.1007/978-1-0716-1080-0_25.
  • 11.
    Cohn VH, Lyle J. A fluorometric assay for glutathione. Anal Biochem. 1966;14(3):434-440. [PubMed ID: 5944947]. https://doi.org/10.1016/0003-2697(66)90286-7.
  • 12.
    Benzie IFF, Strain JJ. The ferric reducing ability of plasma (FRAP) as a measure of "antioxidant power": the FRAP assay. Anal Biochem. 1996;239(1):70-76. [PubMed ID: 8660627]. https://doi.org/10.1006/abio.1996.0292.
  • 13.
    Schulte-Hermann R. Adaptive Liver Growth Induced by Xenobiotic Compounds: Its Nature and Mechanism. Archives of Toxicology. 1978;(2):113-124. [PubMed ID: 380520]. https://doi.org/10.1007/978-3-642-67265-1_9.
  • 14.
    Poormoosavi SM, Behmanesh MA, Abeyat H, Sangtarash E. Evaluation of the effect of captopril and losartan on Tacrolimus-induced nephrotoxicity in rats. Drug Res. 2021;71(5):243-249. [PubMed ID: 33711846]. https://doi.org/10.1055/a-1369-8651.
  • 15.
    Xie D, Guo J, Dang R, Li Y, Si Q, Han W, et al. The effect of Tacrolimus-induced toxicity on metabolic profiling in target tissues of mice. BMC Pharmacol Toxicol. 2022;23(1). 87. [PubMed ID: 36443830]. [PubMed Central ID: PMC9703746]. https://doi.org/10.1186/s40360-022-00626-x.
  • 16.
    Goyal Y, Koul A, Ranawat P. Ellagic acid ameliorates cisplatin-induced hepatotoxicity in colon carcinogenesis. Environ Toxicol. 2019;34(7):804-813. [PubMed ID: 30953405]. https://doi.org/10.1002/tox.22747.
  • 17.
    Al-Harbi NO, Imam F, Al-Harbi MM, Iqbal M, Nadeem A, Al-Shahrah OA, et al. Treatment with aliskiren ameliorates Tacrolimus-induced nephrotoxicity in rats. J Renin Angiotensin Aldosterone Syst. 2015;16(4):1329-1336. [PubMed ID: 24737642]. https://doi.org/10.1177/1470320314530178.
  • 18.
    Ateşşahín A, Çeríbaşi AO, Yuce A, Bulmus Ö, Çikim G. Role of ellagic acid against cisplatin-induced nephrotoxicity and oxidative stress in rats. Basic Clin Pharmacol Toxicol. 2007;100(2):121-126. [PubMed ID: 17244261]. https://doi.org/10.1111/j.1742-7843.2006.00015.x.
  • 19.
    Altındağ F, Özdek U. Synergistic effects of sinapic acid and ellagic acid ameliorate streptozotocin-induced diabetic nephropathy by inhibiting apoptosis, DNA damage, and structural deterioration in rats. Hum Exp Toxicol. 2021;40(12_suppl):S290-S299. [PubMed ID: 34661493]. https://doi.org/10.1177/09603271211040825.
  • 20.
    Sepand MR, Ghahremani MH, Razavi-Azarkhiavi K, Aghsami M, Rajabi J, Keshavarz-Bahaghighat H, et al. Ellagic acid confers protection against gentamicin-induced oxidative damage, mitochondrial dysfunction, and apoptosis-related nephrotoxicity. J Pharm Pharmacol. 2016;68(9):1222-1232. [PubMed ID: 27364420]. https://doi.org/10.1111/jphp.12589.
  • 21.
    Zakaria AE, Marwa AA, Manal RAEH, Reda AAH, Hebatallah HA. Spirulina protects against Tacrolimus-induced hepatic and renal toxicity in rats: A biochemical and histological study. J Toxicol Environ Health Sci. 2016;8(7):46-56. https://doi.org/10.5897/JTEHS2016.0363.
  • 22.
    Behmanesh MA, Janati S, Ghorbanzadeh B, Baniasadian A, Poormoosavi SM. Cysteamine mitigates the deleterious impact of cryopreservation on sperm parameters. Nephro-Urol Mon. 2023;15(3). https://doi.org/10.5812/numonthly-138581.
  • 23.
    Valavanidis A, Vlachogianni T, Fiotakis C. 8-hydroxy-2′-deoxyguanosine (8-OHdG): a critical biomarker of oxidative stress and carcinogenesis. J Environ Sci Health C. 2009;27(2):120-139. [PubMed ID: 19412858]. https://doi.org/10.1080/10590500902885684.
  • 24.
    Karimi Z, Daryabor G, Masjedi F. Effects of conditioned media derived from human Wharton's jelly mesenchymal stem cells on diabetic nephropathy and hepatopathy via modulating TGF-β and apelin signaling pathways in male rats. BMC Endocr Disord. 2024;24(1). 6. [PubMed ID: 38178017]. [PubMed Central ID: PMC10768285]. https://doi.org/10.1186/s12902-023-01535-8.
  • 25.
    Wang Q, Zhang X, Xi L. Ellagic acid ameliorates diabetic cardiomyopathy by inhibiting ferroptosis through the modulation of the SIRT1/p53 pathway in streptozotocin-induced diabetic rats. Iran J Pharm Res. 2025;24(1). e166600. [PubMed ID: 41477127]. [PubMed Central ID: PMC12749205]. https://doi.org/10.5812/ijpr-166600.

Crossmark
Crossmark
Checking
Share on
Cited by
Metrics

Ordering Reprints

Articles are published under the Creative Commons license stated on each article. No permission or royalty fee is required for uses permitted by that license. CCC handles optional bulk and customized reprint orders. Any quotation covers production and delivery services only, not copyright permission. > Request Reprints from CCC 

Search Relations

Author(s):

Related Articles