
1. Background
Non-steroidal anti-inflammatory drugs (NSAIDs) are widely used in human and veterinary medicine due to their analgesic, anti-inflammatory, and antipyretic properties. Among them, diclofenac (DIC) is one of the most commonly prescribed agents (1). However, prolonged DIC administration is frequently associated with hepatotoxicity and nephrotoxicity, which significantly limit its therapeutic applications. Reports from both clinical and experimental studies have documented the prevalence of DIC-induced liver injury, emphasizing the need for effective protective interventions (2). Diclofenac-induced hepatotoxicity is primarily attributed to mitochondrial dysfunction, immune dysregulation, and excessive generation of reactive oxygen species (ROS), which collectively drive oxidative stress and lipid peroxidation while impairing endogenous antioxidant defenses (2, 3). Early hepatic injury is further aggravated by upregulation of pro-inflammatory cytokines such as TNF-α and IL-1β, promoting inflammatory amplification and cellular damage (4). Recent evidence indicates that these pathological processes extend beyond simple oxidative imbalance, involving intricate networks of cytokine signaling and transcriptional responses that determine hepatocellular resilience or susceptibility to drug-induced injury.
In this context, recent studies have underscored the pivotal role of the KEAP1/NRF2/ARE antioxidant pathway as a master regulator of cellular defense against xenobiotic-induced oxidative stress. Dai et al. demonstrated that ROS overproduction disrupts KEAP1-NRF2 homeostasis, impairing NRF2 activation and reducing the expression of detoxifying enzymes such as HO-1, NQO1, catalase (CAT), superoxide dismutase (SOD), and glutathione peroxidase (GPx). Their findings highlight that pharmacologic activation of NRF2 markedly enhances hepatocellular resistance to oxidative damage (5). Similarly, Wu et al. showed that suppression of NRF2 leads to mitochondrial dysfunction, lipid peroxidation, and heightened vulnerability to drug-induced liver injury, while reactivation of the KEAP1/NRF2/ARE axis by natural compounds restores redox balance and improves hepatoprotection (6).
Concurrently, cytokine-mediated inflammatory signaling has emerged as another critical determinant of liver injury. Wang et al. reported that dysregulated cytokine networks, particularly involving IL-15 and other innate immune mediators, substantially contribute to hepatic dysfunction in inflammatory liver diseases, underscoring the importance of targeting cytokine cascades alongside oxidative stress (7). Building on this concept, Li et al. demonstrated that phytochemicals can simultaneously suppress pro-inflammatory cytokines (TNF-α, IL-1β, IL-6) and modulate key pathways such as NF-κB, MAPK, and NRF2, thereby reducing hepatocellular apoptosis and improving mitochondrial integrity (8). More recently, Wang et al. confirmed that herbal-derived compounds enhance mitochondrial bioenergetics, limit ROS overproduction, and strongly activate NRF2/ARE-dependent antioxidant responses, offering a mechanistic framework that aligns closely with modern phytochemical-based hepatoprotection (9).
Considering this mechanistic background, compounds with dual antioxidant and anti-inflammatory activities represent promising candidates for counteracting DIC-induced hepatotoxicity. Chlorogenic acid (CGA), a natural polyphenol abundant in coffee, fruits, and vegetables, is one of the most notable of these compounds and exhibits strong free-radical scavenging capacity as well as modulation of inflammatory signaling pathways (10, 11). Studies have shown that CGA enhances antioxidant defense by increasing the activity of enzymes such as SOD, CAT, and GPx while reducing malondialdehyde (MDA), thereby effectively restoring redox balance (10, 12, 13). In addition, CGA attenuates inflammation by suppressing pro-inflammatory cytokines including TNF-α and IL-1β and by regulating the NF-κB pathway (11, 13). Moreover, CGA activates the KEAP1/NRF2/ARE axis and strengthens cellular defense mechanisms, thereby improving hepatocellular resistance to oxidative stress (5, 14, 15). More recent evidence also indicates that CGA improves mitochondrial function, reduces ROS generation, and helps maintain cellular integrity under toxic conditions (16, 17).
Given the high prevalence of DIC use in Iran, accounting for 49.2% of all NSAID prescriptions in northeastern regions and representing 12.8% of total NSAID consumption nationwide (18, 19), investigating hepatoprotective strategies against DIC-induced liver toxicity is particularly relevant. Considering the central roles of oxidative stress, cytokine dysregulation, and the antioxidant KEAP1/NRF2/ARE axis in DIC-induced hepatotoxicity, evaluating the protective potential of CGA may provide valuable insights for developing new therapeutic approaches to manage NSAID-related liver injury.
2. Objectives
This study was designed to assess the effects of CGA against DIC-induced hepatotoxicity, focusing on antioxidant and anti-inflammatory mechanisms.
3. Methods
3.1. Animals
This experimental study was conducted at the Islamic Azad University, Shahrekord Branch. Forty-two BALB/C mice (6 - 8 weeks old, weighing 30 ± 5 g) were procured from the Royan Biotechnology Research Institute. Animals were housed under standard conditions [12-hour light/dark cycle, ad libitum access to food and water, temperature (20 - 25°C)] for 7 days before experimentation (20).
3.2. Experimental Design and Procedures
The mice were randomly assigned into seven groups, each containing six animals: (1) Control group: Received 0.1 mL distilled water (IM); (2) CGA group: Treated with CGA (50 mg/kg, IP) dissolved in propylene glycol; (3) DIC group: Administered DIC (50 mg/kg, IM) to induce hepatotoxicity; (4) PPG-DIC group: Received propylene glycol (0.1 mL, IP), followed by DIC (50 mg/kg, IM) after 2 hours; (5) CGA-DIC group (therapeutic regimen): Received CGA (50 mg/kg, IP), followed by DIC (50 mg/kg, IM) 2 hours later, daily; (6) VITE-DIC group: Administered vitamin E (100 mg/kg, IM), followed by DIC (50 mg/kg, IM) after 2 hours, daily; (7) CGA-DIC (P) group (preventive regimen): Treated with CGA (50 mg/kg, IP) daily for 7 consecutive days; on the final day, DIC (100 mg/kg, IM) was administered.
3.3. Sampling
All treatments were administered daily for 7 days. On the 7th day, food was withheld, and on the 8th day, blood samples were collected via cardiac puncture under deep anesthesia by ketamine 90 mg/kg - xylazine 4 mg/kg (20). The serum was separated for liver biochemical analysis.
The abdominal cavity was opened, and the liver was carefully excised. A portion of the liver tissue was used for gene expression analysis of inflammatory markers (IL-1β, TNF-α) using RT-PCR, and another portion was stored at -80°C for oxidative stress marker assessment (CAT, SOD, GPx, and MDA). For histopathological evaluation, a section of liver tissue was fixed in 10% formalin.
3.4. RT-PCR Techniques
The expression of TNF-α and IL-1β genes in tissue was evaluated using real-time PCR. After homogenization of 100 mg of liver tissue, total RNA was extracted using the BIOZOL kit (Bioer, China) and analyzed using agarose gel electrophoresis. Then, the amount was determined by a NanoDrop spectrophotometer (Thermo, USA). DNase I enzyme (Sina Gene, Iran) was used to remove possible DNA in the extracted RNA sample. After cDNA formation using specific primers, the expression of the target genes was measured by real-time PCR. The primers were designed to cover exon-exon junctions, and GAPDH was used as a reference gene (Geniran, Iran). The primers used are shown in Table 1. RT-qPCR consisted of 45 cycles (denaturation at 95°C for 15 s, primer annealing at 60°C for 20 s, and extension at 72°C for 25 s). Relative expression levels were calculated using the 2-ΔΔCT method (21).
Table 1.
Primers Used in RT- PCR (22)
| Genes | Primer Sequence |
|---|---|
| TNF-α | Forward: 5′-CTGGCGTGTTCATCCGTTC-3′; reverse: 5′-GGCTCTGAGGAGTAGACGATAA-3′ |
| IL-1β | Forward: 5′-CAACAAAAATGCCTCGTGCTG-3′; reverse: 5′-TCGTTGCTTGTCTCTCCTTGTA-3′ |
| GAPDH | Forward: 5′-TTGGCTACAGCAACAGG-3′; reverse: 5′-GGGGAGATTCAGTGTGG-3′ |
3.5. Measurement of Oxidative Stress Parameters
Homogenized liver tissue samples were analyzed to determine oxidative stress and antioxidant status. Oxidative stress parameters, CAT, SOD, GPx, and MDA, were measured using commercial kits (Kiazist, Iran) through colorimetric methods in liver tissue (21).
3.6. Liver Enzyme Activity Measurement
Activities of enzymes alanine aminotransferase (ALT), aspartate aminotransferase (AST), alkaline phosphatase (ALP), and gamma-glutamyl transferase (GGT), along with total bilirubin (T.Bil), were quantified by the use of appropriate biochemical kits purchased from PARS Azmoon (Iran) and using an autoanalyzer (Tokyo Boeki, Japan) (21).
3.7. Histopathological Studies
For histopathological evaluation, liver tissue samples were fixed in 10% neutral buffered formalin immediately after dissection. The fixed tissues were dehydrated through graded alcohol series, cleared with xylene, and embedded in paraffin. Thin sections (4 - 5 µm) were cut using a microtome and mounted on glass slides. The sections were stained with hematoxylin and eosin (H&E) for general structural assessment. Slides were examined under a light microscope to identify histological alterations, including inflammation, hepatocyte degeneration, necrosis, and other pathological features. Images were captured for documentation and further analysis.
This study expands on our previous work (22), which assessed only IL-1β, TNF-α, and CAT/SOD activities. In the present, more comprehensive study, employing different measurement methods from the previous work, additional oxidative stress markers (MDA, GPx), liver enzymes (ALT, AST, ALP, GGT), total bilirubin, and histopathological changes were evaluated to provide a broader assessment of CGA’s hepatoprotective effects.
3.8. Statistical Analysis
The collected data were analyzed using SPSS version 25. Analysis of variance (ANOVA) and Tukey's post-hoc test were applied to examine the results. A 95% confidence level was considered statistically significant (P < 0.05).
4. Results
4.1. Tumor Necrosis Factor-Alpha Gene Expression
The highest expression level of the TNF-α gene was observed in the group treated with DIC. Co-administration of CGA with DIC significantly reduced the expression of this pro-inflammatory gene. However, CGA alone, while causing a reduction in TNF-α gene expression, did not result in a significant difference compared to the control group. In the group treated with DIC + vitamin E, a significant decrease in TNF-α gene expression was noted compared to the DIC-only group. Additionally, the expression level of TNF-α in the PPG + DIC group showed no significant difference from the DIC-only group, indicating that the solvent of CGA did not influence the experimental results. In the preventive group, where CGA was administered before DIC (100 mg/kg on the final day of the experiment), the reduction in TNF-α gene expression was similar to the vitamin E-treated group and significantly lower than the group treated with CGA + DIC (Figure 1).
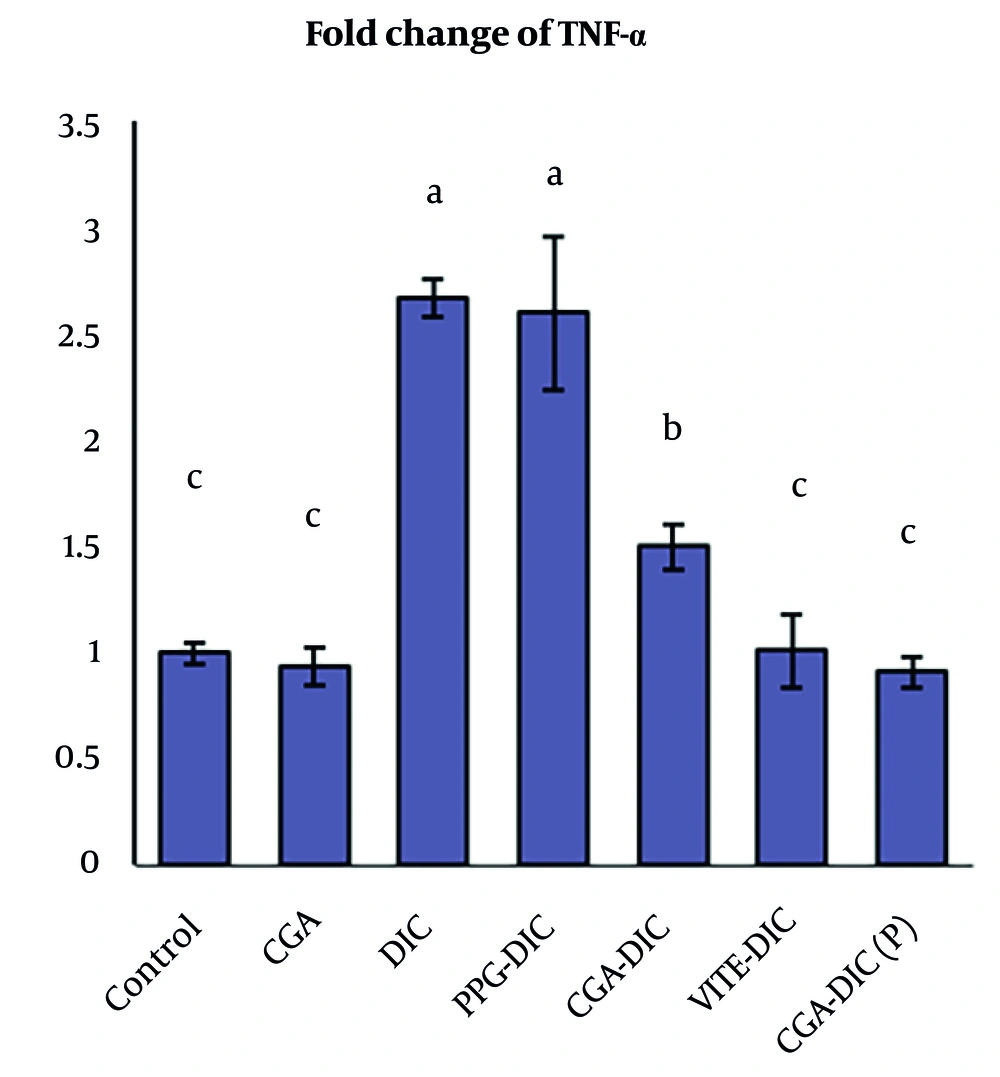
Figure 1.
Comparison of tumor necrosis factor (TNF-α) gene expression across different treatments. Results are expressed as mean ± SD. Different letters indicate statistically significant differences (P < 0.05).
4.2. Interleukin-1 Beta Gene Expression
As shown in Figure 2, DIC significantly increased IL-1β gene expression compared to the control group. Adding PPG to DIC did not significantly affect the expression of this gene compared to DIC alone. Treatment with DIC + CGA significantly reduced the expression of the IL-1β gene compared to the DIC (positive control) group. The expression levels of IL-1β in the vitamin E-treated group and the preventive group were similar and significantly reduced compared to the DIC-only group.
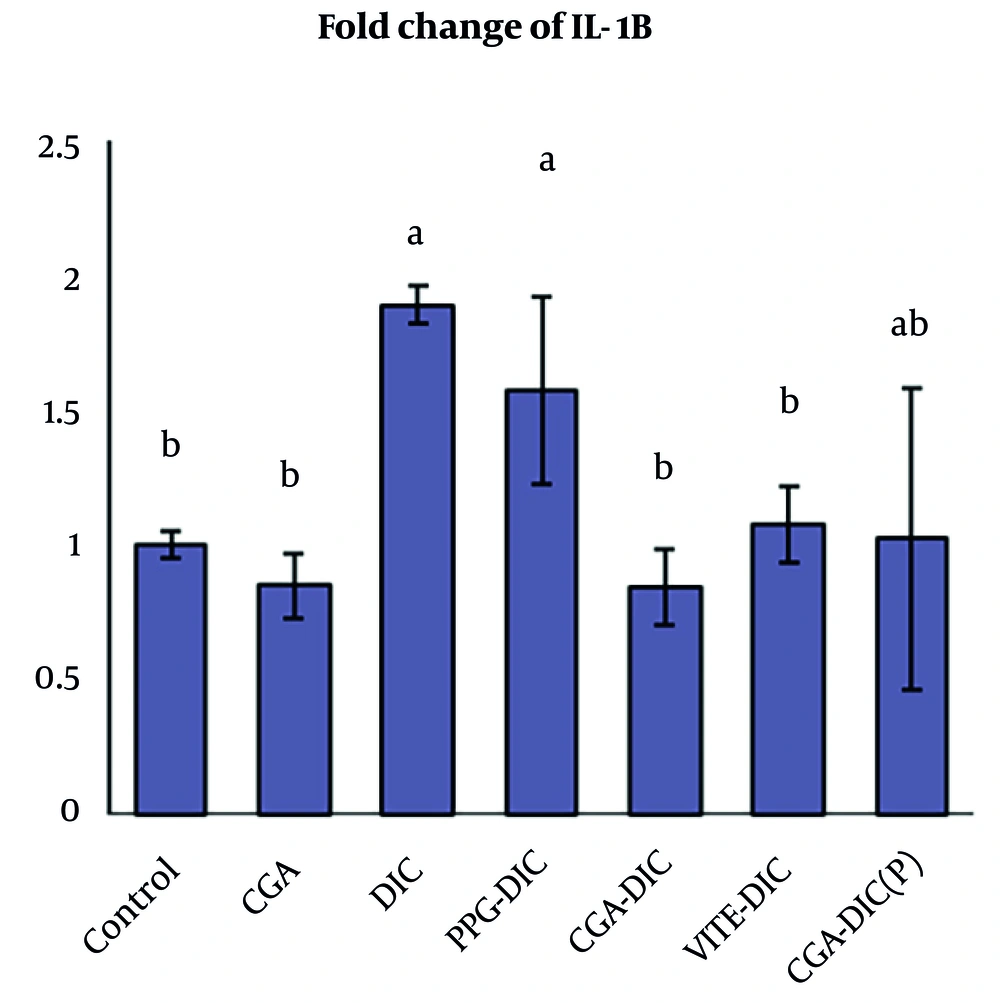
Figure 2.
Comparison of interleukin-1 beta (IL-1β) gene expression across different treatments. Results are expressed as mean ± SD. Different letters indicate statistically significant differences (P < 0.05).
Figure 2. Comparison of IL-1β gene expression across different treatments. Results are expressed as mean ± SD. Different letters indicate statistically significant differences (P < 0.05).
4.3. Oxidative Stress Results
Administration of DIC significantly increased MDA levels and decreased the activities of antioxidant enzymes, including CAT, SOD, and GPx, compared to the control group. Administration of CGA alone did not cause any significant changes in oxidative stress parameters. In the group receiving propylene glycol in combination with DIC, used as the solvent for CGA, no significant differences were observed compared to the DIC group.
Chlorogenic acid exhibited protective effects similar to those of vitamin E in both preventive and therapeutic regimens. All three interventions improved DIC-induced oxidative stress markers except for SOD, which did not show a significant improvement in any of the treatments compared to the DIC group. In all treated groups, MDA levels returned to control values, whereas the activities of CAT and GPx showed only partial improvement and remained lower than those of the control group (Table 2).
| Variables | MDA (µmol/mgpro) | CAT (IU/mgpro) | SOD (IU/mgpro) | GPx (nmol/mgpro) |
|---|---|---|---|---|
| Control | 23.75 ± 2.75 A | 7.65 ± 1.40 C | 8.18 ± 0.72 A | 328.50 ± 35.42 C |
| CGA | 23.50 ± 5.80 A | 7.28 ± 2.11 C | 7.51 ± 0.48 A | 339.50 ± 44.01 C |
| DIC | 59.00 ± 6.32 B | 1.12 ± 0.65 A | 1.38 ± 0.36 B | 141.50 ± 25.85 A |
| PPG-DIC | 55.25 ± 6.39 B | 1.37 ± 0.42 A | 1.22 ± 0.29 B | 156.00 ± 34.02 A |
| CGA-DIC | 30.75 ± 5.85 A | 3.32 ± 0.42 B | 1.61 ± 0.43 B | 234.50 ± 18.26 B |
| VITE-DIC | 35.50 ± 6.19 A | 3.65 ± 0.71 B | 1.15 ± 0.14 B | 221.00 ± 15.70 B |
| CGA-DIC(P) | 34.50 ± 5.97 A | 3.42 ± 0.51 B | 1.69 ± 0.33 B | 214.75 ± 13.07 B |
Abbreviations: CGA, chlorogenic acid; DIC, diclofenac; PPG, propylene glycol, VITE, vitamin E; MDA, malondialdehyde; CAT, catalase; SOD, superoxide dismutase; GPx, glutathione peroxidase.
a Values are expressed as mean ± SD.
b The presence of different capital letters indicates a significant difference between groups (P < 0.05).
4.4. Liver Enzyme Results
Administration of DIC significantly increased the levels of liver enzymes ALT, AST, ALP, and GGT, as well as total bilirubin, compared to the control group. Administration of CGA alone did not induce any significant changes in these parameters compared to the control. In addition, propylene glycol, used as the solvent for CGA, in combination with DIC showed no significant differences compared to the DIC group.
Chlorogenic acid, in both preventive and therapeutic regimens, and vitamin E significantly reduced liver enzymes and total bilirubin compared to the DIC group. The reduction in AST and GGT reached control levels, whereas ALT, ALP, and total bilirubin decreased but remained above control values. The effects of CGA in both regimens were comparable to those of vitamin E (Table 3).
| Variables | ALT (IU/L) | AST (IU/L) | ALP (IU/L) | GGT (IU/L) | T.Bil (mg/dL) |
|---|---|---|---|---|---|
| Control | 30.25 ± 2.49 A | 54.25 ± 8.46 A | 41.75 ± 1.65 A | 2.10 ± 0.08 A | 0.54 ± 0.02 A |
| CGA | 28.50 ± 3.12 A | 58.00 ± 4.30 A | 40.50 ± 1.55 A | 2.26 ± 0.10 A | 0.57 ± 0.02 A |
| DIC | 82.75 ± 3.22 C | 134.75 ± 3.03 B | 87.25 ± 5.43 B | 4.35 ± 0.25 B | 0.80 ± 0.04 B |
| PPG-DIC | 66.00 ± 10.25 B, C | 120.40 ± 22.35 B, C | 78.00 ± 8.95 B | 3.92 ± 0.53 B | 0.85 ± 0.02 B |
| CGA-DIC | 50.33 ± 6.48 B | 62.00 ± 6.02 A | 43.00 ± 1.15 A | 2.31 ± 0.11 A | 0.65 ± 0.08 C |
| VITE-DIC | 53.75 ± 5.54 B | 70.75 ± 8.66 A | 60.75 ± 2.95 C | 2.37 ± 0.20 A | 0.69 ± 0.06 C |
| CGA-DIC(P) | 47.00 ± 9.24 B | 55.50 ± 6.73 A | 55.75 ± 5.75 C | 2.00 ± 0.10 A | 0.62 ± 0.02 C |
Abbreviations: CGA, chlorogenic acid; DIC, diclofenac; PPG, propylene glycol, VITE, vitamin E; ALT, alanine aminotransferase; AST, aspartate aminotransferase; ALP, alkaline phosphatase; GGT, gama glutamil transferase; T.Bil, total bilirubin.
a Values are expressed as mean ± SD.
b The presence of different capital letters indicates a significant difference between groups (P < 0.05).
4.5. Histopathological Changes in Liver
The liver exhibited a normal structure in the control and CGA groups, with hepatocytes arranged in rows around the central vein of the hepatic lobules. Hepatocytes had centrally spherical and vesicular nuclei with eosinophilic cytoplasm. Sinusoids were observed between the hepatocytes (Figure 3A). Mild degenerative changes, characterized by cellular swelling and the formation of small cytoplasmic vacuoles, were observed in the vitamin E + DIC, CGA + DIC, and CGA + DIC(P) groups (Figure 3B). The DIC group (alone or with propylene glycol) exhibited more severe vacuolation than other groups. The severity of degenerative changes varied from mild (1+) to moderate (2+) degree (Figure 3C).
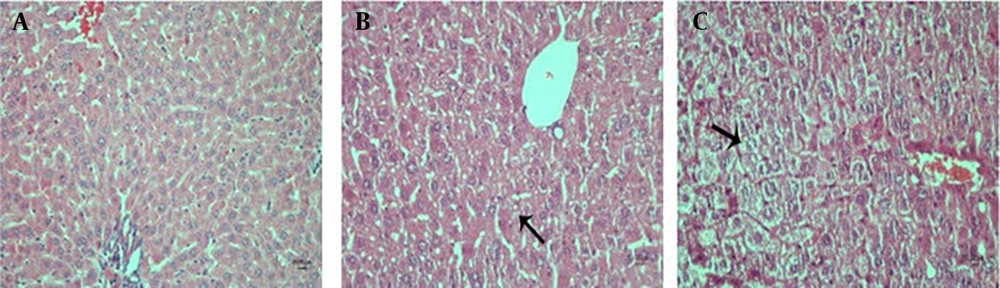
Figure 3.
A, normal liver architecture. Hepatocytes with eosinophilic cytoplasm and centrally spherical nuclei with vesicular chromatin (arrowhead) are arranged in a cord pattern. Between hepatocyte rows, sinusoids are visible (thick arrow). B, in the vitamin E+diclofenac (DIC), chlorogenic acid (CGA)+DIC, and CGA+DIC (P) groups, the cytoplasm of the hepatocyte shows mild degenerative changes, including vacuolation (1+) (arrow). C, The DIC group (alone or with propylene glycol) shows cellular swelling and moderate vacuolation (2+) in the cytoplasm (arrow). Sinusoids (thick arrow) are not visible clearly in all parts of the hepatic parenchyma due to cell swelling (Hematoxylin-Eosin, Scale = 10 μm).
5. Discussion
The present study evaluated the therapeutic potential of CGA against DIC-induced hepatotoxicity by modulating oxidative stress and suppressing inflammatory signaling pathways. Consistent with previous reports (4, 23), DIC administration significantly increased serum levels of AST, ALT, ALP, GGT, and total bilirubin, indicating severe hepatocellular injury and impaired liver function. Treatment with CGA (50 mg/kg) markedly reduced these liver biomarkers, suggesting that it stabilizes cell membrane integrity and prevents enzyme leakage. These observations align with earlier findings on CGA’s ability to decrease serum ALT and AST levels (24, 25). Vitamin E, used as a positive control, also ameliorated liver enzymes and bilirubin levels, consistent with the findings of M. Al-Shaikh (26).
Consistent with the biochemical data, our histopathological analysis revealed that treatment with both CGA and vitamin E markedly ameliorated the DIC-induced hepatocellular swelling and vacuolar degeneration.
diclofenac-induced hepatotoxicity primarily results from excessive generation of ROS, leading to oxidative damage and mitochondrial dysfunction (27, 28). In our study, DIC significantly elevated hepatic MDA levels and reduced the activity of key antioxidant enzymes (SOD, CAT, GPx), confirming oxidative stress induction. Chlorogenic acid treatment effectively decreased MDA levels and restored antioxidant enzyme activities, reflecting its potent free radical scavenging capacity and ability to restore tissue redox balance, in agreement with Dkhil et al. (13).
Beyond its direct antioxidant action, CGA exerts profound effects on mitochondrial function and nuclear signaling pathways. Emerging evidence indicates that CGA promotes mitochondrial biogenesis via the AMPK–PGC-1α axis, fine-tunes energy metabolism by stabilizing complex II activity, and enhances the mitochondrial antioxidant defense system (29-31). Furthermore, CGA directly modulates key cytoprotective pathways. For instance, Wang et al. demonstrated that CGA preserves mitochondrial membrane potential (MMP) by activating Nrf2/HO-1 and suppressing the non-canonical NF-κB pathway (TRAF2/RelB/p52) (7). Docking studies confirm that CGA interacts with the Keap1-binding site of Nrf2, promoting its nuclear translocation and enhancing antioxidant defenses (14). Additional mechanisms include the activation of the SIRT1/Nrf2 axis and suppression of NF-κB (16), as well as the suppression of NLRP3 inflammasome activation and IL-1β production in various injury models (32, 33). Recent evidence also suggests CGA regulates ferroptosis by activating the Nrf2/GPX4 pathway (17). Collectively, these findings indicate that CGA orchestrates a network of mitochondrial and nuclear pathways to maintain cellular bioenergetic homeostasis and reduce ROS production.
The anti-inflammatory properties of CGA significantly contribute to its hepatoprotection. Following oxidative stress induction, DIC increases hepatic expression of proinflammatory cytokines TNF-α and IL-1β via activation of NF-κB (21). Chlorogenic acid markedly downregulated these cytokines, in line with reports on its inhibitory effects on proinflammatory gene expression (11, 15, 34). Lee et al. further confirmed that CGA reduces inflammatory gene expression, including COX pathways, in experimental colitis (35). Recent data have also implicated microRNAs such as miR-372 in regulating apoptosis and cell proliferation, suggesting their potential role in mediating CGA’s protective effects (36).
Moreover, recent studies on plant polysaccharides have highlighted the role of the gut-liver axis in hepatoprotection, showing that improving intestinal barrier function and suppressing the LPS/TLR4/NF-κB pathway can reduce hepatic inflammation and oxidative stress (37-39). These findings provide supportive mechanistic context for CGA, suggesting its potential liver protection may also involve gut-liver axis modulation and phytochemical synergy.
In summary, the existing body of evidence indicates that CGA confers hepatoprotection through a multi-faceted mechanism, encompassing direct free-radical scavenging, enhancement of endogenous antioxidant defenses, modulation of critical mitochondrial functions, and suppression of pro-inflammatory signaling pathways.
Vitamin E showed potent protective effects in this study, consistent with its role as a lipid-soluble antioxidant that scavenges lipid peroxyl radicals, enhances SOD, CAT, and GPx activities, and inhibits lipid peroxidation and pro-inflammatory cytokine expression (40, 41). Based on previous findings on enhanced cellular uptake via nano-formulation (42), future studies could assess whether nano-formulated CGA exerts superior hepatoprotective effects compared with its free form.
5.1. Conclusions
The present study provides a comprehensive evaluation of DIC-induced hepatotoxicity, showing significant alterations in multiple oxidative stress markers, liver enzymes, bilirubin levels, pro-inflammatory cytokines, and histopathological changes. Chlorogenic acid effectively mitigated these alterations in both preventive and therapeutic regimens, and its hepatoprotective effects were primarily mediated through antioxidant and anti-inflammatory properties, as evidenced at molecular, biochemical, and structural levels, highlighting the multi-faceted protective potential of CGA. Overall, the findings suggest that CGA may serve as a promising natural agent for preventing DIC-induced liver injury. It should be noted that this study was conducted in a mouse model, and further studies are needed to confirm its clinical applicability in humans.