
1. Background
Human skin is the largest organ in the body and serves as the first barrier against environmental insults, among which solar UV radiation is one of the most damaging (1, 2). Terrestrial sunlight comprises UVA (320 - 400 nm) and UVB (280 - 320 nm). UVA penetrates the dermis and degrades collagen fibres, promoting photoaging, whereas the higher-energy UVB band is strongly absorbed by cutaneous chromophores and cellular DNA and contributes to erythema, sunburn, and the mutational events associated with melanoma and non-melanoma skin cancers (3, 4).
Much of this injury occurs via reactive oxygen species and the ensuing oxidative stress, which peroxidizes membrane lipids, induces inflammatory mediators such as COX-2 and iNOS, and damages structural proteins (5, 6). Synthetic and mineral filters (including avobenzone, titanium dioxide, and zinc oxide) are widely used; however, each has recognized drawbacks, including cutaneous sensitization, potential percutaneous absorption, an unwanted whitening cast, and demonstrable harm to aquatic ecosystems (7-10).
Milk thistle (Silybum marianum L. Gaertn., Asteraceae) is a rich source of the flavonolignan complex silymarin, which comprises silibinin, isosilybin, silychristin, and silydianin (11). Silymarin is a potent antioxidant and radical scavenger with anti-inflammatory and DNA-repair activity (12-15). Because flavonolignans contain aromatic rings and multiple hydroxyl substituents, they absorb within the UVB region and part of the UVA range and may provide passive optical filtering; accordingly, photoprotection in the present work was evaluated only across the UVB band (290 - 320 nm) (16-20).
2. Objectives
On this basis, milk thistle seed extract was evaluated as a botanical additive in a conventional O/W cream rather than as a stand-alone regulated UV filter. Emulsions were prepared at four nominal loads (5%, 10%, 20%, and 30% w/w) and characterized in terms of physicochemical properties, rheology, storage stability, and in vitro SPF. A specific objective was to determine whether the SPF response scaled proportionally with extract content or approached a plateau, as this behavior determines the most efficient load for further development.
3. Methods
3.1. Materials and Instrumentation
Milk thistle (Silybum marianum) seeds were obtained from a reputable supplier, authenticated by a pharmacognosy specialist, and assigned herbarium code A2401931SP at the School of Pharmacy, Ahvaz Jundishapur University of Medical Sciences. Ethanol 96° was supplied by Kimia Alcohol Zanjan (Iran), and Folin–Ciocalteu reagent was purchased from Sigma-Aldrich (St. Louis, MO, USA). Tannic acid, sodium carbonate, cetyl alcohol, cetostearyl alcohol, stearic acid, liquid paraffin, triethanolamine (TEA), glycerin, and methylparaben were of analytical grade (Merck, Darmstadt, Germany). Deionized distilled water was used throughout.
Instrumentation included a UV-Vis spectrophotometer (Biowave II, WPA, Cambridge, UK), a digital pH meter (Mettler Toledo AG8603, Greifensee, Switzerland), a rotational viscometer (Brookfield DV-II+ Pro, Middleboro, MA, USA), a homogenizer (Heidolph Silent Crusher M, Schwabach, Germany), a vacuum rotary evaporator (Heidolph Laborota 4011, Schwabach, Germany), a freeze-dryer (Operon FDCF-12006, Gimpo, South Korea), and an analytical balance readable to 0.0001 g (Mettler Toledo MS204S, Greifensee, Switzerland).
3.2. Extraction and Determination of Total Phenolic Content (TPC)
Milk thistle seed powder (1000 g) was macerated in 70% ethanol at room temperature over three successive 24-h cycles (21). The pooled filtrate was clarified through Whatman No. 1 paper, concentrated under reduced pressure using a rotary evaporator (Heidolph Laborota 4011), and dried by lyophilization (Operon FDCF-12006). Extractions were performed in three independent batches (n = 3) to allow the yield to be reported as mean ± SD.
Total phenolic content was measured using the Folin–Ciocalteu method against a tannic acid standard curve (10 - 100 ppm). A 0.5 mL aliquot of extract or standard was mixed with 2.5 mL of ten-fold-diluted Folin–Ciocalteu reagent; after 5 min, 2.00 mL of 7.5% sodium carbonate was added. The mixture was kept in the dark for 2 h, and absorbance was read at 765 nm against a reagent blank. Tannic acid was used as the calibration standard; therefore, results are expressed as tannic acid equivalents (mg TAE/g dry extract). This reflects the total reducing/phenolic capacity of the extract rather than a compound-specific quantification of individual silymarin flavonolignans (22).
3.3. Preparation of the O/W Emulsions
Four topical creams containing nominal loads of 5%, 10%, 20%, and 30% (w/w) milk thistle extract were prepared according to the composition shown in Table 1. The aqueous phase (purified water, glycerin, triethanolamine, methylparaben, and extract) and the oil phase (stearic acid, cetyl alcohol, cetostearyl alcohol, and liquid paraffin) were heated separately to 75 - 80 °C in a water bath. The oil phase was then added to the aqueous phase under continuous stirring, which was maintained until the emulsion cooled to room temperature; the product was then processed using a homogenizer (Heidolph Silent Crusher M) to standardize the droplet size of the dispersed phase.
Table 1.
Composition of the Milk Thistle Cream Formulations (Grams per Nominal 30.0-G Batch) a
| Ingredients | Role in Formulation | Cream 5% | Cream 10% | Cream 20% | Cream 30% |
|---|---|---|---|---|---|
| Stearic acid | Emulsifier / stiffening agent | 1.25 | 1.25 | 1.25 | 1.25 |
| Cetostearyl alcohol | Emulsion stabilizer / viscosity builder | 0.50 | 0.50 | 0.50 | 0.50 |
| Cetyl alcohol | Emollient / co-emulsifier | 0.25 | 0.25 | 0.25 | 0.25 |
| Liquid paraffin | Oil phase / emollient | 0.75 | 0.75 | 0.75 | 0.75 |
| Triethanolamine (TEA) | pH adjuster / neutralizer | 0.125 | 0.125 | 0.125 | 0.125 |
| Glycerin | Humectant / co-solvent | 0.75 | 0.75 | 0.75 | 0.75 |
| Methylparaben | Antimicrobial preservative | 0.03 | 0.03 | 0.03 | 0.03 |
| S. marianum extract (dry) | Active antioxidant / UV-screening botanical additive | 1.25 | 2.50 | 5.00 | 7.25 |
| Purified water | Continuous phase (emulsion base) | q.s. to 30.0 | q.s. to 30.0 | q.s. to 30.0 | q.s. to 30.0 |
| Total batch mass (g) | — | 30.00 | 30.00 | 30.00 | 30.00 |
a The 5%, 10%, 20%, and 30% designations are nominal formulation codes. The weighed dry-extract contents were 1.25, 2.50, 5.00, and 7.25 g per 30.0-g batch, corresponding to ≈ 4.2%, 8.3%, 16.7%, and 24.2% w/w of the finished cream. Purified water was added as q.s. to a total batch mass of 30.0 g; consequently the water quantity decreases as the extract load rises. All excipient masses are constant across the four creams.
The four creams were designated according to their nominal extract codes (5%, 10%, 20%, and 30%). Each was prepared to a nominal batch mass of 30.0 g, with purified water added as q.s. to 30.0 g; the corresponding weighed dry-extract masses were 1.25, 2.50, 5.00, and 7.25 g, respectively (Table 1). On this basis, the actual dry-extract content of the finished creams was approximately 4.2%, 8.3%, 16.7%, and 24.2% w/w. The 5 - 30% labels were retained throughout as formulation codes for consistency with the laboratory protocol.
3.4. Physicochemical Evaluation and Accelerated Stability
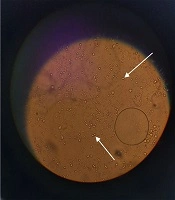
Organoleptic properties (uniformity, color, odour, freedom from grit, and any phase separation 48 h after manufacture) were inspected first. Physical robustness was then assessed over six consecutive freeze–thaw cycles, each consisting of 48 h at −8 °C followed by 48 h at 25 °C. For pH monitoring, diluted samples (5 g in 50 mL of distilled water) were measured in triplicate using a calibrated pH meter on days 0, 7, 30, and 90. Emulsion type (O/W versus W/O) was confirmed by electrical conductivity and methylene blue staining under the microscope. Between assessments, samples were stored in sealed containers protected from light at 25 ± 2 °C.
Spreadability was assessed by placing 1.00 g of cream between two 20 × 20 cm glass plates; a 125 g weight was applied to the upper plate for 1 min, and the diameter of the resulting circle was recorded in triplicate. Rheological behavior and apparent viscosity were characterized using a Brookfield DV-II+ Pro rotational viscometer fitted with spindle 64 (a coaxial small-sample spindle) at rotational speeds of 5, 10, 20, 40, and 50 rpm and 25 ± 1 °C, in triplicate, with readings taken only within the instrument’s recommended 10 - 90% torque window. Because a defined shear-rate constant is not available for this spindle–chamber geometry, rotational speed (rpm) is reported directly as the independent variable and treated as a proportional proxy for shear rate; apparent-viscosity data were fitted to the power-law model τ = K·γn, from which the flow behavior index (n) and consistency index (K) were derived (23).
3.5. Determination of the in Vitro Sun Protection Factor (SPF)
SPF was estimated in vitro using the spectrophotometric method of Mansur (24). A 1.00 g portion of each cream was transferred to a 100 mL volumetric flask, dispersed, and brought to volume with ethanol under sonication to ensure complete, particle-free dissolution; a 1.00 mL aliquot was then diluted to 10 mL with ethanol. Absorbance was recorded from 290 to 320 nm at 5-nm intervals in a 1-cm quartz cuvette (Biowave II UV-Vis) against an ethanol solvent blank (n = 3); each solution was inspected for optical clarity before measurement. The analysis is presented as a Mansur-derived in vitro SPF screening estimate rather than a standardized, labelled (in vivo) SPF; because no extract-free vehicle (0%) or reference sunscreen was measured in parallel, background absorbance was not subtracted, and no benchmark comparison was made. SPF was computed using the Mansur equation, SPF = CF × Σ290 - 320 EE(λ) × I(λ) × Abs(λ), where CF = 10 is the correction factor, EE(λ) is the erythemal effect spectrum, I(λ) is the solar intensity spectrum, and Abs(λ) is the measured absorbance at wavelength λ; the product EE(λ) × I(λ) was taken as the constant tabulated by Sayre (25). Because measurements were confined to 290 - 320 nm, the reported values describe UVB screening only and were not extended to broad-spectrum or UVA claims. A small number of absorbance readings at 290 and 295 nm slightly exceeded 2.0 absorbance units, which is outside the optimal linear photometric range of the instrument; these readings were retained for completeness but flagged, and a sensitivity analysis excluding them is reported in Section 4.6 and in Study Limitations (Section 5.1).
3.6. Statistical Analysis
All data are reported as mean ± standard deviation (SD). The experimental unit was the independent formulation batch: three separate batches of each cream (n = 3) were manufactured and analyzed, and triplicate instrument readings within each batch were averaged to a single batch value before inferential analysis, such that technical (analytical) replicates were not treated as independent observations. This defines n = 3 as three independent batches throughout and avoids pseudoreplication. Analyses were conducted in SPSS (version 26; IBM Corp., Armonk, NY, USA) and in Python using the SciPy and Statsmodels libraries, and normality was assessed using the Shapiro–Wilk test. Between-formulation differences at a given time point were assessed by one-way ANOVA with Tukey HSD. The 90-day pH data were analyzed by repeated-measures ANOVA with formulation as the between-batch factor and storage time as the within-batch (repeated) factor; the formulation × time interaction was examined, and the Greenhouse–Geisser correction was applied when Mauchly’s test indicated departure from sphericity. Effect size was reported as partial eta-squared (ηp2), exact P values are provided, and statistical significance was set at P < 0.05.
4. Results
Throughout the Results, the formulations are identified by their nominal extract codes (5%, 10%, 20%, and 30% w/w), which correspond to actual dry-extract contents of approximately 4.2%, 8.3%, 16.7%, and 24.2% w/w, respectively; the nominal codes are used hereafter for brevity.
4.1. Extraction Yield and Total Phenolic Content (TPC)
From 1000 g of milk thistle seed powder, a mean of 20.00 ± 0.80 g of dry extract was recovered, corresponding to an extraction yield of 2.00 ± 0.08% (n = 3). The tannic acid calibration curve was linear (y = 0.0095x − 0.0159; R2 = 0.9988; R2adj = 0.9982), and the total phenolic content of the dry seed extract was 23.67 ± 0.22 mg TAE/g dry extract (n = 3). The extract was characterized by yield and total phenolic content; a compound-specific chromatographic (HPLC) fingerprint of the silymarin flavonolignans was not obtained. Therefore, downstream interpretations relate to the measured phenolic content rather than to individual purified constituents (see Study Limitations).
4.2. Organoleptic Properties and Freeze–Thaw Stability
All four creams were uniform in texture, free of grit, and free of entrapped air. As the extract load increased, the color deepened from a light cream at the nominal 5% load to a dark orange-beige at the nominal 30% load. Conductivity testing and methylene blue staining confirmed that each formulation was an O/W emulsion. Across six freeze–thaw cycles, none of the creams showed phase separation, creaming, oil bleeding, or any change in texture or odour. These observations reflect short-term physical robustness under thermal cycling and do not constitute a full shelf-life or chemical-stability assessment.
4.3. pH Stability Over Time
Table 2.
pH of the Cream Formulations Over 90 Days of Storage (N = 3) a
| Cream Formulation | pH Day 0 | pH Day 7 | pH Day 30 | pH Day 90 | P (Time) |
|---|---|---|---|---|---|
| Cream 5% | 7.24 ± 0.05 | 7.28 ± 0.04 | 7.20 ± 0.06 | 7.00 ± 0.05 | 0.082 |
| Cream 10% | 6.80 ± 0.04 | 6.90 ± 0.05 | 6.84 ± 0.03 | 6.88 ± 0.04 | 0.145 |
| Cream 20% | 6.57 ± 0.03 | 6.60 ± 0.04 | 6.63 ± 0.03 | 6.65 ± 0.05 | 0.210 |
| Cream 30% | 6.30 ± 0.05 | 6.37 ± 0.04 | 6.50 ± 0.06 | 6.45 ± 0.04 | 0.095 |
| P (between groups) | < 0.001 | < 0.001 | < 0.001 | < 0.001 | — |
a Values are expressed as mean ± SD. Repeated-measures ANOVA: formulation (between-batch) main effect F (3, 8) = 142.50, P < 0.001, ηp2 = 0.981; formulation × time interaction F(9, 24) = 1.38, P = 0.252, ηp2 = 0.341 (not significant). The 'P (time)' column gives the within-formulation effect of storage time. Formulation codes as defined in Table 1 (nominal 5 - 30%; actual ≈ 4.2 - 24.2% w/w).
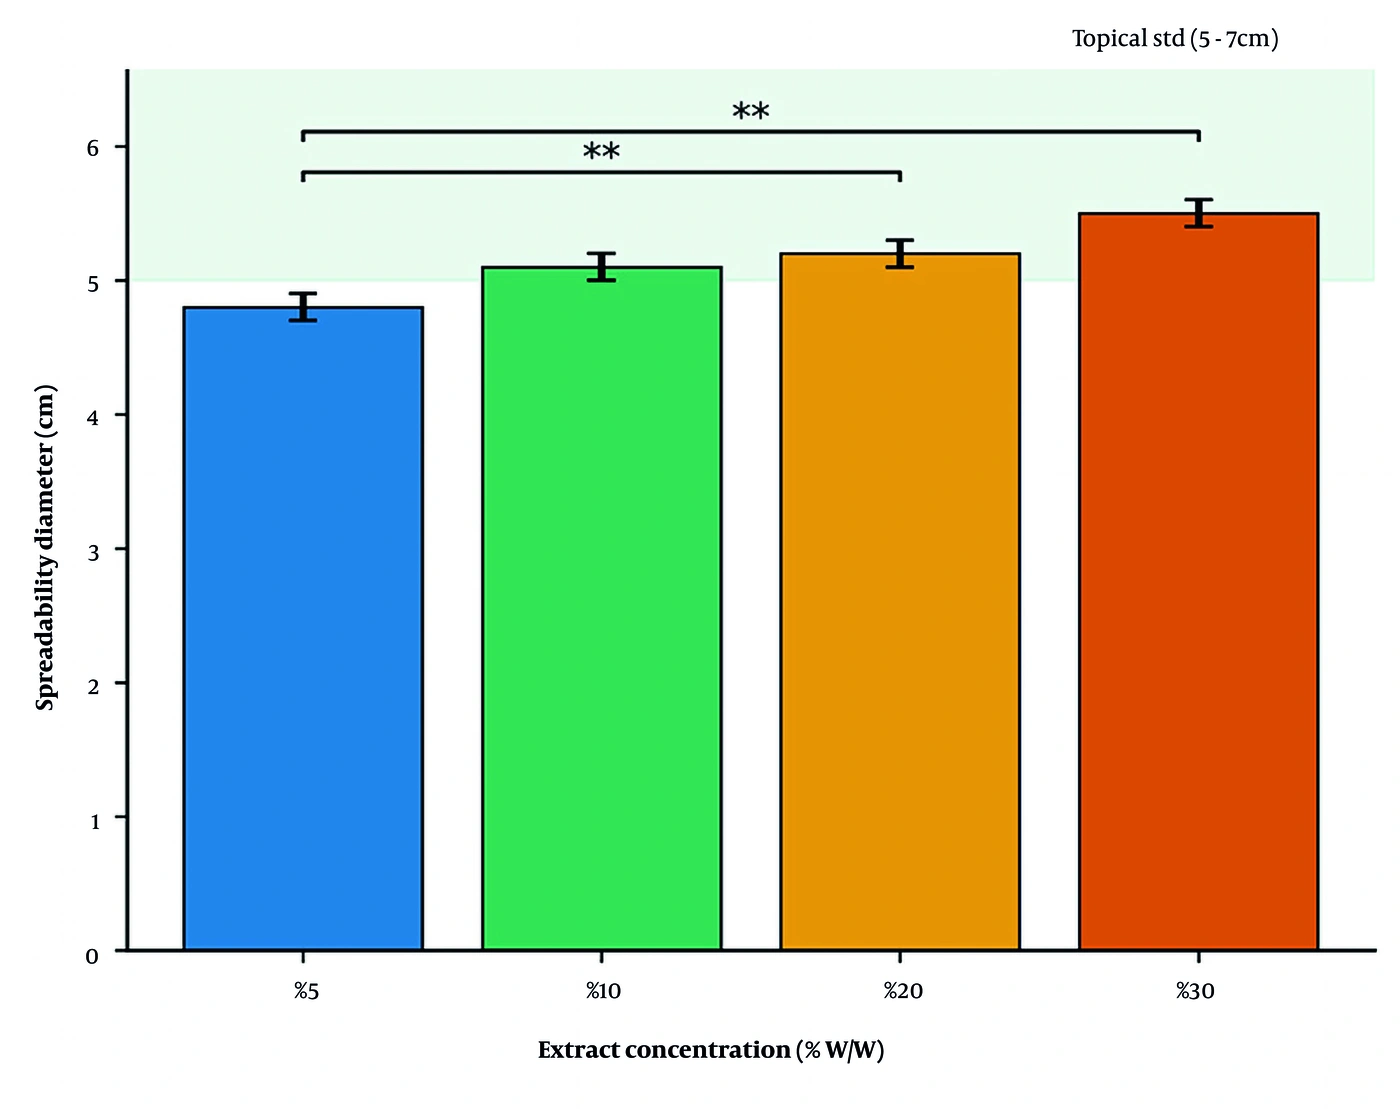
Figure 1.
Storage pH of the four formulations (nominal 5%, 10%, 20%, and 30% w/w; actual ≈ 4.2%, 8.3%, 16.7%, and 24.2% w/w) over 90 days (mean ± SD, n = 3). The shaded band marks the commonly accepted topical pH range (4.5 - 7.5). The within-group time effect was not significant (ns) for any formulation.
Repeated-measures ANOVA showed that pH became significantly more acidic as the extract load increased [F(3, 8) = 142.50, P < 0.001, ηp2 = 0.981], a shift attributable to the acidic phenolic and flavonolignan constituents. The formulation × time interaction was not significant [F(9, 24) = 1.38, P = 0.252, ηp2 = 0.341], indicating that the pH trajectory over the 90-day period did not differ among the four loads. Over the 90-day period, none of the formulations changed significantly (P > 0.05). Measured pH values ranged from 6.30 to 7.28. This range is reported consistently here and in the Discussion and falls within the interval generally regarded as acceptable for leave-on topical products (approximately 4.5 - 7.5). We describe these values as compatible with topical use rather than as matching the pH of intact skin surfaces, which is more acidic (≈4.5 - 5.5).
4.4. Spreadability
Spreadability increased with extract load (Figure 2). The circle diameter was 4.80 ± 0.10 cm for the 5% cream, 5.10 ± 0.10 cm for the 10% cream, 5.20 ± 0.10 cm for the 20% cream, and 5.50 ± 0.10 cm for the 30% cream. One-way ANOVA confirmed a significant between-group difference [F(3, 8) = 25.00, P = 0.000204, ηp2 = 0.9036], and Tukey HSD indicated that the 20% and 30% creams spread significantly more than the 5% cream (P < 0.01). The 10%, 20%, and 30% creams fell within the 5 - 7 cm range generally accepted for topical products.
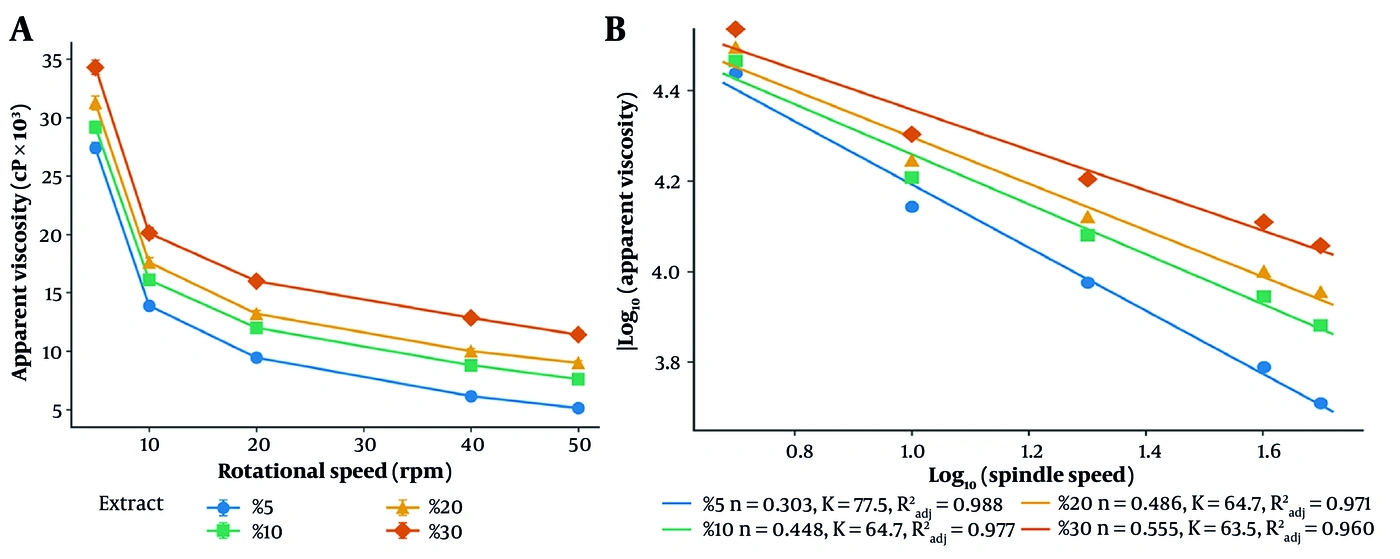
Figure 2.
Spreadability of the four formulations (mean ± SD, n = 3); ** P < 0.01 versus the nominal 5% cream (Tukey HSD).
4.5. Rheological Behavior and Viscosity
Viscosity across the 5 - 50 rpm range is reported in Table 3.
Table 3.
Viscosity (Centipoise, cP) of the Cream Formulations at Different Rotational Speeds (N = 3) a
| Rotational speed (rpm) | Cream 5% | Cream 10% | Cream 20% | Cream 30% |
|---|---|---|---|---|
| 5 | 27400 ± 450 | 29200 ± 520 | 31250 ± 580 | 34300 ± 620 |
| 10 | 13900 ± 310 | 16100 ± 380 | 17600 ± 410 | 20100 ± 460 |
| 20 | 9450 ± 210 | 12000 ± 250 | 13200 ± 290 | 16000 ± 330 |
| 40 | 6150 ± 180 | 8800 ± 200 | 10000 ± 220 | 12850 ± 260 |
| 50 | 5120 ± 140 | 7600 ± 170 | 9000 ± 190 | 11400 ± 230 |
a Values are expressed as mean ± SD. Values are single-point rotational-viscometry readings (spindle 64, 10 - 90% torque window); rotational speed (rpm) serves as a proportional shear-rate proxy. Formulation codes as in Table 1.
As the rotational speed increased from 5 to 50 rpm, the apparent viscosity of each formulation decreased steeply, consistent with non-Newtonian, pseudoplastic (shear-thinning) flow (Figure 3A). Fitting the power-law model (τ = K·γn) returned n = 0.303 and K = 77.52 Pa·sn (R2adj = 0.988) for the nominal 5% cream, n = 0.448 and K = 64.74 Pa·sn (R2adj = 0.977) for the 10% cream, n = 0.486 and K = 64.73 Pa·sn (R2adj = 0.971) for the 20% cream, and n = 0.555 and K = 63.48 Pa·sn (R2adj = 0.960) for the 30% cream. In each formulation, the apparent viscosity decreased with increasing rotational speed, and a power-law flow behavior index below unity (n < 1) is consistent with pseudoplastic, shear-thinning behavior; because a defined shear-rate constant was not available for this spindle–chamber geometry, this classification is inferred from single-point rotational-viscometry data rather than confirmed using a defined shear-rate geometry. This flow profile is well suited to topical products, as it facilitates extrusion from the tube and spreading on the skin while resisting flow at rest.
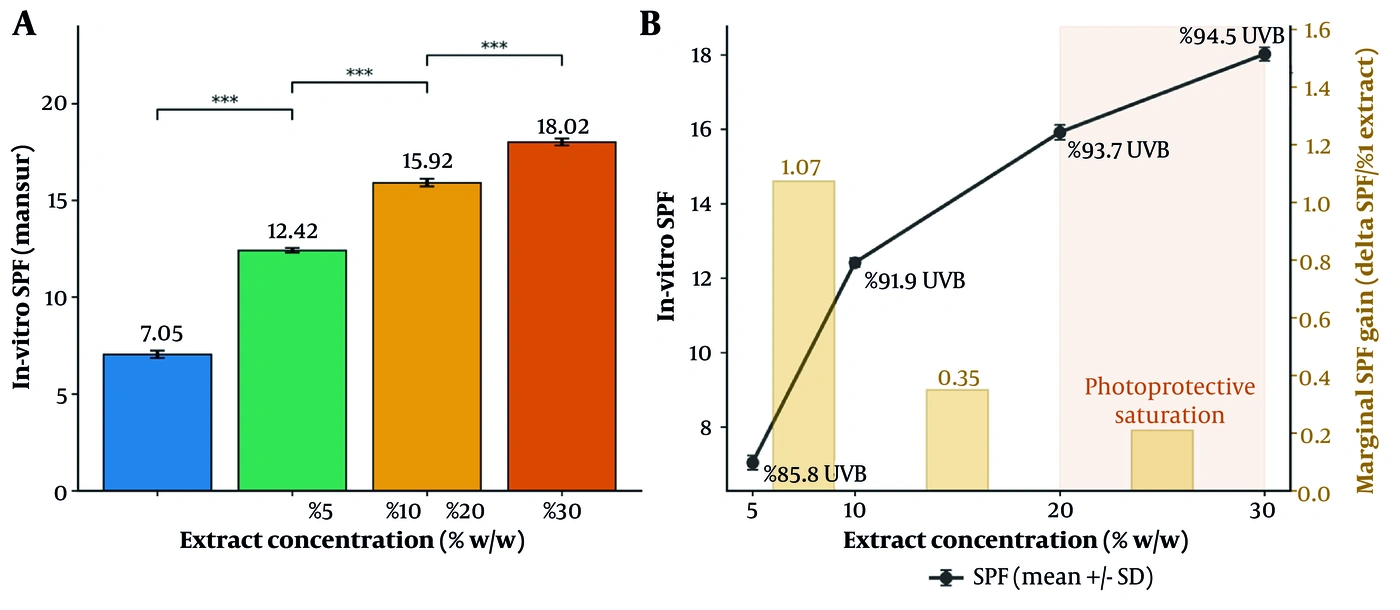
Figure 3.
(A) Apparent viscosity versus rotational speed, consistent with pseudoplastic, shear-thinning behavior (mean ± SD, n = 3). (B) Log–log linearization with the fitted power-law parameters (n, K, R2adj) annotated per formulation.
4.6. Photoprotective Efficacy (in Vitro SPF)
The absorbance values over 290 - 320 nm and the SPF derived from the Mansur equation are presented in Table 4.
Table 4.
Spectral Absorbance (Abs) and Calculated Mansur-Derived in Vitro SPF Screening Estimate for the Cream Formulations (N = 3) a
| λ (nm) | EE(λ) × I(λ) | Abs 5% | Abs 10% | Abs 20% | Abs 30% |
|---|---|---|---|---|---|
| 290 | 0.0150 | 0.851 ± 0.021 | 1.680 ± 0.035 | 2.150 ± 0.042 | 2.280 ± 0.048 |
| 295 | 0.0817 | 0.867 ± 0.018 | 1.570 ± 0.028 | 2.000 ± 0.038 | 2.160 ± 0.041 |
| 300 | 0.2874 | 0.796 ± 0.015 | 1.410 ± 0.025 | 1.820 ± 0.031 | 2.040 ± 0.039 |
| 305 | 0.3278 | 0.700 ± 0.014 | 1.223 ± 0.022 | 1.550 ± 0.029 | 1.780 ± 0.035 |
| 310 | 0.1864 | 0.600 ± 0.012 | 1.031 ± 0.019 | 1.340 ± 0.024 | 1.540 ± 0.030 |
| 315 | 0.0837 | 0.520 ± 0.010 | 0.900 ± 0.016 | 1.155 ± 0.020 | 1.340 ± 0.026 |
| 320 | 0.0180 | 0.460 ± 0.009 | 0.800 ± 0.014 | 1.030 ± 0.018 | 1.220 ± 0.022 |
| Sum (Σ) | 1.0000 | 0.7055 | 1.2415 | 1.5918 | 1.8016 |
| SPF (CF × Σ) | — | 7.05 ± 0.19 | 12.42 ± 0.12 | 15.92 ± 0.20 | 18.02 ± 0.18 |
a Values are expressed as mean ± SD. Absorbance values exceeding 2.0 units (highlighted: nominal 20% cream at 290 nm; nominal 30% cream at 290, 295, and 300 nm) lie outside the optimal linear photometric range and are flagged accordingly; a sensitivity analysis (Section 4.6) shows that excluding these wavelengths does not change the rank order of the formulations or the saturation plateau. Formulation codes as in Table 1 (nominal 5 - 30%; actual ≈ 4.2 - 24.2% w/w). SPF is the Mansur-derived in vitro screening estimate (CF × Σ).
One-way ANOVA revealed a highly significant difference in SPF among the formulations [F(3, 8) = 2318.27, P < 0.0001, ηp2 = 0.9989]. Tukey HSD showed significant increases from 5% to 10% (P < 0.001) and from 10% to 20% (P < 0.001); the increase from 20% to 30% was also significant (P < 0.001) but was accompanied by a sharp decline in the SPF gained per unit of extract (Figures 4 and 5). A fourfold increase in load from 5% to 20% increased SPF from 7.05 to 15.92 (a 2.26-fold gain), whereas the further increase from 20% to 30% raised it only from 15.92 to 18.02. For context, the theoretical fraction of UVB attenuated can be estimated from SPF as (1 − 1/SPF) × 100, giving ≈ 85.8%, 91.9%, 93.7%, and 94.5% for the 5%, 10%, 20%, and 30% creams; these are model-derived percentages, not directly measured transmittances. All SPF values are reported as Mansur-derived in vitro SPF screening estimates.
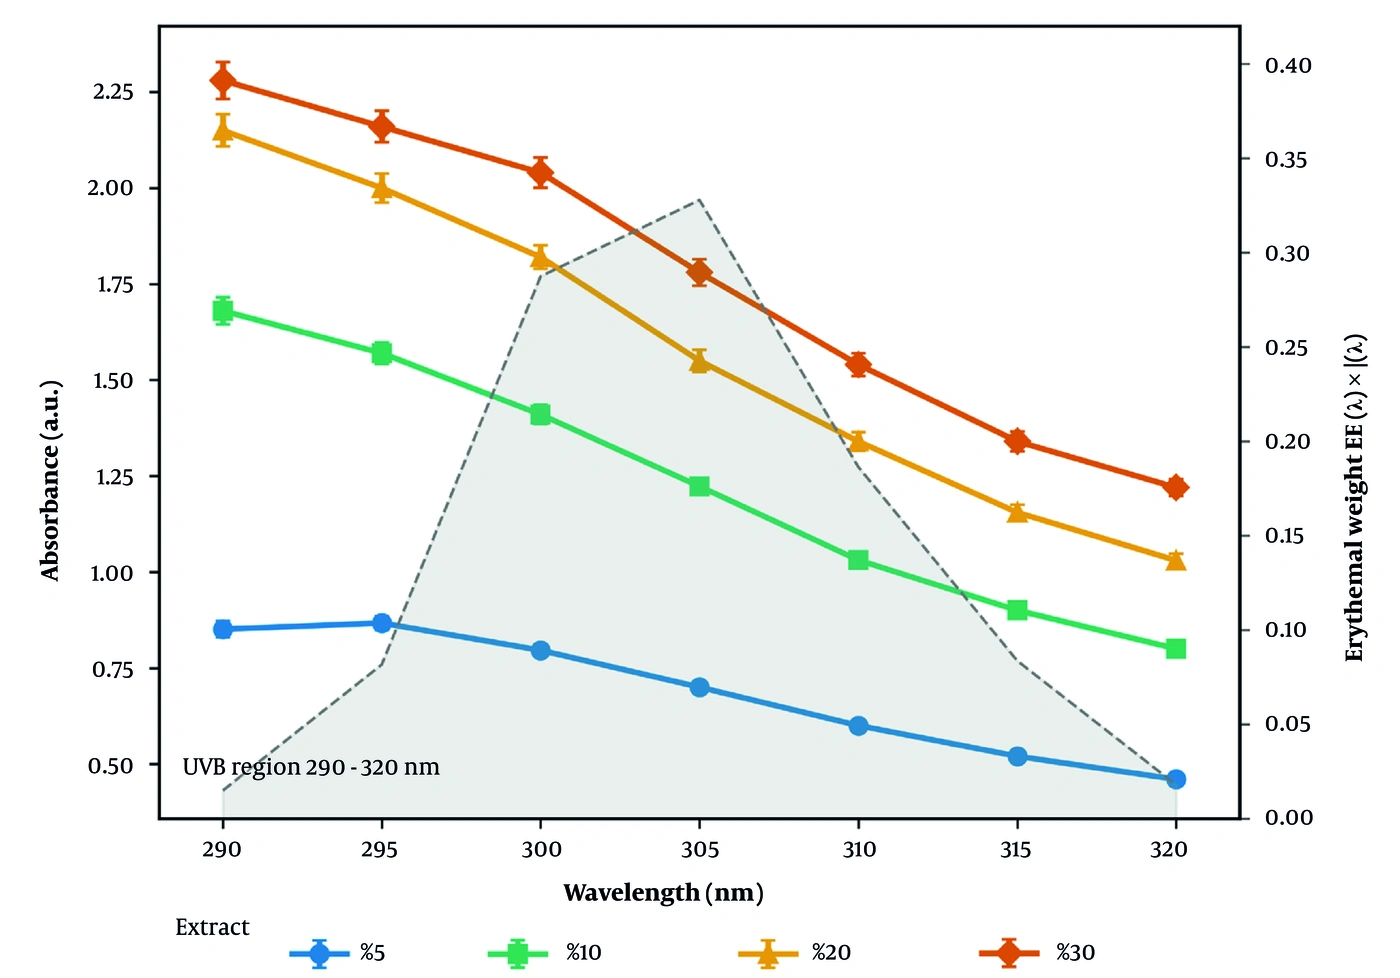
Figure 4.
(A) Mansur-derived in vitro SPF screening estimate (mean ± SD, n = 3); *** P < 0.001 for adjacent pairs (Tukey HSD). (B) SPF versus extract concentration overlaid with the marginal SPF gain per 1% extract, showing the saturation onset between the nominal 20% and 30% loads. The percentage annotations are theoretical UVB-attenuation values derived from SPF as (1 − 1/SPF) × 100.
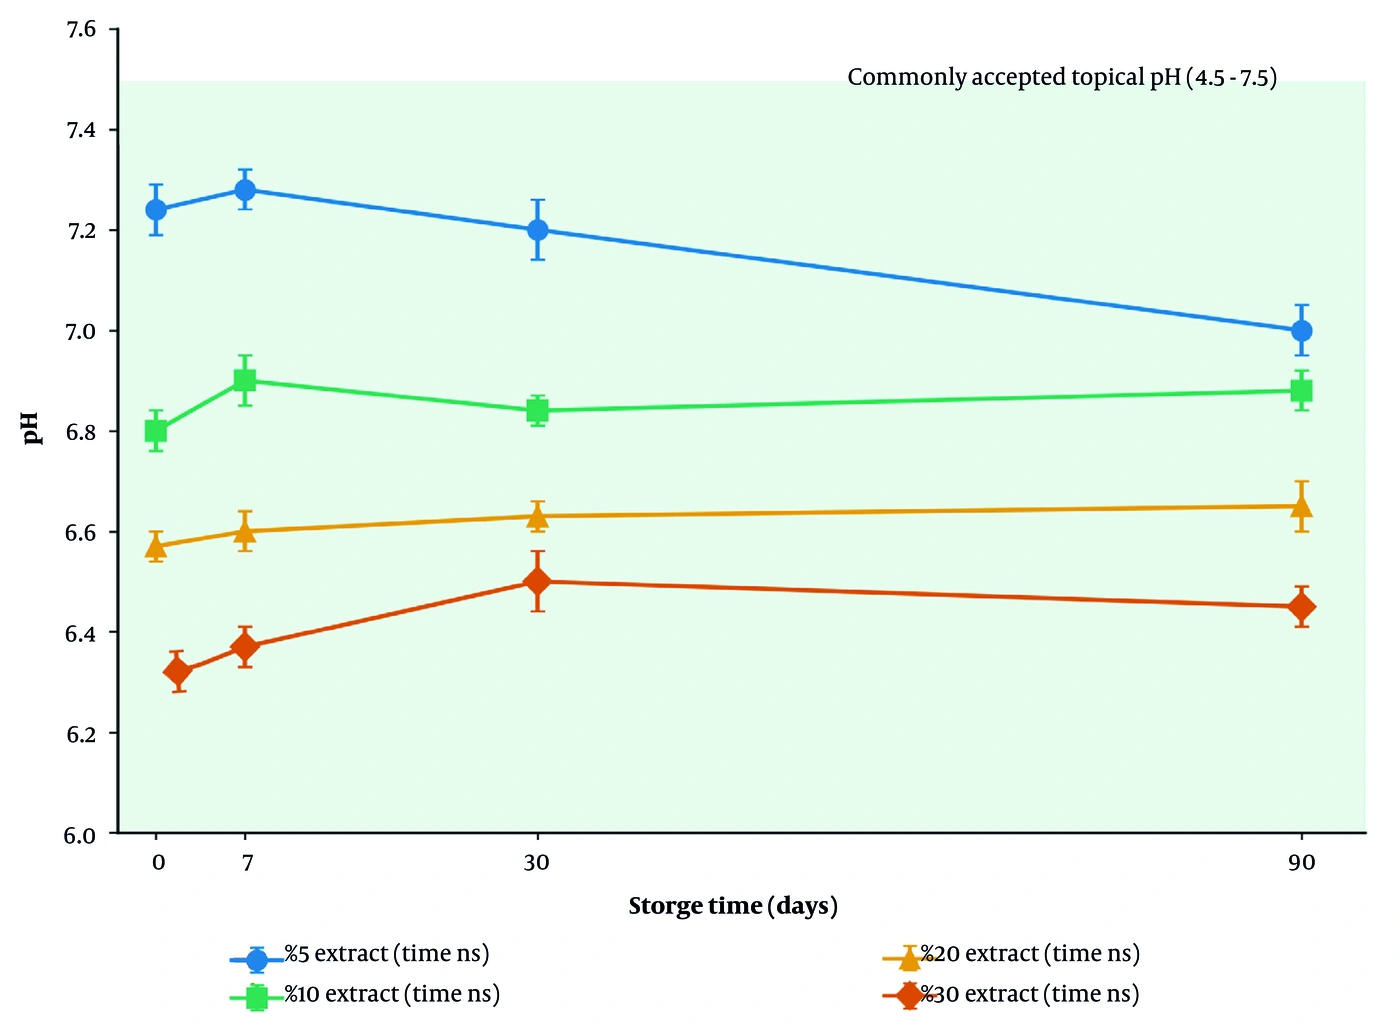
Figure 5.
UVB spectral absorbance (290 - 320 nm) of the four formulations (mean ± SD, n = 3). The shaded profile shows the erythemal weighting EE(λ) × I(λ), peaking near 305 nm. Absorbance readings above 2.0 units at 290 - 300 nm for the higher loads fall outside the optimal linear photometric range (see Section 4.6 and Table 4).
Because a small number of absorbance readings at 290 and 295 nm exceeded 2.0 units (a range in which the photometric response departs from the optimal linear range), a sensitivity analysis was performed to test whether these near-saturating values determined the outcome. When the 290 and 295 nm points were excluded and the erythemal weights were renormalized over the remaining 300 - 320 nm interval, the recomputed Mansur-derived in vitro SPF screening estimates were 6.88, 12.05, 15.46, and 17.61 for the nominal 5%, 10%, 20%, and 30% creams, respectively. Each estimate shifted by only about 2 - 3% relative to the full 290 - 320 nm calculation, and both the rank order (nominal 5% < 10% < 20% < 30%) and the saturation profile (a steep rise to the nominal 20% load followed by a shallow gain to 30%) were unchanged. Applying the stricter criterion of excluding every wavelength at which any reading exceeded 2.0 units (290 - 300 nm) likewise preserved the rank order. The monotonic ranking and the plateau are therefore not artifacts of the near-saturating absorbance values at the shortest wavelengths (see Section 5.1).
5. Discussion
Sunscreen products based on natural bioactive compounds have attracted considerable interest, owing to their comparatively mild side-effect profile and the antioxidant, anti-inflammatory, and photoprotective properties they may provide (19, 26, 27). In this study, O/W emulsions loaded with milk thistle (Silybum marianum) seed extract were formulated and characterized as stable topical creams at four nominal loads.
The total phenolic content of the dry seed extract, 23.67 ± 0.22 mg TAE/g, is consistent with the flavonolignan richness of milk thistle seed (21, 28). Silymarin’s aromatic rings, together with its carbonyl and hydroxyl groups, enable it to act as a UV chromophore that absorbs UVB photons and dissipates their energy as heat (29-31). In the present series, in vitro SPF tracked the phenolic load of the creams, and the ordering of SPF across formulations paralleled their total phenolic content. This association is consistent with a phenolic contribution to UVB attenuation, although the correlational design cannot establish that phenolic compounds are the sole absorbing species. Because the extract was not resolved into individual constituents, the photoprotective behavior is attributed to its measured phenolic content rather than to purified silymarin or silibinin. Beyond photon absorption, the antioxidant, anti-inflammatory, DNA-repair, and immunomodulatory actions reported for silymarin in UV-exposed skin (14, 15, 20, 32-34) suggest that the extract may provide biological photoprotection that complements its passive optical role; more broadly, milk thistle extracts exhibit a spectrum of pharmacological activities, including antimicrobial effects (35).
From a physicochemical standpoint, all formulations showed sound physical stability under the freeze–thaw challenge. Although the addition of the extract acidified the base in proportion to its phenolic content, the pH of all samples (6.30 - 7.28) remained within the accepted range for leave-on products and therefore poses little risk of irritation (36). All creams showed reductions in apparent viscosity with increasing rotational speed, consistent with pseudoplastic, shear-thinning behavior, with flow indices between 0.303 and 0.555. This profile is well suited to topical use, as high viscosity at rest resists phase separation, whereas the decrease in viscosity under shear allows smooth, even application (23, 37).
The central observation of this work is the shape of the SPF dose–response curve and the plateau it approaches: SPF rose steeply up to 20% and then flattened. Several physicochemical processes may plausibly contribute to this diminishing return and are presented here as hypotheses rather than demonstrated mechanisms. At high extract loads, chromophore crowding and partial aggregation in the continuous phase could reduce the effective photon-capture area through self-shielding (38). Concentration-dependent intermolecular interactions and light scattering may also produce departures from the linear Beer–Lambert relationship between absorber concentration and optical density (25). In addition, as the aqueous phase approaches its solubility ceiling near the highest load, the associated increase in viscosity might hinder fully uniform dispersion of the chromophore within the thin applied film. These proposed mechanisms were not tested directly in the present study and would require dedicated optical and colloidal experiments for confirmation.
Selection of the preferred load was based on a simple multicriteria comparison rather than on SPF alone. The marginal SPF gained per 1% of added extract fell from about 1.07 units (5→10%) to 0.35 (10→20%) and 0.21 (20→30%). Increasing the load from 20% to 30% required roughly 45% more extract (5.00 to 7.25 g per batch) yet increased the theoretical UVB attenuation by less than one percentage point (≈ 93.7% to ≈ 94.5%), while all creams remained within the accepted spreadability window (5.20 and 5.50 cm for the 20% and 30% creams). Weighing photoprotective gain, extract economy, and handling together, the nominal 20% cream offers the best balance and is presented only as a provisional preferred candidate for further formulation optimization, not as a proven optimum; the 30% cream provides no photoprotective advantage commensurate with its higher extract burden. This designation is provisional because it is based on an in vitro screening estimate obtained without an extract-free vehicle or a reference sunscreen, and on an extract characterized only by its total phenolic content (Section 5.1).
A recognized limitation of unencapsulated botanical actives is their finite photostability and restricted skin permeation. Encapsulation in lipid-based nanocarriers, and nanostructured lipid carriers in particular, has been reported to improve UVB protection, colloidal stability, and cutaneous retention of silymarin and comparable polyphenols (39-42). Consistent with this, silymarin-loaded nanostructured lipid carriers formulated specifically for UV protection have recently been prepared and characterized in vitro (43). Such encapsulation represents a rational next step for advancing the present emulsion toward in vivo evaluation.
5.1. Study Limitations
Several limitations should temper the interpretation of these findings. First, the study compared only extract-loaded creams; an extract-free vehicle (0%) and a recognized reference sunscreen were not measured in parallel, so background absorbance could not be formally subtracted and relative performance against a benchmark was not established. Second, the extract was standardized only by yield and total phenolic content; an HPLC fingerprint of the individual silymarin flavonolignans (silibinin, isosilybin, silychristin, silydianin) was not obtained. Third, photoprotection was assessed solely by the in vitro Mansur estimate; cellular or in vivo antioxidant, anti-inflammatory, and photoprotection assays were not performed, so the biological contributions remain inferential. Fourth, a small number of absorbance readings at 290 and 295 nm (and, for the nominal 30% cream, at 300 nm) exceeded 2.0 units, outside the optimal linear photometric range; a sensitivity analysis (Section 4.6) confirmed that excluding these wavelengths left the rank order of the formulations and the saturation plateau unchanged, but the affected readings should nonetheless be interpreted with due caution. Fifth, rheology relied on single-point rotational viscometry with rotational speed as a shear-rate proxy; oscillatory and yield-stress rheology using a defined shear-rate geometry were not performed. Sixth, emulsion type was confirmed qualitatively (conductivity, dye staining, microscopy); quantitative droplet-size distribution and optimization of the homogenization parameters were not recorded and remain to be characterized. Finally, the stability data (six freeze–thaw cycles and 90-day pH monitoring) support short-term physical screening rather than a full chemical shelf-life evaluation. Each of these limitations bears directly on the interpretation offered above: the nominal 20% cream is described only as a provisional preferred candidate because benchmark-controlled, chemically standardized, and in vivo data are not yet available. These points therefore qualify the conclusions and define the next stages of development rather than detracting from the present physicochemical characterization.
5.2. Conclusions
Topical O/W emulsions loaded with milk thistle (Silybum marianum) seed extract were prepared and characterized with full replication and statistical analysis. All formulations showed sound short-term physical robustness under thermal cycling, a pH compatible with topical use, and reductions in apparent viscosity with increasing rotational speed consistent with pseudoplastic behavior. Based on the Mansur-derived in vitro SPF screening data (obtained without an extract-free vehicle or a reference sunscreen run in parallel), the nominal 20% (actual 16.7% w/w) cream is presented only as a provisional preferred candidate for further formulation optimization, not as a proven optimum, combining an estimated SPF of 15.92 ± 0.20 with good physical behavior. Because these findings are preliminary and in vitro, they cannot support any product-level or clinical photoprotection claim; confirmation will require chemical (e.g., HPLC) standardization of the extract, vehicle- and benchmark-controlled photoprotection testing, and in vivo biological and clinical evaluation. Subject to those studies, milk thistle seed extract is a candidate botanical adjunct for cosmeceutical photoprotection and a rational starting point for encapsulation-based optimization.