1. Background
Diabetes mellitus is one of the most prevalent metabolic disorders. In the absence of timely treatment, complications such as nephropathy, neuropathy, and retinopathy can be expected. It has also been demonstrated that oxidative stress due to overproduction of reactive oxygen species (ROS) damages the antioxidant defense system in patients suffering from diabetes (1). High levels of ROS have been recognized as the main reason for inflammation, neuropathy, and nephropathy (2). Other complications of diabetes include an increased risk of cardiovascular disease (3), pancreatitis (4), infection, and decreased immunity (5). All of these outcomes affect patients’ quality of life (6).
Pena et al. confirmed that mental health and the quality of life were lower in patients with diabetes (7). Also, in another study lower mental health was diagnosed in adolescents with diabetes (8). Moreover, some studies have shown that parents of patients with diabetes had a lower quality of life and mental health (6). Lower life expectancy and high economic burden of diabetes are other factors that influence these patients’ quality of life. A previous study revealed a positive correlation between diabetic patients’ quality of life, their income, and education levels (6). Maddigan et al. also demonstrated comorbidities and socioeconomic status as two important factors in the quality of life (9).
Therefore, it was hypothesized that improvement of oxidative stress in patients with diabetes might affect their quality of life.
2. Objectives
We assessed the impact of vitamin C as a water-soluble antioxidant that has free radical scavenging properties and vitamin E as a fat-soluble antioxidant that prevents lipid peroxidation and ROS accumulation on the quality of life of patients with type 2 diabetes. We hypothesized that neutralizing free radicals might postpone short-term diabetes complications and improve patients’ quality of life.
3. Methods
This randomized single-blind placebo-controlled clinical trial was performed on 45 qualified patients with type 2 diabetes who were selected after screening 423 patients from the Diabetes Association of Shiraz, Iran. Eligible participants were non-smoker, using standard oral hypoglycemic treatment, and had no apparent vascular and chronic inflammatory diseases. On the other hand, patients who used antioxidant supplements, lipid-lowering drugs, diuretics, B-blockers, and aspirin were excluded from the study. The participants were asked to avoid any variations in their oral hypoglycemic medications as far as possible. The sample size was determined according to the study in elderly subjects with type 2 diabetes (10). A sample size of 10 patients per group was obtained with a probability of 80% at the predetermined level of α = 0.05. While considering 5 dropouts in each group, the final sample size was determined to be 15 patients per group.
All participants were informed about the study objectives and they signed the informed consent form. The procedure of this clinical trial conformed to the Declaration of Helsinki and Good Clinical Practice guidelines. It was also approved by the Ethics Committee on Human Experimentation of Shiraz University of Medical Sciences (No. 88-4600). This clinical trial was also registered in IRCT.ir (IRCT138904073236N1).
Vitamin C and E capsules were prepared by General Nutrition Center (GNC) in the U.S. and placebo capsules were prepared by Shiraz School of Pharmacy. Diabetic participants were assigned to three groups by block randomization with a fixed block size of three as follows:
Group 1: Received one vitamin E capsule, 400 IU daily for six weeks.
Group 2: Received one vitamin C capsule, 1000 mg daily for six weeks.
Group 3: Received one placebo capsule (cellulose acetate), 1000 mg daily for six weeks.
The study data were collected using the Persian version of Short-Form Health Survey-36 (SF-36) questionnaire. This questionnaire is valid to determine the quality of life in 323 diseases, including diabetes, and its validity and reliability have been evaluated and accepted in Iran. It contains eight discrete scales and two major dimensions. The eight multi-item scales include physical functioning, role limitations due to physical health, bodily pain, general health, role limitations due to emotional problems, energy/fatigue, emotional well-being, and social functioning in two dimensions of physical health (the first four scales) and mental health (the last four scales). Cronbach’s alpha for the eight areas was between 0.77 and 0.9 (11). The questions of SF-36 were scored from 0 to 100, with higher scores considered more suitable health condition. The items of SF-36 questionnaire were read out to each patient before and after the intervention in face-to-face interviews. Demographic and anthropometric data (age, sex, body mass index (BMI), and waist to hip ratio) were also recorded. Additionally, drug information and levels of fasting blood sugar, triglycerides, low-density lipoprotein (LDL), high-density lipoprotein (HDL), and total cholesterol were determined using blood samples taken on the first day of the study.
3.1. Statistical Analysis
Statistical analysis was done using SPSS, version 16 (SPSS Inc., Chicago, IL). Kolmogorov-Smirnov test was used to evaluate normal/abnormal distribution of data. Normally distributed data were compared between the three groups by One-way ANOVA test. Tamhane’s test was used as post hoc analysis method. In addition, paired t-test was used to determine changes in each study group after the intervention. P values < 0.05 were considered to be statistically significant.
4. Results
Out of 45 patients involved in this study, 1 patient in the vitamin E group, 1 patient in the vitamin C group, and 2 patients in the placebo group were excluded from the study (Figure 1). Baseline characteristics of the patients participated in different study groups are presented in Table 1. As Table 1 shows there is no significant difference between these data. No momentous side effects were detected in the study participants.
| Parameters | Groups | P Valuec | ||
|---|---|---|---|---|
| Vitamin E (N = 14) | Vitamin C (N = 14) | Placebo (N = 13) | ||
| No., female/male | 14 (11.3) | 14 (10.4) | 13 (9.4) | 0.84 |
| Age, y | 48 ± 6.28 | 47 ± 8.93 | 46.61 ± 7.58 | 0.88 |
| Duration of diabetes, y | 5.14 ± 3.82 | 4.57 ± 4.2 | 4.92 ± 4.78 | 0.93 |
| Body mass index, kg/m2 | 29.22 ± 6.62 | 26.94 ± 4.34 | 28.81 ± 4.04 | 0.47 |
| Waist to hip ratio | 0.95 ± 0.05 | 0.96 ± 0.07 | 0.97 ± 0.07 | 0.73 |
| Metformin, g/day | 1 ± 0.85 | 1.14 ± 0.63 | 0.73 ± 0.75 | 0.36 |
| Glibenclamide, mg/day | 7.5 ± 8.49 | 8.75 ± 10.59 | 9.61 ± 8.02 | 0.83 |
| FBS, mg/dL | 157.78 ± 50.21 | 131.14 ± 32.79 | 138 ± 39.92 | 0.22 |
| TG, mg/dL | 168.78 ± 66.77 | 174.85 ± 110.35 | 147.15 ± 37.38 | 0.63 |
| Total Chol, mg/dL | 208.64 ± 29.3 | 189.42 ± 38.09 | 200.15 ± 17.54 | 0.24 |
| LDL-C, mg/dL | 142.47 ± 25.33 | 135.2 ± 24.17 | 133.32 ± 15.01 | 0.21 |
| HDL-C, mg/dL | 32.41 ± 9.83 | 31.25 ± 12.69 | 37.4 ± 5.6 | 0.24 |
| Physical functioning | 61.6 ± 7.5 | 70.33 ± 6.25 | 72.84 ± 6.35 | 0.482 |
| Role limitations due to physical health | 35 ± 10.2 | 61.66 ± 10.31 | 67.30 ± 10.35 | 0.072 |
| Role limitations due to emotional problems | 26.6 ± 9.31 | 33.33 ± 10.7 | 41.02 ± 10.09 | 0.616 |
| Energy/fatigue | 42.5 ± 4.5 | 40.66 ± 5.87 | 46.15 ± 4.67 | 0.751 |
| Emotional well-being | 52.8 ± 4.83 | 38.66 ± 5.77 | 55.07 ± 4.39 | 0.057 |
| Social functioning | 50.83 ± 7.66 | 63.33 ± 5.65 | 66.34 ± 3.84 | 0.174 |
| Bodily pain | 51 ± 7.30 | 53.5 ± 9.02 | 65.19 ± 8.81 | 0.468 |
| General health | 48.33 ± 4.41 | 42.5 ± 5.11 | 56.43 ± 10.21 | 0.36 |
Abbreviations: Chol, cholesterol; FBS, fasting blood sugar; HDL, high-density lipoprotein; LDL, low-density lipoprotein; TG, triglyceride.
aValues are expressed as mean ± SD unless for No. (number of participants).
bOne-way ANOVA test was used to compare normal data.
cP ≤ 0.05 was considered significant.
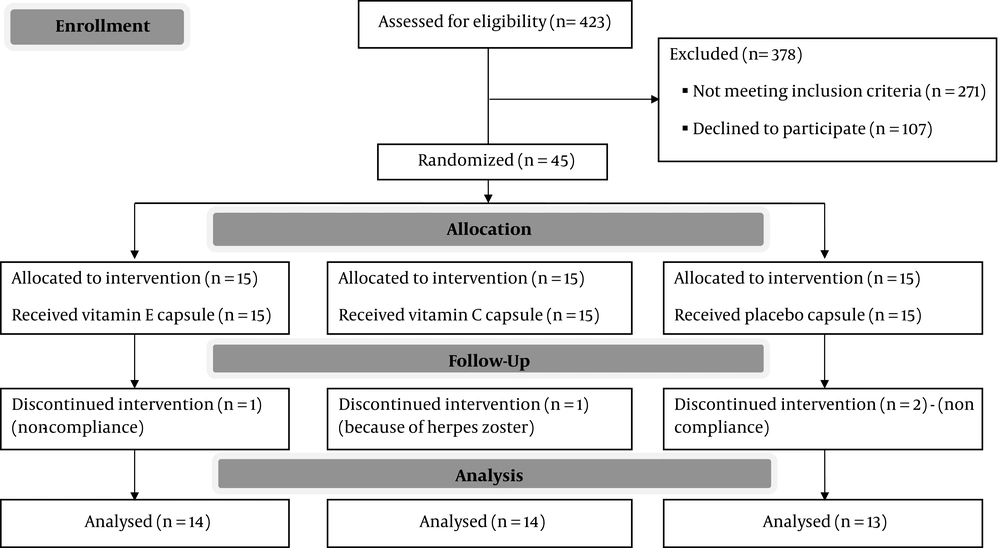
Figure 1.
Consort flow diagram of the trial is shown
The patients’ mean scores of the SF-36 questionnaire parameters before and after the intervention are presented in Table 2. The results showed a significant difference among the three groups regarding the scores of role limitations due to physical health (P = 0.02) and general health (P = 0.05). Based on the results of post hoc test, significant differences (P = 0.02) in scores of role limitations due to physical health were observed between vitamin E and vitamin C groups as well as between vitamin E and placebo groups (P = 0.05).
Table 2.
The Patients’ Parameters Scores Before and After the Interventiona
| Parameters | Vitamin E (N = 14) | Vitamin C (N = 14) | Placebo (N = 13) | P Value | ||||||
|---|---|---|---|---|---|---|---|---|---|---|
| Before | After | P Value | Before | After | P Value | Before | After | P Value | ||
| Physical functioning | 61.6 ± 7.5 | 74.2 ± 6.3 | 0.07 | 70.33 ± 6.25 | 71.07 ± 5.76 | 0.92 | 72.84 ± 6.35 | 75 ± 9.42 | 0.82 | 0.39 |
| Role limitations due to physical health | 35 ± 10.2 | 73.2 ± 8.06 | ≤ 0.0001 | 61.6 ± 10.31 | 62.5 ± 8.59 | 1 | 67.3 ± 10.35 | 71.15 ± 12.6 | 0.79 | 0.02a |
| Role limitations due to emotional problems | 26.6 ± 9.31 | 76.1 ± 7.35 | ≤ 0.0001 | 33.33 ± 10.7 | 47.6 ± 9.70 | 0.41 | 41.0 ± 10.09 | 79.48 ± 8.88 | 0.003 | 0.16 |
| Energy/fatigue | 42.5 ± 4.5 | 45 ± 6.0 | 0.38 | 40.66 ± 5.87 | 48.92 ± 4.29 | 0.20 | 46.15 ± 4.67 | 51.15 ± 4.87 | 0.35 | 0.90 |
| Emotional well-being | 52.8 ± 4.83 | 51.2 ± 6.56 | 0.85 | 38.66 ± 5.77 | 50.85 ± 5.29 | 0.09 | 55.07 ± 4.39 | 53.84 ± 5.70 | 0.68 | 0.21 |
| Social functioning | 50.83 ± 7.66 | 68.75 ± 5.03 | 0.006 | 63.33 ± 5.65 | 66.96 ± 5.33 | 0.76 | 66.34 ± 3.84 | 76.92 ± 4.66 | 0.05 | 0.18 |
| Body pain | 51 ± 7.30 | 55.17 ± 6.48 | 0.08 | 53.5 ± 9.02 | 66.96 ± 6.96 | 0.23 | 65.19 ± 8.81 | 61.73 ± 8.12 | 0.75 | 0.41 |
| General health | 48.33 ± 4.41 | 57.14 ± 5.13 | 0.02 | 42.5 ± 5.11 | 53.27 ± 5.02 | 0.02 | 56.4 ± 10.21 | 48.07 ± 5.11 | 0.38 | 0.05a |
aP ≤ 0.05 was considered significant. In order to compare data in each group, paired t-test and to compare data changes between groups, one-way ANOVA test were used.
The results of paired t-test indicated a significant increase in the scores of role limitations due to physical health (P < 0.001), role limitations due to emotional problems (P < 0.001), social functioning (P = 0.006), and general health (P = 0.02) in the vitamin E group. Also, a significant increase was observed in general health score in the vitamin C group (P = 0.02). Finally, a significant increase was found in the scores of role limitations due to emotional problems (P = 0.003) and social functioning (P = 0.05) in the placebo group.
5. Discussion
The results of the present study showed that 6-weeks supplementation with vitamin E and vitamin C improved “general health” and “role limitations due to physical health” in patients with type 2 diabetes, so it confirmed our previous hypothesis. Vitamin E supplementation improved “role limitations due to physical health”, “role limitations due to emotional problems”, “social functioning”, and “general health”. Vitamin C supplementation also had a significant effect on “general health”, but not on other aspects of the quality of life.
The quality of life is an important health outcome in any interventional study. Different complications of chronic diseases, such as short- and long-term comorbidities, affect the quality of life. Defect in the antioxidant defense system and overproduction of ROS are the main causes of these complications (12, 13). Many experimental and clinical studies have demonstrated a link between increased oxidative stress and micro- and macrovascular complications of diabetes (14, 15). In addition, a previous study showed that oxidative stress in patients with diabetes increased bone fractures and delayed their healing (14). High rates of depression, anxiety, and stress in patients with diabetes were also the results of oxidative stress status (15). All of these issues affect patients’ comfort, general well-being, and happiness.
It seems that antioxidants may improve the general well-being of patients with diabetes by neutralizing free radicals as triggers of stress-sensitive signaling pathway. Stress sensitive signaling pathway has a key role in the pathogenesis of diabetes complications (16). Recent studies indicated that vitamin E and vitamin C supplementation in patients with diabetes decreased malondialdehyde levels and increased serum glutathione levels (15-22). Indeed, Kirk et al. demonstrated that vitamin E and vitamin C supplementation reduced pain score and improved different aspects of the quality of life in patients with chronic pancreatitis (23). Rajanandh et al. also reported that vitamin E supplementation decreased pain severity and promoted the quality of life in neuropathic patients with diabetes (24). Similarly, Salehi et al. in 2012, revealed that selenium supplementation ameliorate the quality of life in hemodialysis patients (25). Overall, vitamin C and vitamin E improve oxidative stress, inflammatory response, and immune performance in the body (22, 24). These antioxidants can improve brain function and have neuroprotective properties, as well (3-5). All of these features develop the health-related quality of life.
The main limitations of the present study were the lack of vitamin E and vitamin C measurements at baseline and at the end of the trial, small sample size, and short duration of the intervention. Further studies are recommended to evaluate different biochemical parameters concurrent with quality of life to find the underlying mechanism of this supplementation in this regard.
5.1. Conclusions
The findings of the present study indicated that short-term supplementation with antioxidants, such as vitamin E and vitamin C, might be helpful in improving diabetic patients’ quality of life. However, further studies are needed to determine the exact molecular mechanisms underlying vitamin E and vitamin C therapy in general and physical health of diabetic patients.