
1. Background
Vitamin D has a vital function in the homeostasis of calcium balance and bone fitness, although the expression of the receptor of vitamin D in different human body cells and tissue indicates that vitamin D probably acts like a steroid hormone in the organs (1, 2).
The relationship between vitamin D and thyroid function was observed in previous studies. Postnatal depression (PND) is a frequent disorder after childbirth in females. A study showed that the prevalence rate of PND varied from 0.5% to 60.8% across the countries. PND is considered as a public health issue that can cause serious complications for mothers, newborns, and families (3). In nonpregnant adults, a possible association between serum 25-hydroxyvitamin D level and emotional symptoms such as nervousness, depressive disorder, and cognitive function is observed in numerous studies (4, 5). Subsequent studies evaluated the relationship between low vitamin D and PND (6).
On the other hand, a relationship between the thyroid hormones imbalance and mood disorder has been hypothesized for many years (7).
It seems interesting to explore the effectiveness of vitamin D supplements during pregnancy on maternal thyroid function and depression.
2. Objectives
Therefore, the current study aimed at assessing the effects of 2000 IU vitamin D supplementation on such variables in pregnant mothers.
3. Methods
3.1. Setting and Participants
The current randomized clinical trial was conducted from January 2014 to early December 2015 among nulliparous as well as multiparous females experiencing antenatal care in a teaching hospital in Shiraz, Iran. The inclusion criteria were: age ≥ 18 years, no history of medical problems, no dependence on any types of narcotic substances or alcohol, no gestational complications, a singleton pregnancy with live fetus, and being at the week 26 - 28 of gestation. Less than eight weeks consumption of vitamin D3 supplement led to participant exclusion.
3.2. PND Assessment Instrument
The Edinburgh postnatal depression scale (EPDS) was used to evaluate depression intensity. This scale consists of 10 multiple-choice tests, the lowest possible score is 0 and the highest possible score is 30 (8). The EPDS can be used throughout the antenatal and postnatal period (9). At baseline, the mothers with the EPDS scores of > 13 were rejected and referred to a psychologist for clinical assessment. Depression score was evaluated twice for the two study groups; at baseline and four weeks postpartum.
3.3. Lab Data
25-hydroxyvitamin D [25(OH) D], thyroid stimulating hormone (TSH), free thyroxin (FT4), and anti-thyroid peroxidase antibody (TPOAb) were measured twice; at baseline and at birth.
3.4. Design and Data Collection
The Canadian Pediatric Association suggested 2000 IU of vitamin D in pregnancy and breast-feeding period (10). Therefore, the vitamin D group received 2000 IU vitamin D3 (two 1000 IU pills) daily from the week 26 to 28 of gestation until birth. The supplements were provided by the Jalinous Pharmaceutical Company in Tehran, Iran. The control group took two tablets as placebo daily. Block randomization technique was employed as the sampling method. The study was a double-blind. The participants were not aware of the pill contents. The lab technicians and research assistant were blind to group allocations. All participating mothers could take prescribed supplements outside the study protocol.
3.5. Sample Size and Statistical Analysis
Lastly, 98 participants (out of 120) finished the study. Numerical values were compared using t-test and the Mann-Whitney U test in its right approach.
The current study obtained the ethics code (No. IR. SUMS.REC.1394.87) and a registration code in the Iranian Registry of Clinical Trial’s website (No. IRCT201508091312N2).
4. Results
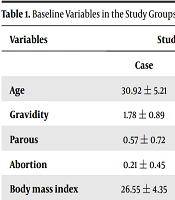
Maternal demographic characteristics, vitamin D serum levels, thyroid function data, and depression scores were compared between the two groups, as shown in Tables 1 - 3, respectively. Linear regression (backward method) did not show any significant correlation between antenatal depression score (26th - 28th week of gestation) and thyroid function parameters (TSH, FT4, and TPO). Also, no linear correlation was observed between depression score at 4th week postpartum and thyroid function parameters at birth. The correlation between vitamin D levels and thyroid function was investigated by Spearman’s coefficient. No correlation was detected between vitamin D levels and thyroid function: TSH (rho = 0.03, P = 0.65); FT4 (rho = -0.07, P = 0.31); TPO (rho = -0.08, P = 0.56).
Table 1.
Comparison of Maternal Demographic Data and Vitamin D Level in the Study Groupsa
| Variable | Vitamin D (N = 46) | Control (N = 52) | P Value |
|---|---|---|---|
| Age, y | 26.04 ± 5.07 | 26.61 ± 4.01 | 0.46 |
| BMI, kg/m2 (pre-pregnancy) | 24.17 ± 4.20 | 23.41 ± 3.75 | 0.30 |
| Gestational age, d | 273.26 ± 8.94 | 275.28 ± 7.29 | 0.22 |
| Baseline 25 (OH) D, ng/mL | 11.94 ± 5.47 | 13.34 ± 8.82 | 0.34b |
| Birth 25(OH)D, ng/mL | 18.43 ± 10.22 | 13.11 ± 6.26 | 0.005b,c |
| Change in 25(OH) D, ng/mL | 5.92 ± 12.05 | -1.10± 9.98 | 0.008b,c |
| Parity, No. (%) | 0.25 | ||
| Nullipara | 23 (50) | 32 (61.5) | |
| Multipara | 23 (50) | 20 (38.5) |
aValues are expressed as mean ± SD unless otherwise indicated.
bThe Mann-Whitney U test.
cP < 0.05: Significantly different compared with the baseline.
Table 2.
Baseline and Birth Serum Levels of TSH, TF4, and TPOAb in the Study Groupsa
| Variable | At Baseline (N = 46) | At Birth (N = 52) | P Value |
|---|---|---|---|
| TSH | |||
| Vitamin D | 2.74 ± 3.06 | 3.78 ± 5.91 | 0.11 |
| Control | 2.38 ± 2.42 | 3.69 ± 3.62 | 0.001c |
| P valueb | 0.49 | 0.15 | |
| FT4 | |||
| Vitamin D | 10.37 ± 2.59 | 9.50 ± 2.78 | 0.04c |
| Control | 10.08 ± 2.23 | 9.81 ± 3.02 | 0.55 |
| P valueb | 0.53 ± 0.69 | 0.62 | |
| TPOAb | |||
| Vitamin D | 38.26 ± 145.02 | 23.42 ± 73.86 | 0.04c |
| Control | 29.50 ± 87.63 | 24.65 ± 73.76 | 0.008c |
| P valueb | 1.00 | 0.38 |
aValues are expressed as mean ± SD.
bThe Mann-Whitney U test.
cP < 0.05: Significantly different compared with the baseline.
Table 3.
Depression Scores at Baseline and 4th Week Postnatal in the Study Groupsa
| Variable | Baseline (N = 46) | 4th Week (N = 52) | P Value |
|---|---|---|---|
| Depression | |||
| Vitamin D | 8.52 ± 3.61 | 4.48 ± 3.30 | 0.000b |
| Control | 8.00 ± 3.69 | 7.07 ± 4.52 | 0.15 |
| P valuec | 0.47 | 0.002b |
aValues are expressed as mean ± SD.
bP < 0.05: Significantly different compared with the baseline and control group.
cThe Mann-Whitney U test.
5. Discussion
Some studies detected an association between serum levels of vitamin D and thyroid disturbances (11). In contrast, in the current study, no correlation was observed between vitamin D level and thyroid function (TSH, FT4, and TPOAb levels) at baseline. Also, after intervention, no significant differences were observed between the subjects receiving vitamin D supplement and the ones receiving placebo concerning TSH, FT4, and TPO levels.
On the other hand, depression scores at 4th week postpartum were significantly lower in the vitamin D group than those of the placebo group. Therefore, vitamin D consumption during pregnancy may be effective to relive symptoms of PND. In line with the current study, previous clinical trials in nonpregnant females showed positive effects of vitamin D on mental status (12, 13). Recent studies considering the relationship between thyroid function and PND show contradictory results. For example, thyroid hormones and TPOAb at 48 hours after birth could not predict PND in a study in Spain (14); in a study by Kuijpens et al. mothers with positive TPOAb during pregnancy were at risk for depression at 4 and 12 weeks postpartum (15). The current study results suggested that the role of vitamin D in decreasing depression score was independent of thyroid function. However, there are other ways that vitamin D can influence brain function. The presence of 1,25(OH)2D (the active form of vitamin D) receptor in the brain provokes a direct effect (16). Also, vitamin D may take action as an anti-inflammatory mediator in the brain by reducing the production of risky pro-inflammatory cytokines (17).