
1. Background
Gestational diabetes mellitus (GDM) is known as glucose intolerance starting or being diagnosed during pregnancy (1). It occurs in 4.9 to 6.9% of pregnancies (2). Diabetes and pregnancy are deeply correlated, affecting the mother’s health (3).
Vitamin D has significant effects on the health of the mother and fetus (4). It regulates mineral homeostasis of calcium and phosphorus (5), adjusts the transfer of calcium through the placenta, stimulates immunological and anti-microbial activities (6), and affects the fetus’s brain development, childhood diseases, and psychological health during adulthood (7, 8). Vitamin D deficiency may lead to different pregnancy complications such as insulin resistance and GDM (9-11), hypertension and preeclampsia (12, 13), bacterial vaginosis, and cesarean section (14). Fetal complications include the loss of bone density and growth delay (15), preterm birth, low birth weight, neonatal respiratory infections, higher rates of human immunodeficiency virus transmission (16), asthma, eczema (17), osteoporosis, type I diabetes (18), autism (19), multiple sclerosis (20), and some autoimmune diseases in adults (4-11, 13, 21-26).
Many studies have shown the association between vitamin D deficiency and impaired glucose metabolism (27). Vitamin D can have a major role in insulin secretion and function (28) and GDM occurrence (29). There is a vivid reverse relationship between serum vitamin D levels and GDM (9, 12-20, 27, 28, 30, 31) so that women with vitamin D deficiency in early pregnancy have 3.7 times more risk of GDM than women with normal levels (11). Despite a large number of studies on vitamin D deficiency in pregnancy, there are a few studies on pregnant women to evaluate the effect of vitamin D supplementation on GDM. Until now, the normal range of vitamin D in pregnancy is unknown and its safe, effective dose for mothers and fetuses is under investigation (22, 32-36).
2. Objectives
The study aimed to evaluate the effect of high-dose vitamin D supplementation on compensation for vitamin D deficiency in pregnancy and the occurrence of GDM.
3. Methods
This randomized clinical trial was conducted at Amiralmomenin Hospital in Semnan, Iran, in 2014 (RCT registration code: IRCT2015022714275M2 and Research Ethics certificate approval ID: IR.SEMUMS.REC.1398.107). The inclusion criteria included 16-35-years-old pregnant women, gestational age (GA) of 8 to 12 weeks based on the last menstrual period or sonography, singleton pregnancy, body mass index (BMI) < 30 in the first prenatal visit, fasting blood sugar (FBS) ≤ 92, and vitamin D serum levels of < 32 ng/mL. In this study, vitamin D levels of ≤ 10 ng/mL were considered as severely deficient, 10 - 32 ng/mL as inadequate, and 32 - 100 as normal. The values of above 100 were conservatively considered as toxic values (37). The exclusion criteria included known metabolic and malabsorption diseases, GDM history, persistent glucosuria, parathyroid diseases, untreated thyroid or other endocrinologic complications, known hepatic and renal problems, history of polyhydramnios, macrosomia (> 4 kg), malformation, stillbirth, smoking, and the use of anti-epileptics, corticosteroids, and other drugs that might influence calcium and vitamin D metabolism. We measured FBS with an in-vitro enzymatic assay kit (GOD-PAPkit by Parsazmun Company, Tehran, Iran) and serum levels of 25-hydroxyvitamin D by ELISA. By setting the vitamin D deficiency correction at 20% as the primary outcome (21) and the power and confidence level at 80% and 95%, respectively, and considering the percentage of lost-to-follow-up of 12%, the sample size was determined as 180 women.
After obtaining written informed consent, we randomized participants into control and intervention groups of 90 using permuted block random allocation. During the 14th to 16th weeks of pregnancy, participants received a multi-prenatal pill of 400 IU of vitamin D. A 50,000 IU vitamin D pearl was also given to the intervention group once every two weeks (a total of six pearls). If the intervention group members forgot to take any dosages of pearls, they had to take it immediately and if they missed two consecutive doses, they would be excluded. The symptoms of vitamin D toxicity were described to the patients.
We measured serum vitamin D levels during 24th-26th gestational weeks and performed the Oral Glucose Tolerance test (OGTT) with 75 grams of glucose. FBS ≤ 92, or blood sugar ≤ 180 one hour after taking 75 grams of glucose, or blood sugar ≤ 153 two hours after taking 75 grams of glucose were the criteria of GDM, only one of which was sufficient for diagnosis. In the presence of GDM or abnormal vitamin D levels, we referred patients to an endocrinologist for further treatment. The safety of the intervention was defined based on the serum level of vitamin D and not exceeding the normal range.
The frequency (%) was reported for categorical variables and to evaluate their relationships with groups, the chi-square test was applied. For quantitative variables, median and inter-quartile range (IQR) were reported while the Mann-Whitney U test was used to compare the groups before and after the intervention. For further clarification, the mean and standard deviation (SD) were reported for vitamin D and FBS levels. We used SPSS v.16 for all analyses and the P value below 0.05 was considered significant.
4. Results
Among 345 women, 180 with eligibility criteria were randomly allocated to equal control and intervention groups. Two cases of control and three cases of intervention were excluded from the study. Finally, the data of 175 participants (87 in the intervention group and 88 in the control group) were analyzed (Figure 1).
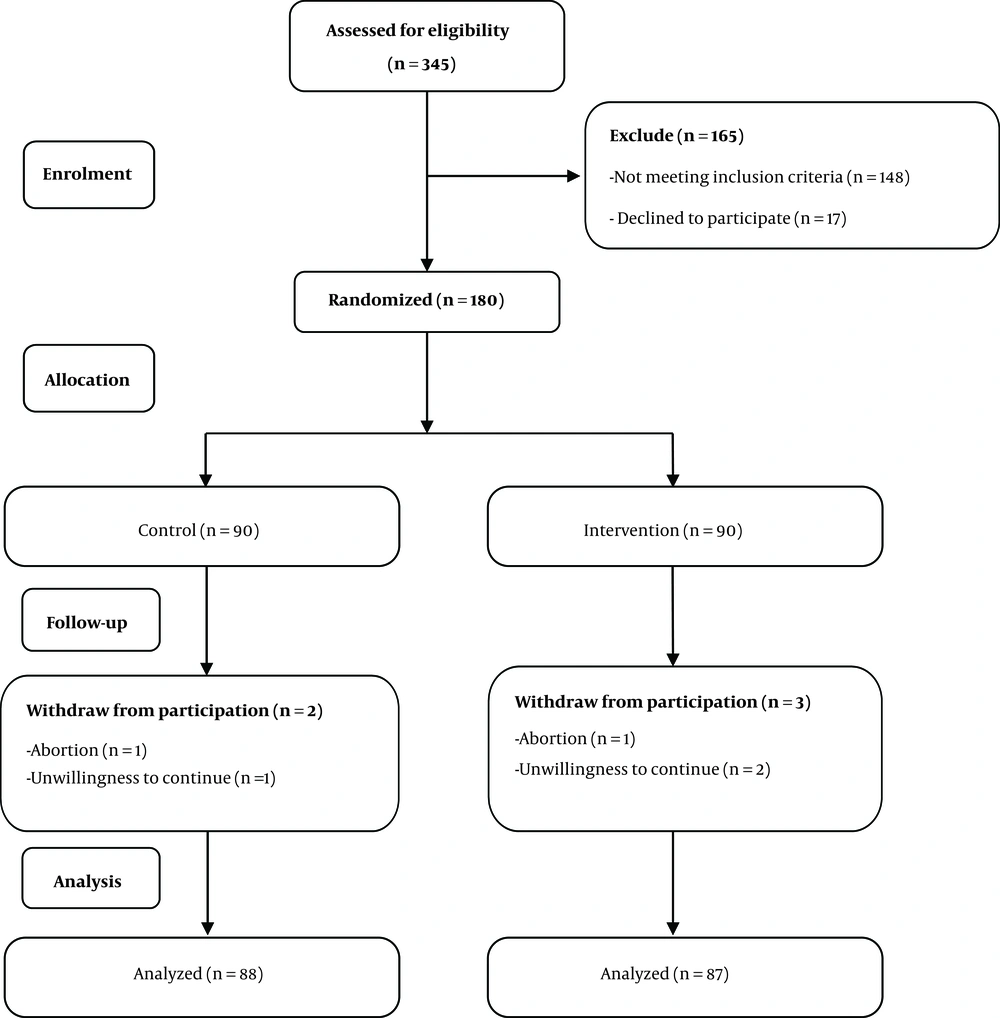
Figure 1.
Fellow diagram of participants in the intervention and control groups from enrollment to analysis
The median (IQR) of age was 28 (6) and 27 (5.7) in the control and intervention groups, respectively. There was no significant difference in age (P = 0.206), BMI (P = 0.232), and obstetrical characteristics (P > 0.05) between the two groups (Table 1).
Table 1.
Baseline Characteristics of Participantsa
| Characteristics | Intervention (N = 87) | Control (N = 88) | P Valueb |
|---|---|---|---|
| Age | 28 (6) | 27 (5.8) | 0.206 |
| Body mass Index | 26 (5) | 24 (4.9) | 0.232 |
| Parity | 1 (1) | 1 (1) | 0.820 |
| Gravidity | 0 (1) | 0 (1) | 0.982 |
| Living child | 0 (1) | 0 (1) | 0.979 |
| Stillbirth | 0 (0) | 0 (0) | 0.994 |
| Abortion | 0 (0) | 0 (0) | 0.507 |
| Fasting blood sugar, mg/mL | 83 (11) | 82 (10) | 0.516 |
| Serum vitamin D | 14 (15.1) | 17 (12.2) | 0.728 |
Abbreviation: IQR, inter-quartile range.
aValues are expressed as median (inter-quartile range).
bMann-Whitney U Test.
The mean and SD in the two groups were 82.5 ± 6.7 mg/dL and 81.3 ± 8.15 mg/dL for FBS and 14 ± 8.8 ng/mL and 15.3 ± 7.6 ng/mL for vitamin D. There was no significant difference in FBS (P = 0.516) and vitamin D (P = 0.728) before the intervention. Initially, 27 cases of intervention and 24 cases of control had severe vitamin D deficiency (P = 0.652) (Table 2).
Table 2.
Serum Level of Vitamin Da
| Level, ng/mL | Before | P Value | After | P Valueb | ||
|---|---|---|---|---|---|---|
| Intervention | Control | Intervention | Control | |||
| Normal (> 32) | 0 (0.0) | 0 (0.0) | 0.652 | 85 (97.7) | 0 (0.0) | < 0.001 |
| Insufficient (10 - 32) | 61 (69.3) | 63 (72.4) | 2 (2.3) | 69 (81.2) | ||
| Sever deficient (< 10) | 27 (30.7) | 24 (27.6) | 0 (0.0) | 16 (18.8) | ||
aValues are expressed as No. (%).
bPearson chi-square test.
After the intervention, the mean and SD of vitamin D level in the intervention and control groups were 66.9 ± 21 ng/mL and 16.6 ± 6.77 ng/mL, respectively. There was a significant increase in the level of vitamin D after the intervention (P < 0.001). There were no significant differences between the two groups at the 24th - 26th gestational weeks in FBS (P = 0.162), one-hour OGTT (P = 0.996), and two-hour OGTT (P = 0.154) (Table 3).
Table 3.
Serum Vitamin D (ng/mL) and Blood Sugar (mg/mL) of Participantsa
| Characteristics | Intervention (N = 87) | Control (N = 88) | P Valueb |
|---|---|---|---|
| Serum vitamin D | 66 (35.8) | 17 (9.1) | < 0.001 |
| Change in serum vitamin D | 47 (29) | 0.3 (8.9) | < 0.001 |
| FBS | 81 (10) | 78 (10) | 0.162 |
| BS (1-h) | 125 (35) | 125 (39) | 0.996 |
| BS (2-h) | 109 (33) | 104 (26.5) | 0.154 |
Abbreviations: BS, blood sugar; FBS, fasting blood sugar; IQR, inter-quartile range.
aValues are expressed as median (IQR).
bMann-Whitney U Test.
The level of vitamin D reached the normal range in 97.7% of the intervention group and there was no severe deficiency in the remnants. It did not reach the toxic serum level in any of the participants. Twelve (13.6%) in the control group and eight (9.2%) in the intervention group developed GDM. Although the incidence of GDM was lower in the intervention group, there was no statistically significant difference (P = 0.356).
5. Discussion
Recently due to the high prevalence of vitamin D deficiency, lots of studies were carried out on the issue (24, 26, 38). However, studies on pregnant women are quite limited. The normal range of vitamin D in pregnant women is still in the process of research (22, 34, 39). Our study showed that the use of 50,000 IU vitamin D once every two weeks up to six doses led to a range of 32 - 100 ng/mL in 98% of vitamin D deficient pregnant women. In women who used 400 IU vitamin D daily, the vitamin D level remained in the range of deficiency. Since none of the participants reached the toxic levels, the intervention was considered to be safe. The number of cases with severe deficiency decreased from 27.6% to 18.8%. However, it was not statistically significant. The administration of 50,000 IU vitamin D once every two weeks led the average 47 ng/mL rise in vitamin D serum levels while 400 IU daily led to only 0.30 ng/mL rise.
Yap et al. (39) showed that the serum levels of 90% of the daily users of 5,000 IU and 66% of the daily users of 400 IU of vitamin D reached > 20 ng/mL. Nevertheless, in their study, 10% of the cases remained deficient. This is while in our study, only 2% of the intervention group was diagnosed with deficiency after treatment and none of them was severely deficient. The lack of cooperation in daily supplementation versus weekly supplementation may be the cause of this result. Asemi et al. (40, 41) showed that supplementation with 400 IU daily after 25 weeks led to the rise of serum levels but half of the cases remained below 20 ng/mL. In another study, supplementation with two doses of 50,000 units every three weeks in diabetic pregnant women, without considering the primary level, led to a significant rise of serum vitamin D levels (41).
In Soheilikhah et al. (42) study, just 50,000 IU every two weeks led to the normal serum levels in severe vitamin D deficient pregnant women while 200 IU daily did not compensate for the deficiency. Because of the fat solubility of vitamin D, daily or weekly doses have the same effect (43). Due to the compliance, we propose 50,000 IU of vitamin D once every two weeks for vitamin D deficient pregnant women. The recommended 400 IU daily dose of vitamin D in pregnancy (44) can only be used for prevention and cannot compensate for the deficiency.
Although the compensation for vitamin D deficiency reduced the rate of GDM from 13.6% to 9.2%, this difference was not statistically significant (P = 0.356). Several studies showed lower vitamin D levels in diabetic pregnant women (9, 11, 45). Zang et al. (11) concluded that women with vitamin D deficiency in early pregnancy were 3.7 times more likely to have GDM. Poel et al. (30) meta-analysis demonstrated that although its serum levels had a wide spectrum (6.6 - 39.7 ng/mL), pregnant women who had lower serum levels of vitamin D had a high likelihood of GDM.
Several studies have recently been done on pregnant women to investigate the effect of different doses of vitamin D supplementation on glycemic indices (40-42, 44, 46). In some studies, the use of vitamin D in GDM with/without vitamin D normal serum levels improved the function of pancreatic beta cells and decreased serum insulin, insulin resistance, and FBS. Soheilykhah et al. (42) studied 120 pregnant women below 12 weeks with severe vitamin D deficiency in three groups: A, 200 IU daily; B, 50,000 IU monthly; and C, 50,000 IU once every two weeks. They showed improvement in insulin resistance in all participants but it was significant in group C compared to group A. They showed no improvement in FBS. Hosseinzadeh-Shamsi-Anar et al. (46) showed that a single 300,000 IU dose of intramuscular vitamin D led to the rise of vitamin D serum levels but it did not have any effect on HbA1c. In our study, although the FBS values of both groups decreased, it was not statistically significant (P = 0.162).
Some studies (40, 44, 46) showed that vitamin D supplementation could normalize glycemic indices only in cases with diabetes risk factors or the ones who already suffered from it. Our study and Yap et al. (39) study showed that vitamin D supplementation might not influence the GDM incidence. The contradictory results of our study and the studies mentioned above may be due to the elimination of the cases with diabetes risk factors.
The main limitation of the present study was inadequate power due to the low sample size (calculated power = 0.16). Considering our results, with a statistical power of 0.80, at least two groups of 700 cases are required.
5.1. Conclusions
High-dose vitamin D supplementation in vitamin D deficient pregnant women (50,000 IU every two weeks from 14 - 16 weeks) could efficiently restore vitamin D deficiency. However, there is not enough evidence to suggest it as a preventive measure for GDM.