
1. Background
Systemic sclerosis (SSc) is a heterogeneous autoimmune disease affecting connective tissues. Vasculopathy, inflammation, excessive collagen formation, and fibrosis are significant complications observed in SSc (1, 2). Interstitial lung disease (ILD) and pulmonary hypertension (PH) are critical complications of SSc and remain major causes of morbidity and mortality. The pathogenesis of ILD is not well-clarified. Due to vascular injury, consequent inflammation, and immunologic response, a large number of fibroblasts are produced. Fibroblasts, along with other factors including pro-inflammatory cytokines and transforming growth factors, are responsible for fibrosis (3, 4).
Pulmonary hypertension, another complication of SSc, is defined by a mean pulmonary arterial pressure (PAP) of > 25 mmHg with a pulmonary capillary wedge pressure (PCWP) < 15 mmHg on right heart catheterization (RHC). According to the World Health Organization (WHO) classification, there are five groups for PH based on etiology. Group 1 PH is frequently seen in patients with SSc (5, 6). Given the lack of specific signs and symptoms of PH, it is recommended that all patients with SSc be evaluated for PH. Phosphodiesterase-5 (PDE-5) inhibitors such as sildenafil and tadalafil, calcium channel blockers, endothelin receptor antagonists, and prostacyclin analogs are widely used for PH management (7). Among these, PDE-5 inhibitors, which are well-known drugs for erectile dysfunction, are often considered beneficial agents for PH. Importantly, they typically lack serious safety concerns (8, 9). Phosphodiesterase-5 inhibitors are associated with notable vasodilatory effects in PAP. Additionally, some studies have provided evidence for their anti-inflammatory and anti-fibrotic properties (10).
2. Objectives
In contrast to PH, the efficacy of tadalafil in ILD remains unknown, and current data are not conclusive. This was the purpose of our study. The present trial was designed to compare the efficacy of oral tadalafil in ILD patients with and without PH.
3. Methods
3.1. Study Design
This parallel-group, non-randomized, single-center clinical trial was conducted at Masih-Daneshvari Hospital, Tehran, Iran. Thirty-four patients aged 18 to 75 years with a diagnosis of SSc, according to the American College of Rheumatology classification criteria, were included (11). Pulmonary hypertension was diagnosed using echocardiography. CT imaging of the chest and common pulmonary function tests, including body box test, diffusing capacity for carbon monoxide (DLCO), total lung capacity (TLC), and spirometry, were used for ILD diagnosis. Patients with ILD-PH (WHO classes 2 and 3) were assigned to group A, and subjects with ILD were assigned to group B. Study subjects in both groups were initially administered 20 mg of oral tadalafil (Adcirca®, Lilly, USA) once daily for 2 weeks. After an initial evaluation of safety, the dose was titrated to 40 mg/day. The duration of treatment was 6 months. The study was approved by the local Ethics Committee, and written consent was obtained from patients prior to participation. The clinical trial registry number was IRCT20190202042598N1. Patients were excluded if they had a history of nitrates and endothelin antagonists use, chronic obstructive pulmonary disease, idiopathic PH, history of PDE-5 inhibitors use, diabetes mellitus, essential hypertension, coronary artery disease, renal failure, malignancies, history of hypersensitivity to drugs, or any autoimmune diseases associated with SSc. Patients were discontinued from the study for the following reasons: Safety concerns, loss to follow-up, or voluntary discontinuation.
3.2. Assessment of Response
Spirometry, the 6-minute walk test (6MWT), DLCO, TLC, and echocardiography were used for response assessment at month 6. The collected parameters were compared with baseline values. Spirometry was performed using the Spirolab III® (MIR, Italy) according to standard guidelines. Diffusion lung capacity for carbon monoxide was measured using the Pulmo Lab 501 (Morgan Medical, USA) by the single-breath method, following European Respiratory Society guidelines. The TLC was measured using a body box. For the 6-minute walk test (6MWT), the 6-minute walk distance (6MWD) was recorded at baseline and at 6 months. Changes in forced vital capacity (FVC) over 6 months were the primary endpoints. Changes in DLCO and the number of adverse effects of the treatment were the secondary endpoints of the trial.
3.3. Assessment of Safety
Patients were evaluated monthly for myalgia, hypotension, visual defects, and hearing loss. Additionally, renal and hepatic functions were monitored monthly. Included patients were instructed to contact the study staff in the event of any possible side effects. Drugs with potential effects on hepatic cytochromes, including itraconazole, ketoconazole, clarithromycin, erythromycin, chloramphenicol, and antivirals such as lopinavir, were contraindicated for study subjects.
3.4. Statistical Analysis
Continuous variables were expressed as mean (SD) or median and interquartile range (IQR). A significance level (P-value) of less than 0.05 was considered significant. The total number of 45 patients was calculated for randomization based on the assumption of a 20% dropout rate among study patients, with an 80% power and an anticipated effect size of 0.1. To test differences and proportions between the two groups, the chi-square (χ2) test and Fisher’s exact test were used. The Shapiro-Wilk test was used to check the normal distribution of data. The Wilcoxon signed-rank test was used for comparing means. Subgroup analysis was performed using Mantel-Haenszel (MH) chi-square tests. SPSS software version 21.0 (Chicago, USA) was used for data analysis.
4. Results
4.1. Baseline Characteristics
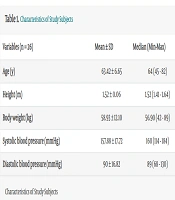
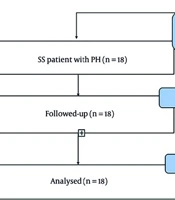
Of the 38 patients, 4 did not complete the study (1 met the exclusion criteria, and 3 did not use the drugs). Figure 1 shows the flow diagram of included patients. Clinical characteristics of the 34 study subjects are shown in Table 1. The mean age was 49.7 ± 11.1 years in group A and 48.9 ± 9.9 years in group B. Females comprised 76% of the study patients. At baseline, FVC was 67.3 ± 14.2% of the predicted value in group A and 77.2 ± 16.7% of the predicted value in group B. No significant differences were noted in baseline characteristics. All patients were asked to discontinue similar medications 2 months before the initiation of the trial. The mean number of days since the last treatment was 61 days in group A and 63 days in group B.
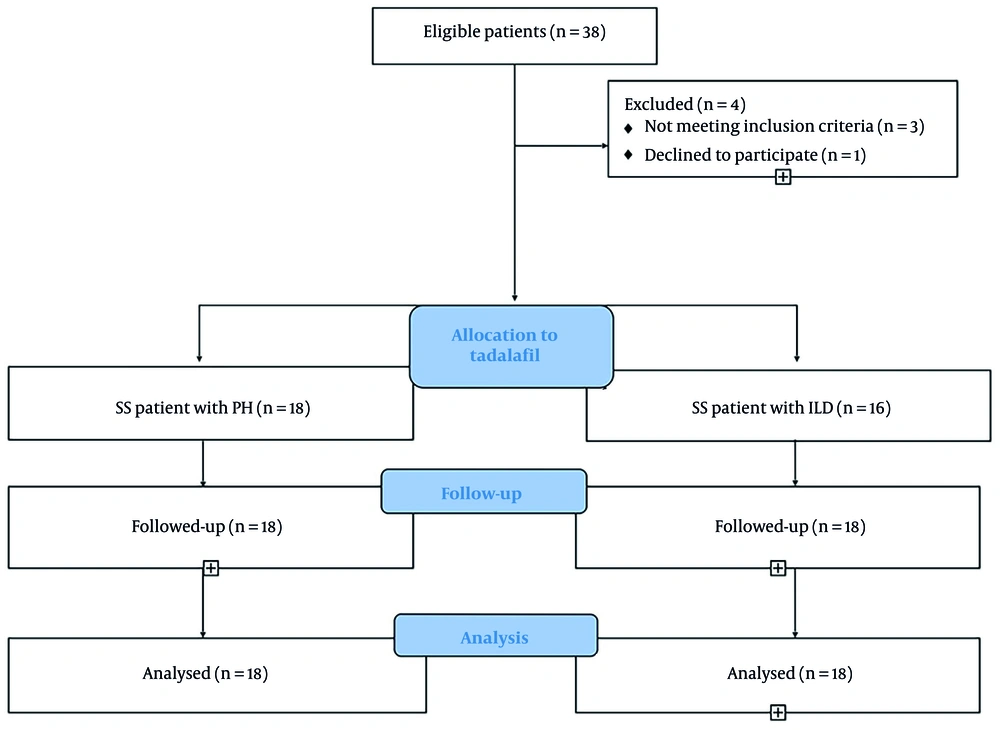
Figure 1.
Consort diagram detailing study subjects
Table 1.
Characteristics of Participants at Baseline a
| Characteristics | ILD-PH (n = 18) | ILD (n = 16) | P-Value |
|---|---|---|---|
| Age (y) | 49.7 ± 11.1 | 48.9 ± 9.9 | 0.3 |
| Age (range) | 39 - 70 | 41 - 75 | 0.2 |
| Female | 11 (78) | 12 (75) | 0.2 |
| Male | 7 (22) | 4 (25) | 0.8 |
| LV ejection fraction (%) | 59.8 ± 6.1 | 60.7 ± 7.5 | 0.6 |
| Hemoglobin (g/L) | 100 ± 8.6 | 99 ± 8.8 | 0.2 |
| Total WBC count (109/L) | 7.8 ± 5.24 | 7.5 ± 3.1 | 0.5 |
| Medical history | |||
| Sedatives | 3 (16) | 2 (12) | 0.3 |
| Anti-depressants | 2 (11) | 2 (12) | 0.2 |
| Oral contraceptives | 5 (26) | 4 (25) | 0.6 |
| Supplements | 8 (44.4) | 6 (37) | 0.7 |
| Pirfenidone | 9 (50) | 11 (68.7) | 0.5 |
| Aerosols | 10 (55.5) | 10 (62.5) | 0.2 |
| Pantoprazole | 11 (61) | 12 (75) | 0.7 |
| Prednisolone | 8 (44.4) | 10 (62.5) | 0.2 |
Abbreviations: ILD, interstitial lung disease; PH, pulmonary hypertension.
a Values are expressed as mean ± SD or No. (%) unless otherwise indicated.
4.2. Efficacy Measures
As presented in Table 2, the baseline median (IQR) FVC was 67.2 (59.4 - 78.8) % of the predicted value in group A and 68.4 (60.2 - 78.3) % of the predicted value in group B. All study patients completed the treatments. Compared to baseline, tadalafil therapy had no significant effect on FVC over the course of 6 months (P > 0.05). As shown in Table 2, spirometry parameters showed no significant improvement after 6 months of follow-up in both study groups. Additionally, there were no significant differences between groups in forced expiratory volume in 1 second (FEV1) and FEV1/FVC values (P > 0.05). After 6 months, no significant difference was noted in DLCO between study groups. There was a slight increase in median (IQR) DLCO in group A [(from 69.3 (54.2 - 81.3) to 70.31 (66.2 - 77.3), and a slight decline in group B [rom 68.4 (60.2 - 78.3) to 67.1 (65.2 - 81.3)] after 6 months of follow-up.
Table 2.
Changes in Outcomes Before and After 6 Months of Treatment with Tadalafil a
| Characteristics | Group A; ILD - PH (N = 18) | Group B; ILD (N = 16) | P (Within Group) | P (Between Group) |
|---|---|---|---|---|
| DLCO (%) | > 0.5 | > 0.5 | ||
| Before | 69.3 (54.2 - 81.3) | 68.4 (60.2 - 78.3) | ||
| After | 70.31 (66.2 - 77.3) | 67.1 (65.2 - 81.3) | ||
| FEV1 (%) | > 0.5 | > 0.5 | ||
| Before | 77.2 (69.2 - 79.8) | 78.8 (70.2 - 80.8) | ||
| After | 78.2 (65.2 - 79.8) | 79.2 (69.2 - 81.2) | ||
| FVC (%) | > 0.5 | > 0.5 | ||
| Before | 67.2 (59.4 - 78.8) | 66.7(59.4 - 71.3) | ||
| After | 68.9 (60.4 - 77.8) | 66.9 (59.1 - 72.8) | ||
| FEV1/FVC | > 0.5 | > 0.5 | ||
| Before | (85.4 - 92.9) | 91.9 (84.7 - 93.9) | ||
| After | 89.8 (88.4 - 91.9) | 89.1 (85.4 - 91.9) | ||
| TLC (mL) | > 0.5 | 0.002 | ||
| Before | 76.3 (69.4 - 78.8) | 77.1 (75.2 - 80.5) | ||
| After | 77.1 (70.2 - 80.1) | 86.2 (86.3 - 93.1) | ||
| RV (mL) | > 0.5 | 0.02 | ||
| Before | 80.2 (55.2 - 82.8) | 77.1 (75.2 - 80.5) | ||
| After | 83.1 (79.1 - 85.2) | 90.2 (86.3 - 93.1) | ||
| 6MWD (m) | > 0.5 | > 0.5 | ||
| Before | 288.2 (276 - 312) | 279.4 (276 - 319) | ||
| After | 299.1 (272 - 319) | 301.1 (288 - 311) | ||
| O2Sat (%) | > 0.5 | > 0.5 | ||
| Before | 80.1 (77.5 - 84.4) | 81.2 (80.1 - 85.4) | ||
| After | 84.2 (79.2 - 86.2) | 85.2 (77.2 - 86.2) | ||
| PAP (mm/Hg) | > 0.5 | > 0.5 | ||
| Before | 36.4 (31 - 43) | 36.4 (31 - 39) | ||
| After | 36.9 (32 - 39) | 37.9 (33 - 36) |
Abbreviations: ILD, interstitial lung disease; PH, pulmonary hypertension; FVC, forced vital capacity; TLC, total lung capacity; DLCO, diffusion lung capacity for carbon monoxide; RV, residual volume; 6MWD, 6-minute walk distance; PAP, pulmonary artery pressure.
a Values are expressed as median (IQR).
A significant difference was noted in median (IQR) TLC after 6 months of treatment [77.1 (70.2 - 80.1) mL in group A versus 86.2 (86.3 - 93.1) mL in group B, P = 0.002]. Moreover, there was a significant difference in median (IQR) RV between the two study groups after 6 months [83.1 (79.1 - 85.2) mL in group A versus 90.2 (86.3 - 93.1) mL in group B, P = 0.02]. No significant differences were observed in pulmonary arterial pressure (PAP) at baseline and at 6 months. Finally, as shown in Table 2, no significant differences were observed in the 6MWD between group A and group B.
Additionally, analysis of data stratified by age and sex indicated that the rate of response failed to reach a significant difference in patients aged > 40 years (P = 0.8) in either group A or group B. Similarly, there was no significant difference in the rate of response between females and males in both study groups (P = 0.4).
4.3. Safety Measures
In group A, 3 patients (16%) exhibited mild respiratory symptoms (sneezing and sore throat), and 4 patients (22%) experienced mild gastrointestinal (GI) upset (nausea and vomiting). In group B, 3 patients (19%) had mild GI upset, 2 patients (12%) experienced transient visual disturbances, and 1 patient (6%) developed mild tinnitus. Moreover, there was no significant difference in the rate of side effects among patients aged > 40 years (P = 0.09). No patient died, and no patient was withdrawn due to untoward effects of the treatments.
5. Discussion
This study primarily focused on assessing alterations in respiratory and structural features following the administration of tadalafil in patients with ILD-PH and ILD. It is worth mentioning that the clinical paradigm of ILD among SSc patients could garner increased attention. Although tadalafil may exhibit considerable effects targeting PH in ILD patients, the therapeutic outcomes related to ILD and the pathophysiology of pulmonary fibrosis remain unclear. In summary, our results indicated no significant differences between study groups regarding their baseline demographic and respiratory characteristics. A multivariable overview also noted that our study subjects were homogeneous based on age, sex, and past medication history. The 6-month follow-up revealed no significant changes in FVC, FEV1, FEV1/FVC, DLCO, and 6MWT. However, TLC and RV were significantly improved after treatment in SSc patients with ILD compared to those with PH.
Tadalafil is a member of the phosphodiesterase 5 inhibitor family, known for its efficacy against PH due to its vasodilatory effects. The efficacy, healing rate, and safety of tadalafil targeting either primary or secondary PH have been well discussed (5). Considering the baseline characteristics of the participants, although this study indicated no significant differences in age and sex between patients with PH and those with isolated ILD, Mathai et al. suggested that the responsiveness of PH to tadalafil relies on age, sex, primary functional capacities, and PH etiology. Future research should clarify the possible presence of dependency factors underlying this issue (12).
The initial application of tadalafil revealed that not only did TLC and RV undergo considerable enhancement in patients with pulmonary fibrosis, but its safety and tolerance were also well-established (5, 6). Zimmermann et al. suggested that while the administration of tadalafil in patients with PH secondary to ILD could not enhance 6MWD, the hemodynamic and arterial wedge pressure status could reach a more optimistic state (13). Interestingly, Parida et al. observed that six months of tadalafil treatment, despite FVC, 6MWT, and DLCO, could elevate TLC levels in SSc patients with ILD and pulmonary fibrosis compared to the placebo-treated group (14).
In contrast, Hassoun et al. included SSc patients with associated PH and designed a 36-week prospective combination therapy using tadalafil and ambrisentan. This combined therapy improved cardiac and hemodynamic values, including RV structure and function, pro-BNP, and arterial resistance in SSc patients with PH. This could be possibly related to the absence of analytic judgment according to combination therapy and monotherapy in our study (15). Furthermore, Coghlan et al. investigated the efficacy of tadalafil and ambrisentan combination therapy versus current monotherapies. They included SSc patients with associated PH and found that combination therapy could cause a higher rate of efficacy with a similar rate of adverse effects (16).
Even though the enrolled elements of hemodynamic and cardiac status of PH phenomena could be altered by the administration of tadalafil, the efficacy of this agent in ILD and pulmonary dysfunction needs further elucidation (17). Besides, Galie et al.'s study showed that tadalafil 40 mg was well tolerated and could improve exercise capacity and reduce the worsening of PH (18). Chauvelot et al.'s study showed that PH treatment was not associated with a better outcome in patients with SSc-PH-ILD compared to patients with SSc-PH (19).
Subjects with SSc-ILD usually have increased production of interleukin (IL)-8 and tumor necrosis factor-alpha (TNF-α) in bronchoalveolar lavage (BAL) samples (20). Moreover, there is an augmented expression of Toll-like receptor (TLR) 4 in lung fibroblasts of patients with SSc-ILD (21). Toll-like receptor 4 is widely recognized as a part of innate immunity but can be activated by other circumstances like coronary artery procedures and ILD (22, 23). Interestingly, IL-33 has been shown to be involved in the pathogenesis of SSc (24). Additionally, it has been previously shown that sildenafil, as a PDE5 inhibitor, could prevent cardiac fibrosis possibly through alteration in transforming growth factor-beta 1 (TGF-β1) production (25). A study by Higuchi et al. indicated that sildenafil could subside SSc skin fibroblasts induced by TGF-β1 (26).
together, there are a limited number of medical therapies for ILD induced by SSc. Immunosuppressive medications and drugs against PH are all available options in addition to anti-fibrotic agents.
5.1. Study Limitation
The present study has several limitations that should be acknowledged. Due to the limited number of patients, our findings should be confirmed in larger, randomized studies with sufficient power. The untoward effects of long-term treatment with sildenafil should be assessed by further studies.
5.2. Conclusions
We demonstrated that a 6-month therapy with tadalafil was effective in partially improving respiratory functions in patients with ILD, both with and without PH. This treatment exhibited an acceptable safety profile.