
1. Background
Carpal tunnel syndrome (CTS) is the most common entrapment neuropathy affecting the upper extremities and can be managed with both conservative and surgical treatments (1). Mild to moderate cases of CTS are typically treated with conservative methods, such as splints, wrist immobilization, and local injections into the carpal tunnel, with corticosteroids (CS) being the most commonly used agents (2). In these cases, CS injections can be as effective as surgery, particularly in the short term (3). However, CS injections come with potential complications, including subcutaneous fat atrophy, alopecia, and the possibility of systemic adverse effects (4).
Various in vivo, in vitro, and clinical studies have demonstrated the diverse physiological effects of exogenous hyaluronic acid (HA). Hyaluronic acid has been successfully utilized in fields such as ophthalmology, musculoskeletal medicine, dermatology, and wound healing (5). As a mucopolysaccharide and a key component of the extracellular matrix, HA is recognized for its neurotherapeutic properties (6). It promotes cell proliferation and migration and reduces perineural scar formation by inhibiting lymphocyte migration, proliferation, chemotaxis, and phagocytosis (7). Hyaluronic acid stimulates the production of interleukin-1, which influences fibroblast proliferation and collagenase production (8). Additionally, HA enhances chondrocyte and proteoglycan synthesis, decreases the formation and activation of pro-inflammatory mediators and matrix metalloproteinases, and modifies the behavior of immune cells. These actions help inhibit oxygen-derived free radicals, prevent the binding of immune complexes to multinucleated cells, regulate the migration and accumulation of leukocytes and macrophages, and influence fibroblast proliferation (9). Hyaluronic acid has been widely used in peripheral nerve tissue engineering and has shown potential for supporting nerve growth, differentiation, and proliferation, as well as offering therapeutic benefits for the central nervous system (10-12).
Despite HA established role in nerve repair and inflammation modulation, prior clinical studies on CTS have predominantly used low/medium molecular weight HA formulations, which may lack optimal viscoelasticity and tissue retention. To our knowledge, this is the first trial to evaluate high molecular weight HA — a formulation with enhanced mechanical stability and prolonged synovial residence time — for CTS management. Previous research suffers from inconsistent methodologies, including variable injection techniques (e.g., blind vs. ultrasound-guided) and heterogeneous HA preparations, limiting translational insights (13-16). Our use of high molecular weight HA addresses this gap, as its superior rheological properties may better mitigate nerve compression and perineural fibrosis, critical drivers of CTS pathophysiology.
2. Objectives
To address these gaps, we conducted a randomized controlled trial comparing ultrasound-guided HA injections with standard care (lidocaine/saline + splinting) in mild-to-moderate CTS. Our study uniquely integrates patient-reported outcomes (BCTQ, VAS) with objective electrophysiological (DSL, DML) and sonographic (CSA) measures to holistically evaluate HA’s therapeutic potential. By employing a standardized ultrasound-guided in-plane ulnar approach, we aimed to isolate HA’s efficacy while minimizing technical variability. This design not only clarifies HA’s standalone benefits but also provides insights into its mechanism of action in CTS, bridging the divide between preclinical promise and clinical practice.
3. Methods
3.1. Design and Setting
This study employed a parallel-group randomized placebo-controlled trial design, adhering to the consolidated standards of reporting trials 2022 (CONSORT) guidelines. Conducted from June 2019 to April 2021, the trial involved two outpatient physical medicine and rehabilitation clinics with high patient volumes (17). The study followed a 1:1 randomization scheme, with participants assigned to one of two parallel arms.
3.2. Eligibility Criteria
We invited males and females aged 18 to 65 years who had experienced CTS symptoms in the past three months to undergo an electrodiagnostic study. Patients with mild to moderate CTS, as determined by electrodiagnostic criteria (15), and a pain intensity of ≥ 4 were eligible. Exclusion criteria included severe CTS requiring surgery, metabolic diseases like diabetes and thyroid disorders, rheumatoid arthritis, recent steroid injections into the carpal tunnel (within the last three months), thoracic outlet syndrome (TOS), severe tendon atrophy, concomitant neuropathy or radiculopathy, previous carpal tunnel release (CTR) surgery, unwillingness to participate, allergies to lidocaine or HA, malignancy, skin infections at the injection site, and pregnancy (14).
3.3. Sampling Method
Patients with mild to moderate CTS were recruited from two high-volume outpatient physical medicine and rehabilitation clinics. Eligible participants included male and female patients aged 18 to 65 years who had experienced CTS symptoms within the past three months and reported a pain intensity of ≥ 4 on the Visual Analog Scale (VAS). Initially, potential participants attended a screening appointment where detailed medical histories, physical examinations, and electrodiagnostic studies were performed. Patients meeting the predefined inclusion criteria underwent further evaluation by a consensus committee, which confirmed their eligibility for the trial. A computer-generated randomization sequence was then used to allocate the eligible patients into two parallel groups (HA group and control group) in a 1:1 ratio. Allocation concealment was ensured through sequentially numbered sealed opaque envelopes, which were handled by an independent nurse and physician not involved in the intervention or outcome assessments. The sample size was calculated based on an expected effect size of 0.8 and was adjusted to include an additional 10% of participants to account for potential dropouts, leading to a total of 60 participants.
3.4. Recruitment Process
Patients with CTS symptoms were initially invited for a screening appointment. During the first visit, the study’s phases and the reasons for participation were explained to all potential participants. If a patient declined to participate, another was selected and invited in the same manner until the required sample size was achieved. At the screening visit, medical history and physical examination findings were recorded, and electrodiagnostic studies were requested. Patients were also asked about their medication and dietary supplement use, with responses documented on case report forms following good clinical practice principles. After reviewing the records, eligible patients were presented to a consensus committee of researchers who confirmed their eligibility and invited them to participate. Participants who provided written informed consent were then assigned to one of the study groups (17).
3.5. Interventions and Preparations
At the start of the study, participants received both verbal and written information from a physical medicine and rehabilitation specialist about the injections, their benefits, and possible side effects. In cases of bilateral CTS, the most affected hand was selected for the study, and a night splint was recommended for the other hand. Both groups received a local injection in the carpal tunnel and a similar static night splint positioned at the volar surface with a neutral to 5-degree extension (17).
3.6. Control and Hyaluronic Acid Groups
In the control group, patients received an injection of 0.5 mL of 2% lidocaine sterile solution (Caspian Company, Iran) mixed with 1 mL of normal saline (Daroupakhsh Company, Iran). In contrast, the HA group received an injection of 0.5 mL of 2% lidocaine combined with 1 mL of 2% HA (Synotek, 50 mg/2.5 mL, > 2000 kDal, fermentation source HA, Pars Pharmed Ariya Company, Iran) (17).
3.7. Injection Technique
All injections were performed using a 23-gauge needle with an ulnar in-plane approach under ultrasound (US) guidance by a single experienced physical medicine and rehabilitation specialist (18). Patients were positioned supine with their hands resting on the edge of the bed (18). The procedure was conducted under sterile conditions using the freehand technique. After skin preparation and disinfection with a 10% povidone-iodine solution, the carpal tunnel was re-identified using a transducer covered with a sterile cover. Figure 1 illustrates the injection technique under US guidance. One milliliter of the medication or placebo was injected into the dorsal aspects of the median nerve (MN). All patients were prescribed a static wrist splint to be worn at night for 10 weeks (prefabricated CTS orthoses with a static volar splint positioning the wrist in a 0 - 5º extension). Patients were given written instructions upon discharge, advised to rest for 24 hours, and recommended to apply a cold compress for 10 minutes three times daily. Acetaminophen (500 mg every 4 - 8 hours) was permitted if pain was not controlled. Other analgesics, supplements, or vitamins were prohibited for one week post-injection. Patients were generally advised to continue low to moderate physical activity, gradually increasing intensity at their own pace (19).
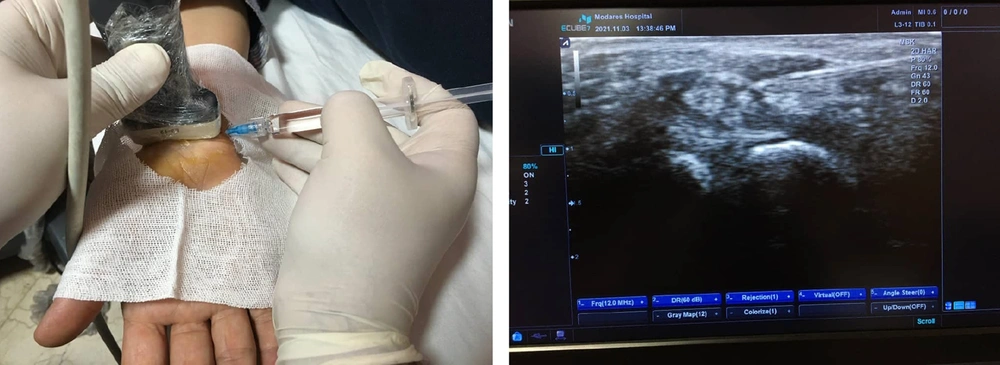
Figure 1.
Injection technique under ultrasound (US) guidance. Left panel demonstrates the injection process. Right panel displays the corresponding ultrasound image of the injection site. Due to the simplicity of the images, detailed labels for structures such as the needle, median nerve (MN), and surrounding tissues have not been included. For a comprehensive explanation of the anatomical landmarks and the injection technique, please refer to the Methods section of the manuscript.
3.8. Outcome Measurements
The primary outcome of this study was the Boston Carpal Tunnel Questionnaire (BCTQ). Secondary outcomes included the VAS, electrodiagnostic findings, patient satisfaction, and any injection-related complications (20).
3.9. Boston Carpal Tunnel Questionnaire
The BCTQ is a widely used patient-reported questionnaire for assessing CTS. It consists of two subscales: The Boston Questionnaire Symptom Severity Scale (BQ-SS) and the Boston Questionnaire Functional Status Scale (BQ-FS). The BQ-SS includes 11 items rated on a five-point scale ranging from "none" or "never" to "very severe" or "continuous". The BQ-FS comprises 8 items with a five-point scale indicating the difficulty of daily tasks, from "no difficulty" to "cannot perform". The scores for each subscale are summed, with higher scores indicating greater disability (17). The validity and reliability of the Persian version of the BCTQ have been evaluated by several authors in recent years (17, 19, 21).
3.10. Visual Analog Scale
The VAS is a widely validated and reliable instrument for assessing pain intensity. It measures pain on a continuous scale from 0 (no pain) to 10 (severe pain), with previous studies demonstrating high test-retest reliability, typically with intraclass correlation coefficients ranging from 0.80 to 0.95. In our study, participants were asked to indicate the maximum pain they experienced in the past two days using the VAS ruler, ensuring a consistent and sensitive measure of pain intensity (22).
3.11. Electrodiagnostic Findings
Electrodiagnostic evaluations were conducted using a Cadwell Sierra Wave device. The compound motor action potential (CMAP) and sensory nerve action potential (SNAP) of the MN were recorded using techniques described by Dumitru et al. (as cited by Park et al.) (23). For each subject, peak distal sensory latency (DSL), onset distal motor latency (DML), and baseline-to-peak SNAP and peak-to-peak CMAP amplitudes were reported (23, 24).
3.12. Carpal Tunnel Syndrome Grading
Based on Stevens’ modified criteria, diagnosed CTS patients were classified as mild, moderate, or severe. Mild CTS was defined as prolonged median DSL, moderate as prolonged DSL and DML, and severe as prolonged DSL and DML with either an absent SNAP or a very low-amplitude or absent thenar CMAP (25).
3.13. Patient Satisfaction and Injection Complications
All patients were rated for complications such as stiffness, heaviness, and pain, as well as their treatment satisfaction, using a 5-point Likert scale: (1) Very dissatisfied, (2) dissatisfied, (3) neutral, (4) satisfied, and (5) very satisfied (26).
3.14. Follow-ups
Participants were assessed twice: Before the intervention and 10 weeks after the injection. The instruments used were the BCTQ, VAS, and electrodiagnostic evaluation (19).
3.15. Sample Size
At the time of study design, with no primary data available to determine the effect size of HA in CTS, the research team adopted an estimated effect size of 0.7 to detect differences between the two groups. The sample size calculation was performed using G*Power software. Furthermore, during the study, the COVID-19 pandemic slowed the recruitment process. In 2021, a study by Su et al. was published, investigating the effectiveness of perineural HA injection compared to normal saline in CTS patients (14). They allocated 17 and 15 participants to HA and control groups, respectively, measuring outcomes such as BCTQ, pain using a numeric rating scale (NRS), electrophysiological domains, and the cross-sectional area of the MN at baseline, 2-, 4-, 12-, and 24-weeks post-intervention (14). Their results showed similar BCTQ scores at baseline (2.4 ± 0.1 versus 2.3 ± 0.1, P > 0.05), but a significant difference at 4 weeks (1.7 ± 0.1 versus 1.9 ± 0.1, P = 0.030), yielding a large effect size of 2.00 on Cohen’s Scale (14).
Considering this effect size, to detect a significant discrepancy in BCTQ scores between our two groups at 10 weeks, with a power of 80% and a two-tailed P-value of 0.05 as statistically significant, we needed 6 participants in each group. However, due to the small sample size, the research team decided to use an effect size of 0.8 for our calculations. This scenario required 26 samples in each group. We added an additional 4 participants to each group to ensure the study would be sufficiently powered for a 10% loss to follow-up. Therefore, a total of 60 participants were randomly allocated to the study groups.
3.16. Randomization and Blinding
Randomization was performed in an independent statistical room using a computer-generated sequence. Allocation concealment was maintained through the use of sequentially numbered, sealed envelopes containing the group assignments. These envelopes were opened solely by a nurse and an experienced physician — both uninvolved in the intervention and outcome assessments — who prepared the injection solutions. All follow-up examinations were subsequently conducted by blinded investigators (17).
3.17. Statistical Analyses
Data for each patient were recorded in their profiles, and statistical analysis was performed using SPSS 24 software. Mean and standard deviation were used to describe quantitative variables, while relative frequency was used for qualitative variables. In the analytical statistics section, the normality of the variables was first assessed using the Shapiro-Wilk test. The chi-square test and Fisher’s exact test were employed to compare the frequency of qualitative variables between groups. The independent t-test and Mann-Whitney U test were used to compare the means of quantitative variables. For quantitative variables that did not meet the assumptions of normality, the non-parametric equivalents of the tests were used. A significance level of less than 0.05 was considered statistically significant.
4. Results
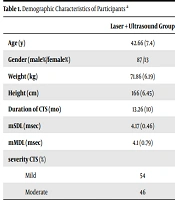
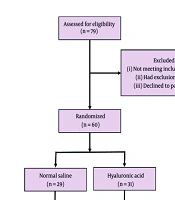
This clinical trial involved 60 patients with mild to moderate CTS who were randomly assigned to two treatment groups. The study process, including patient enrollment and group assignment, is depicted in the CONSORT flow diagram (Figure 2). Baseline demographic characteristics and outcome measures, along with patients’ pre-intervention values, are presented in Table 1. No statistically significant differences were observed between the groups for these parameters, except that the HA group exhibited a significantly higher age (P = 0.041). Changes in study outcomes before and after the intervention, specifically the intensities of VAS, BQ-SS, BQ-FS, DSL, DML, and CTS, are presented in Tables 2 and 3.
Table 1.
Demographic Information and Study Outcomes Before the Intervention in Each Group a
| Variables | HA (n = 25) | Control (n = 23) | P-Value |
|---|---|---|---|
| Basic Characteristics | |||
| Age (y) | 50.00 ± 8.50 | 45.35 ± 6.66 | 0.041 |
| Gender | 0.611 | ||
| Female | 21 (84) | 18 (78.3) | |
| Male | 4 (16) | 5 (21.7) | |
| Dominant hand | 0.278 | ||
| Right | 16 (64) | 18 (78.3) | |
| Left | 9 (36) | 5 (21.7) | |
| Most affected side | 0.307 | ||
| Right | 15 (60) | 17 (73.9) | |
| Left | 10 (40) | 6 (26.1) | |
| Symptom duration (mo) | 7.32 ± 3.31 | 6.91 ± 2.75 | 0.647 |
| CTS severity | 0.683 | ||
| Mild | 16 (64) | 16 (69.6) | |
| Moderate | 9 (36) | 7 (30.4) | |
| Outcome measures | |||
| VAS | 6.08 ± 1.68 | 6.39 ± 0.99 | 0.435 |
| BCTQ | |||
| BQ-SS | 27.72 ± 5.83 | 27.30 ± 4.65 | 0.787 |
| BQ-FS | 23.52 ± 6.71 | 22.70 ± 5.38 | 0.643 |
| Electrodiagnostic studies | |||
| Peak DSL (ms) | 4.04 ± 0.47 | 3.89 ± 0.24 | 0.185 |
| Onset DML (ms) | 4.15 ± 0.60 | 4.04 ± 0.48 | 0.496 |
| CSA (mm2) | 11.70 ± 1.00 | 11.80 ± 0.57 | 0.695 |
Abbreviations: HA, hyaluronic acid; SD, standard deviation; CTS, carpal tunnel syndrome; VAS, Visual Analogue Scale; BCTQ, Boston Carpal Tunnel Questionnaire; BQ-SS, Boston Questionnaire Symptom Severity Scale; BQ-FS, Boston Questionnaire Functional Status Scale; DSL, distal sensory latency; DML, distal motor latency; CSA, cross-sectional area.
a Values are expressed as No. (%) or mean ± SD.
| Outcomes | Before Intervention | After Intervention | Values | P-Value (Within-Group) | P-Value (Between-Group) c |
|---|---|---|---|---|---|
| VAS | 0.006 | ||||
| HA | 6.08 ± 1.68 | 2.44 ± 1.04 | 3.64 ± 1.32 | < 0.001 | |
| Control | 6.39 ± 0.99 | 3.96 ± 1.67 | 2.44 ± 1.59 | < 0.001 | |
| BCTQ | |||||
| BQ-SS | 0.005 d | ||||
| HA | 27.72 ± 5.83 | 17.00 ± 4.71 | 10.72 ± 4.63 | < 0.001 | |
| Control | 27.30 ± 4.65 | 20.13 ± 5.23 | 7.17 ± 3.68 | < 0.001 | |
| BQ-FS | 0.004 d | ||||
| HA | 23.52 ± 6.71 | 13.08 ± 2.75 | 10.44 ± 5.95 | < 0.001 | |
| Control | 22.70 ± 5.38 | 16.78 ± 5.82 | 5.91 ± 4.17 | < 0.001 | |
| Electrodiagnostic | |||||
| Peak DSL (ms) | 0.137 | ||||
| HA | 4.04 ± 0.47 | 3.81 ± 0.45 | 0.22 ± 0.20 | < 0.001 | |
| Control | 3.89 ± 0.24 | 3.75 ± 0.24 | 0.14 ± 0.16 | < 0.001 | |
| Onset DML (ms) | 0.288 | ||||
| HA | 4.15 ± 0.60 | 4.02 ± 0.52 | 0.14 ± 0.21 | 0.003 | |
| Control | 4.04 ± 0.48 | 3.96 ± 0.48 | 0.08 ± 0.21 | 0.002 | |
| Sonographic | |||||
| CSA (mm2) | 0.202 | ||||
| HA | 11.70 ± 1.00 | 11.00 ± 0.92 | 0.70 ± 0.64 | < 0.001 | |
| Control | 11.80 ± 0.57 | 11.32 ± 0.70 | 0.48 ± 0.56 | < 0.001 |
Abbreviations: HA, hyaluronic acid; SD, standard deviation; VAS, Visual Analogue Scale; BCTQ, Boston Carpal Tunnel Questionnaire; BQ-SS, Boston Questionnaire Symptom Severity Scale; BQ-FS, Boston Questionnaire Functional Status Scale; DSL, distal sensory latency; DML, distal motor latency; CSA, cross-sectional area, MD, mean difference.
a All values are expressed as mean ± SD.
b Data normality was assessed using the Shapiro-Wilk test. Within-group comparisons were performed using paired t-tests or, when appropriate, the Wilcoxon signed-rank test.
c Between-group comparisons of mean differences were conducted using independent t-tests or the Mann-Whitney U test for non-normally distributed data.
d A significance level of P < 0.05 was applied throughout.
Table 3.
Distribution of Carpal Tunnel Syndrome Severity in the Two Groups After the Intervention a
| Variables | HA (n = 25) | Control (n = 23) | P-Value |
|---|---|---|---|
| CTS severity | 0.103 b | ||
| Normal | 8 (32) | 2 (8.7) | |
| Mild | 11 (44) | 16 (69.6) | |
| Moderate | 6 (24) | 5 (21.7) |
Abbreviations: HA, hyaluronic acid; CTS, carpal tunnel syndrome.
a Values are expressed as No. (%).
b P-value derived using the chi-square test.
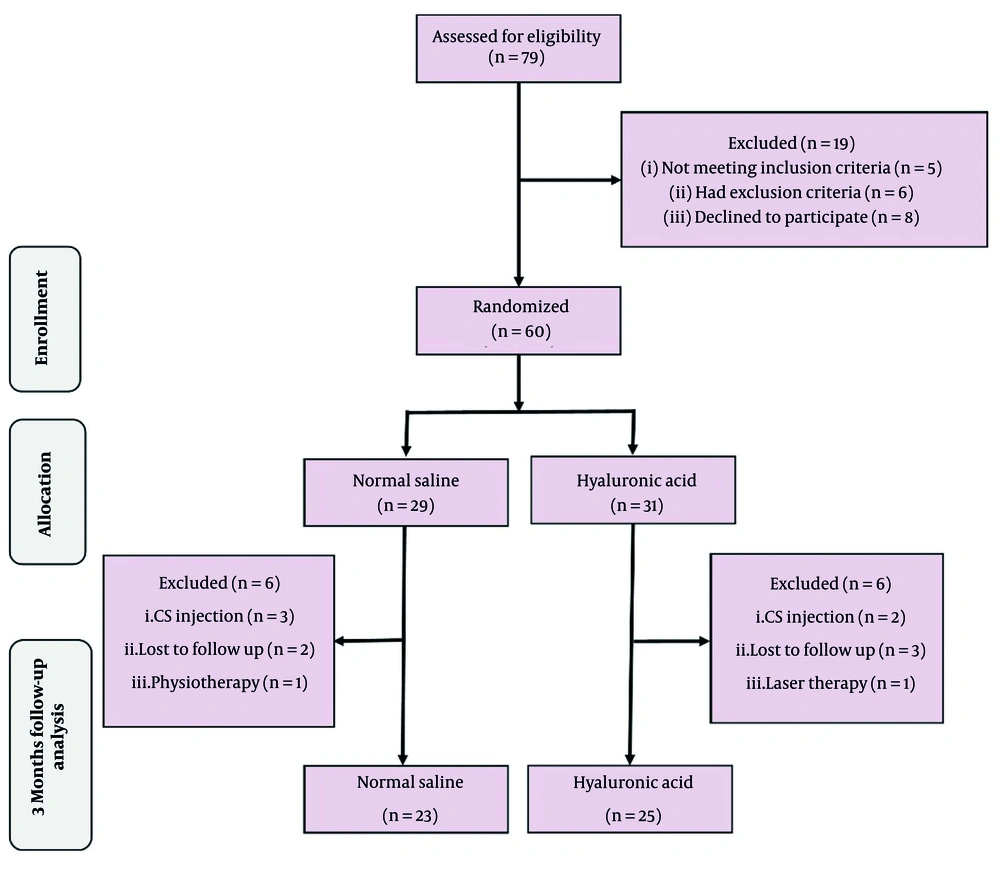
Figure 2.
Consolidated standards of reporting trials (CONSORT) flow diagram
5. Discussion
This study demonstrated that ultrasound-guided HA injection using the ulnar in-plane method provides superior analgesic effects and improvements in symptom severity and functional status in patients with CTS compared to the control group. This finding supports emerging evidence that HA confers significant neurotherapeutic benefits in compressive neuropathies. Mechanistically, HA is a naturally occurring mucopolysaccharide within the extracellular matrix, crucial for maintaining tissue hydration and facilitating cell signaling. It promotes cell proliferation and migration and reduces perineural scar formation by inhibiting lymphocyte migration, proliferation, chemotaxis, and phagocytosis (6, 7). This anti-adhesive property is particularly beneficial for CTS, where fibrosis and scar adhesions can exacerbate MN compression. Moreover, HA’s role in diminishing tissue adhesion without impairing wound healing supports an environment that favors nerve regeneration by facilitating remyelination, increasing axon numbers and diameter, and preventing the formation of painful neuromas through the controlled regulation of axonal growth (27).
In addition to its anti-adhesive effects, HA modulates the local inflammatory response. By stimulating the production of interleukin 1 (IL 1), HA influences fibroblast proliferation and collagenase production, thereby promoting balanced tissue repair (8). Exogenous HA further enhances chondrocyte and proteoglycan synthesis, while concurrently reducing the activation of pro-inflammatory mediators and matrix metalloproteinases. This multi-faceted action helps to inhibit the generation of oxygen-derived free radicals and the pathological accumulation of inflammatory cells, ultimately creating a microenvironment conducive to nerve healing (9).
Experimental studies reinforce these mechanisms. For instance, animal models have shown that topical HA application effectively prevents perineural scar formation and enhances nerve regeneration (28-31). In peripheral nerve tissue engineering, HA has not only served as a biocompatible scaffold but has also actively modulated the repair microenvironment, promoting nerve growth, differentiation, and proliferation (10-12). In clinical settings, investigations by Su et al. and Atzei et al. (as cited by Su et al.) reported that US-guided HA injections yielded significant improvements in pain scores and functional recovery in CTS patients — findings that are consistent with our own results (14, 19, 32).
Furthermore, our utilization of the ulnar in-plane injection technique US guidance warrants emphasis. This approach allows for precise delivery of HA into the carpal tunnel, ensuring optimal distribution of the agent while minimizing potential tissue trauma. Meta-analyses and clinical trials have established that the in-plane ulnar approach leads to superior outcomes in electrodiagnostic, sonographic, and clinical parameters compared to other injection techniques (33-35). Complementing this intervention with wrist splinting — recognized as an effective first-line treatment for CTS due to its ability to alleviate increased carpal tunnel pressures — further contributed to the enhanced clinical outcomes observed in our study (36-38).
In conclusion, our findings indicate that ultrasound-guided HA injection via the ulnar in-plane method not only alleviates pain and improves functional status in CTS patients but also may offer long-term neuroprotective benefits by modulating the local tissue environment. Future investigations should aim to delineate the molecular pathways underlying HA’s effects, explore optimal dosing regimens, and assess the long-term efficacy of HA injections relative to standard corticosteroid therapies. These efforts will be instrumental in further establishing HA as a valuable therapeutic option for the conservative treatment of CTS.
5.1. Conclusions
The study indicates that US-guided HA injection into the carpal tunnel using the ulnar in-plane approach is linked to improvements in pain, function, and electrodiagnostic and ultrasound findings in patients with mild to moderate CTS. Based on the research findings, this treatment method holds promise for enhancing the management of CTS.
5.2. Limitations
Despite the positive findings, our study presents several limitations. The 10-week follow-up period may be too short to capture long-term neural regeneration and structural changes. Additionally, the relatively small sample size and the performance of injections by a single operator US guidance limit the generalizability of the results. Moreover, the use of wrist splints in both groups might have confounded the isolated effects of the HA injection. Future studies with larger cohorts and longer follow-up periods are warranted.