
1. Background
Health system responsiveness (HSR), a core dimension of health system performance, refers to how health systems address clients’ nonmedical expectations—dignity, confidentiality, communication, and prompt attention (1)—and is linked to public trust and improved health outcomes (2). Responsiveness is particularly important in humanitarian settings, which are marked by resource constraints and heightened vulnerability, where it also safeguards dignity and equity (3, 4). Organizations such as the Iranian Red Crescent Society (IRCS) are often the first, and sometimes the only, providers to reach these populations (5, 6).
Despite its significance, empirical evidence on HSR in humanitarian contexts remains limited. Existing research emphasizes structural or outcome indicators over clients’ lived experiences (4), reflecting a broader scarcity of research conducted in humanitarian and crisis-affected settings compared with research on routine, facility-based health services. For example, comparative evaluations of hospital-based health system planning and quality in Iran have likewise relied on structural and administrative indicators rather than client-reported experience (7). In Iran, HSR research is scarce and has rarely examined its association with client satisfaction with Red Crescent services; no study has examined this relationship at a comparable provincial level. The IRCS was selected because, unlike facility-based providers, it is often the sole provider reaching vulnerable populations in both urban and rural areas, consistent with the recognized importance of specialized, adequately trained humanitarian care providers for care quality in crisis-affected settings (8).
Razavi Khorasan Province, in northeastern Iran, has a population exceeding six million (9) and marked geographic diversity. It shares an international border with Afghanistan and hosts one of the country’s largest concentrations of registered Afghan refugees (10). Its seismically active terrain poses substantial earthquake risk to its heavily populated urban core (11), and its concentrated Red Crescent infrastructure makes it a setting in which social, medical, pharmaceutical, and rehabilitation services operate simultaneously at scale, providing a comprehensive context for evaluating responsiveness across service types. Recent province-level public health research further illustrates the scale and diversity of health service demand in this setting (12).
2. Objectives
This study therefore examined HSR in humanitarian services delivered by the IRCS in Razavi Khorasan Province and its association with client satisfaction to generate evidence to support quality improvement in humanitarian health services.
3. Methods
A descriptive-analytical cross-sectional survey was conducted in 2023 among recipients of IRCS services (social, pharmaceutical, medical, and rehabilitation) across Razavi Khorasan Province.
Participants were recruited using a multistage design that combined probability-based clustering with convenience sampling within strata. All 27 counties with an active IRCS branch served as primary clusters; within each county, services were stratified into four categories. Because no complete sampling frame existed, 10 participants per stratum were selected by convenience sampling at service centers, yielding an initial quota of 1,080 (27 × 4 × 10), set for feasibility rather than on the basis of a power calculation. Accounting for anticipated 25% attrition, the adjusted target was 1,350; 1,384 questionnaires were retained. Because selection within strata was nonrandom, the design is best described as cluster sampling with convenience sampling within strata, and the findings should be interpreted with this potential selection bias in mind. Inclusion required informed consent, a minimum of 6 months of service receipt (a threshold set in view of the study's 12-month duration), and the ability to complete the questionnaire independently, via a parent/guardian proxy for participants younger than 18 years, or with interviewer assistance for illiterate participants.
Data were collected using a demographic checklist and two validated instruments. The McMurtry Client Satisfaction Scale (1994; 25 items, five-point Likert) measures overall satisfaction; 5 reverse-worded items were recoded, and total scores reflect the raw sum of all items (range 25 - 125). The World Health Organization (WHO) Health System Responsiveness Questionnaire (2000; 25 items, eight domains) assesses prompt attention, communication, dignity, autonomy, confidentiality, choice of provider, quality of basic amenities, and social support, with domain scores calculated as item means. Persian-validated versions were used, and internal consistency was reevaluated using Cronbach's alpha. For each instrument, KMO/Bartlett testing preceded exploratory factor analysis (EFA) using principal component analysis with Varimax rotation. Confirmatory factor analysis (CFA) was conducted in AMOS (version 24) using maximum likelihood estimation. Both analyses used the same full sample (n = 1,384); independent split-sample validation was not performed (see Limitations).
Data were collected using a mixed-mode approach (approximately 70% paper, 30% electronic). All analyses were conducted using SPSS and AMOS (version 24). Group comparisons used t tests and analysis of variance (ANOVA) with Tukey honestly significant difference tests after homogeneity of variance and normality were verified; effect sizes (Cohen's d, η2) are emphasized given the number of comparisons performed. The HSR–satisfaction association was examined using Pearson correlation and analysis of covariance (ANCOVA), with satisfaction as the dependent variable, HSR as a covariate, and gender and service type as fixed factors.
4. Results
4.1. Demographic Characteristics
Among 1,384 IRCS recipients across 27 counties, the gender distribution was balanced. Most were married (43.6%) or single (38.9%), and 62.1% resided in urban areas. The largest age group was 1 - 15 years (32%, via parent/guardian proxy), followed by 31 - 45 years (29%). Education levels ranged from illiterate (17.3%) to bachelor's degree (19.6%). Rehabilitation was the most frequently used service (29.2%), followed by social and pharmaceutical services (25% each) and medical services (20.8%) (Table 1).
Table 1.
Demographic Characteristics of Participants (N = 1,384) a
| Variables | No. (%) |
|---|---|
| Gender | |
| Female | 692 (50.0) |
| Male | 692 (50.0) |
| Residence | |
| Urban | 859 (62.1) |
| Rural | 525 (37.9) |
| Marital Status | |
| Married | 604 (43.6) |
| Single | 538 (38.9) |
| Divorced-Separated | 134 (9.7) |
| Widowed | 108 (7.8) |
| Age Group (y) | |
| 1 - 15 | 443 (32.0) |
| 16 - 30 | 171 (12.4) |
| 31 - 45 | 401 (29.0) |
| 46 - 60 | 263 (19.0) |
| ≥ 61 | 106 (7.7) |
| Education | |
| Illiterate | 240 (17.3) |
| Below Diploma | 201 (14.5) |
| Diploma | 169 (12.2) |
| Associate | 161 (11.6) |
| Student | 231 (16.7) |
| Bachelor | 271 (19.6) |
| Master | 78 (5.6) |
| PhD+ | 33 (2.4) |
| Service Type | |
| Rehabilitation | 404 (29.2) |
| Social | 346 (25.0) |
| Pharmaceutical | 346 (25.0) |
| Medical | 288 (20.8) |
a Percentages may not sum to 100 due to rounding.
4.2. Reliability
Cronbach's alpha indicated acceptable internal consistency for the Satisfaction Scale (α = 0.737) and good internal consistency for the Responsiveness Questionnaire (α = 0.872) across the full sample (Table 2).
Table 2.
Internal Consistency Reliability of the Client Satisfaction Scale and Health System Responsiveness Questionnaire (N = 1,384)
| Instrument | No. of Items | n | Cronbach's α | Interpretation |
|---|---|---|---|---|
| Client Satisfaction Scale | 25 | 1,384 | 0.737 | Acceptable |
| Health System Responsiveness Questionnaire | 25 | 1,384 | 0.872 | Good |
4.3. Levels of Client Satisfaction and Health System Responsiveness
Total satisfaction scores (M = 76.47, SD = 9.32; possible range, 25 - 125) corresponded to 61.2% of the maximum possible score, indicating a moderate overall level of client satisfaction. At the domain level (Table 3 and 4), Return Intention (66.7% of the maximum) and Empowerment (66.2%) showed the highest relative levels, followed by Client-Centeredness (63.0%) and Respect and Attention (59.2%), which was the lowest of the four domains.
Table 3.
Descriptive Statistics and Confirmatory Factor Analysis (CFA) Model Fit — Client Satisfaction Scale
| Factor / Total | Mean | SD | Min | Max |
|---|---|---|---|---|
| Empowerment | 29.78 | 6.93 | 9.00 | 45.00 |
| Respect & Attention | 20.72 | 2.35 | 14.00 | 28.00 |
| Return Intention | 16.67 | 3.93 | 5.00 | 25.00 |
| Client-Centeredness | 12.59 | 2.18 | 6.00 | 19.00 |
| Total Scale | 76.47 | 9.32 | 44.00 | 104.00 |
Table 4.
Confirmatory Factor Analysis Model Fit Indices for the Client Satisfaction Scale a
| CFA Fit Index | Value | Threshold | Result |
|---|---|---|---|
| χ2 (df) | 266.02 (269) | — | — |
| P | 0.540 | > 0.05 | Met |
| χ2/df | 0.989 | < 3.00 | Met |
| GFI / AGFI | 0.985 / 0.982 | > 0.95 / > 0.90 | Met |
| NFI / TLI / CFI | 0.976 / 1.000 / 1.000 | > 0.95 | Met |
| RMR / RMSEA (90% CI) | 0.021 / 0.000 (0.000, 0.010) | < 0.08 / < 0.06 | Met |
a Threshold criteria based on Hair et al. (13). Abbreviations: CFA, confirmatory factor analysis; GFI, Goodness-of-Fit Index; AGFI, Adjusted GFI; NFI, Normed Fit Index; TLI, Tucker-Lewis Index; CFI, Comparative Fit Index; RMR, Root Mean Square Residual; RMSEA, Root Mean Square Error of Approximation.
Total responsiveness scores (M = 82.54, SD = 13.06; theoretical range, 25 - 125) corresponded to 66.0% of the maximum possible score, indicating a moderate-to-high overall level of responsiveness that was consistently higher than the satisfaction level. At the domain level (Table 5 and 6), raw domain means ranged from 6.61 (Social Consideration) to 19.76 (Communication); however, this range reflects differences in the number of items per domain rather than differences in relative responsiveness. When expressed as a percentage of each domain's maximum possible score, all eight World Health Organization (WHO) domains clustered narrowly between 65.4% and 66.6%, with Autonomy showing the marginally highest relative level (66.6%) and Choice & Continuity the marginally lowest (65.4%). This narrow range indicates a fairly uniform, moderate-to-high level of responsiveness across all dimensions of care, with no single domain standing out as a particular strength or weakness.
Table 5.
Descriptive Statistics and Confirmatory Factor Analysis (CFA) Model Fit — WHO Responsiveness Questionnaire
| Factor / Total | Mean | SD | Min | Max |
|---|---|---|---|---|
| Communication | 19.76 | 4.78 | 6.00 | 30.00 |
| Dignity | 9.92 | 2.69 | 3.00 | 15.00 |
| Prompt Attention | 9.84 | 2.53 | 3.00 | 15.00 |
| Autonomy | 9.99 | 2.54 | 3.00 | 15.00 |
| Choice & Continuity | 9.82 | 2.47 | 3.00 | 15.00 |
| Confidentiality | 6.63 | 1.89 | 2.00 | 10.00 |
| Social Consideration | 6.61 | 1.82 | 2.00 | 10.00 |
| Quality of Amenities | 9.98 | 1.88 | 5.00 | 15.00 |
| Total Scale | 82.54 | 13.06 | 41.00 | 120.00 |
Table 6.
Confirmatory Factor Analysis Model Fit Indices for the WHO Health System Responsiveness Questionnaire a
| CFA Fit Index | Value | Threshold | Result |
|---|---|---|---|
| χ2 (df) | 738.00 (253) | — | — |
| P | < 0.001 | > 0.05 | Not met |
| χ2/df | 2.917 | < 3.00 | Met |
| GFI / AGFI | 0.958 / 0.946 | > 0.95 / > 0.90 | Met |
| NFI / TLI / CFI | 0.920 / 0.935 / 0.946 | > 0.95 | Not met / Not met / Met |
| RMR / RMSEA (90% CI) | 0.104 / 0.037 (0.034, 0.040) | < 0.08 / < 0.06 | Not met / Met |
a “Not met” indices are attributable to the non-significant loading of item 25 (β = −0.029, P = 0.392), retained to preserve the original WHO instrument structure. Threshold criteria based on Hair et al. (13). Abbreviations: CFA, confirmatory factor analysis; GFI, Goodness-of-Fit Index; AGFI, Adjusted Goodness-of-Fit Index; NFI, Normed Fit Index; TLI, Tucker-Lewis Index; CFI, Comparative Fit Index; RMR, Root Mean Square Residual; RMSEA, Root Mean Square Error of Approximation.
4.4. Client Satisfaction
EFA sampling adequacy was confirmed (KMO = 0.935; Bartlett's χ2(300) = 11160.88, P < 0.001). Four factors—Empowerment, Respect and Attention, Return Intention, and Client-Centeredness—were extracted, explaining 52.5% of the variance (Table 7). CFA supported this structure with excellent fit (Table 3; Figure 1); standardized loadings (0.58 - 0.72) were all significant (P < 0.001) and exceeded the 0.50 threshold (13).
Table 7.
Summary of Rotated Component Structure — Client Satisfaction Scale a
| Factor | Items (n) | Loading Range | Eigenvalue | % Variance |
|---|---|---|---|---|
| 1. Empowerment | 9 | 0.66 - 0.72 | 4.61 | 18.44 |
| 2. Respect & Attention b | 7 | 0.63 - 0.71 | 3.43 | 13.74 |
| 3. Return Intention | 5 | 0.69 - 0.73 | 2.74 | 10.97 |
| 4. Client-Centeredness b | 4 | 0.73 - 0.74 | 2.34 | 9.35 |
a KMO = 0.935; Bartlett's χ2(300) = 11160.88, P < 0.001. Extraction: Principal Component Analysis; Rotation: Varimax. Total variance explained = 52.50%.
b Contains reverse-worded items (loadings shown as absolute values). Full item-level loadings available from the authors upon request.
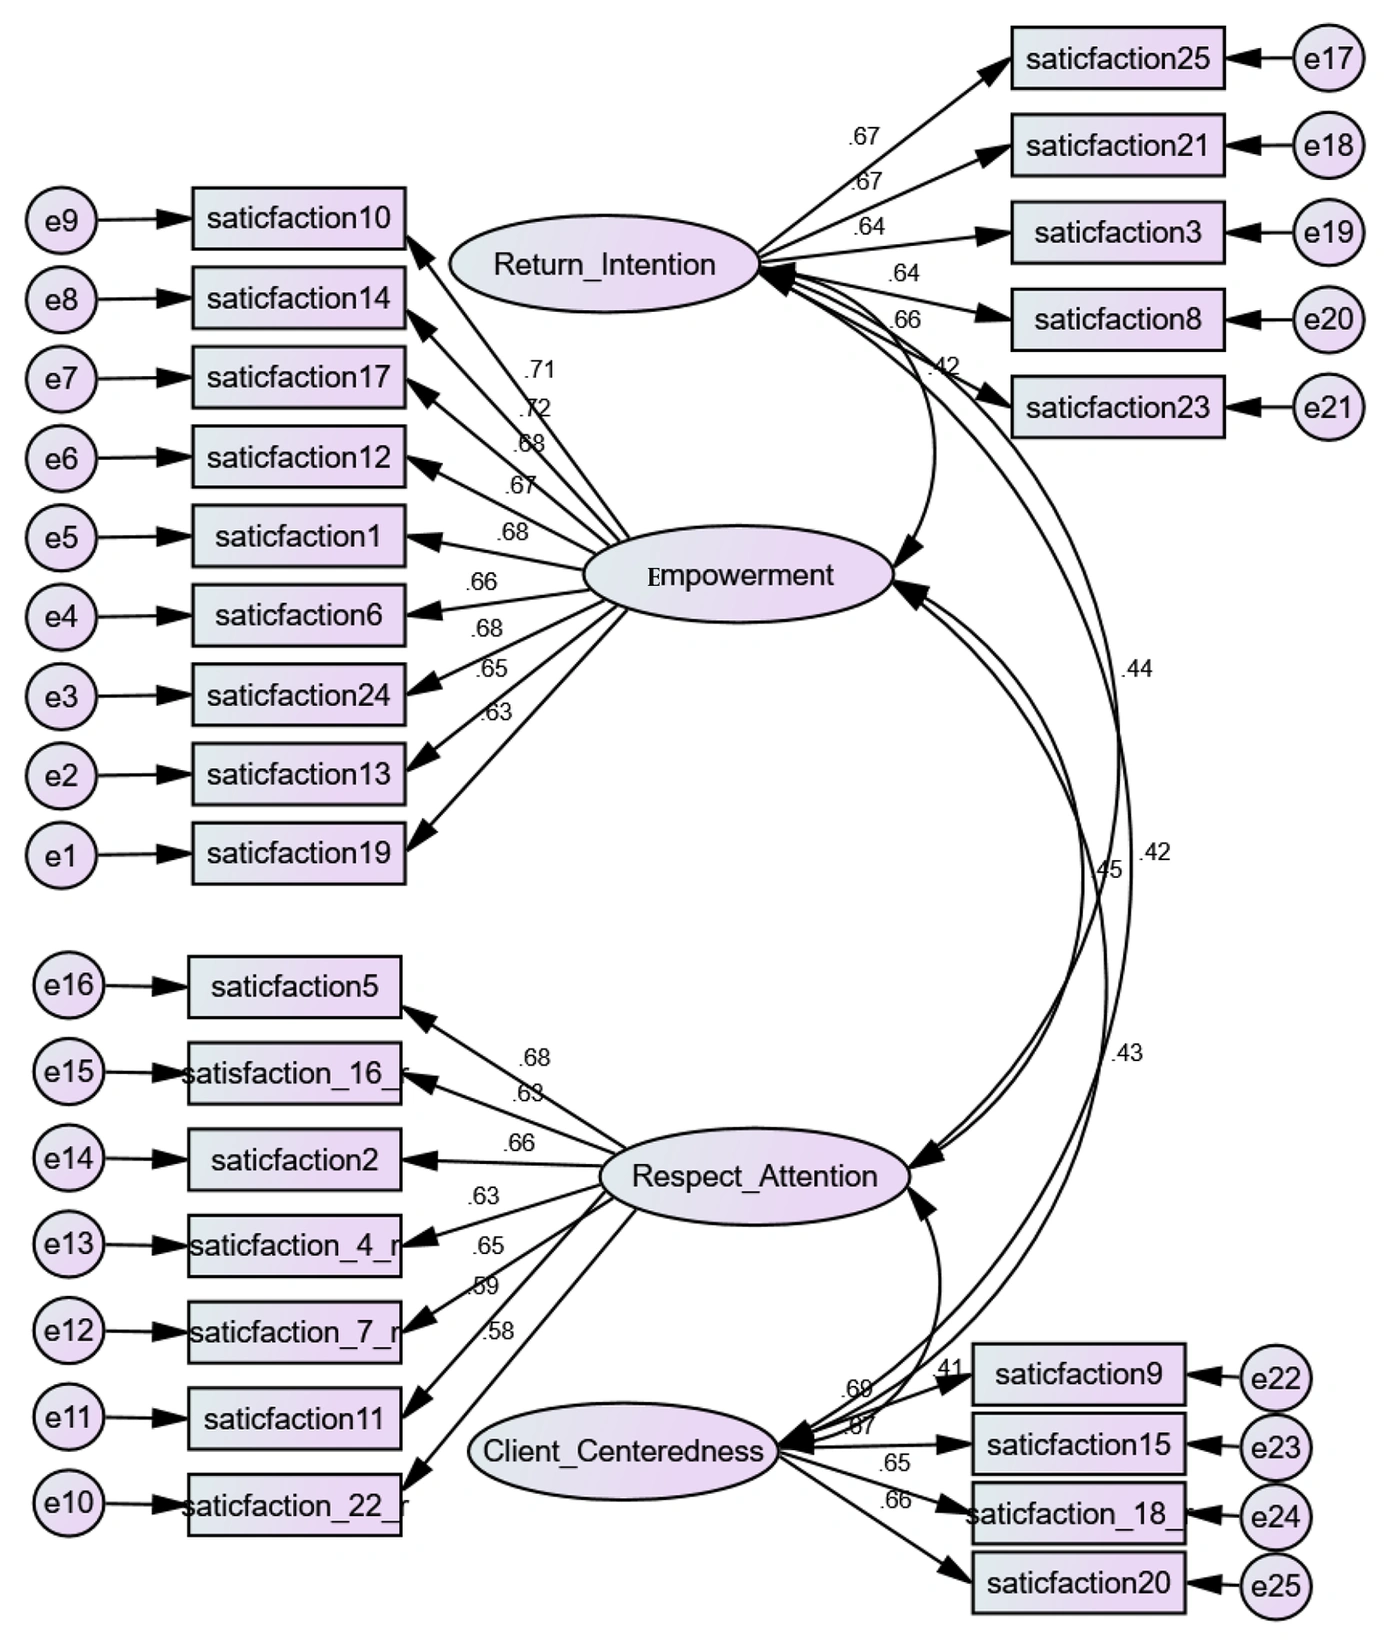
Figure 1.
Confirmatory factor analysis model of the Client Satisfaction Scale (four-factor structure)
4.5. Responsiveness
EFA sampling adequacy was confirmed (KMO = 0.890; Bartlett's χ2(300) = 9150.07, P < 0.001). Eight factors were extracted, consistent with the WHO domain structure (14), and explained 62.1% of the variance (Table 8). All loadings exceeded 0.68 except for item 25 (−0.40), which was retained to preserve the original structure. CFA showed acceptable fit (Table 5; Figure 2); Normed Fit Index (NFI), Tucker-Lewis Index (TLI), and Root Mean Square Residual (RMR) fell marginally below the thresholds, which was attributable to item 25's non-significant loading (β = −0.029, P = 0.392).
Table 8.
Summary of Rotated Component Structure — WHO Health System Responsiveness Questionnaire a
| Factor | Items (n) | Loading Range | Eigenvalue | % Variance |
|---|---|---|---|---|
| 1. Communication | 6 | 0.69 - 0.72 | 3.40 | 13.58 |
| 2. Dignity | 3 | 0.78 - 0.80 | 2.07 | 8.27 |
| 3. Prompt Attention | 3 | 0.75 - 0.77 | 1.94 | 7.76 |
| 4. Autonomy | 3 | 0.75 - 0.76 | 1.89 | 7.57 |
| 5. Choice & Continuity | 3 | 0.72 - 0.75 | 1.88 | 7.50 |
| 6. Confidentiality | 2 | 0.80 - 0.82 | 1.57 | 6.26 |
| 7. Social Consideration | 2 | 0.81 - 0.82 | 1.45 | 5.81 |
| 8. Quality of Amenities b | 3 | 0.40 - 0.75 | 1.34 | 5.38 |
a KMO = 0.890; Bartlett's χ2(300) = 9150.07, P < 0.001. Extraction: Principal Component Analysis; Rotation: Varimax. Total variance explained = 62.13%.
b Includes item 25 (loading = −0.40), retained to preserve the original WHO instrument structure. Full item-level loadings available from the authors upon request.
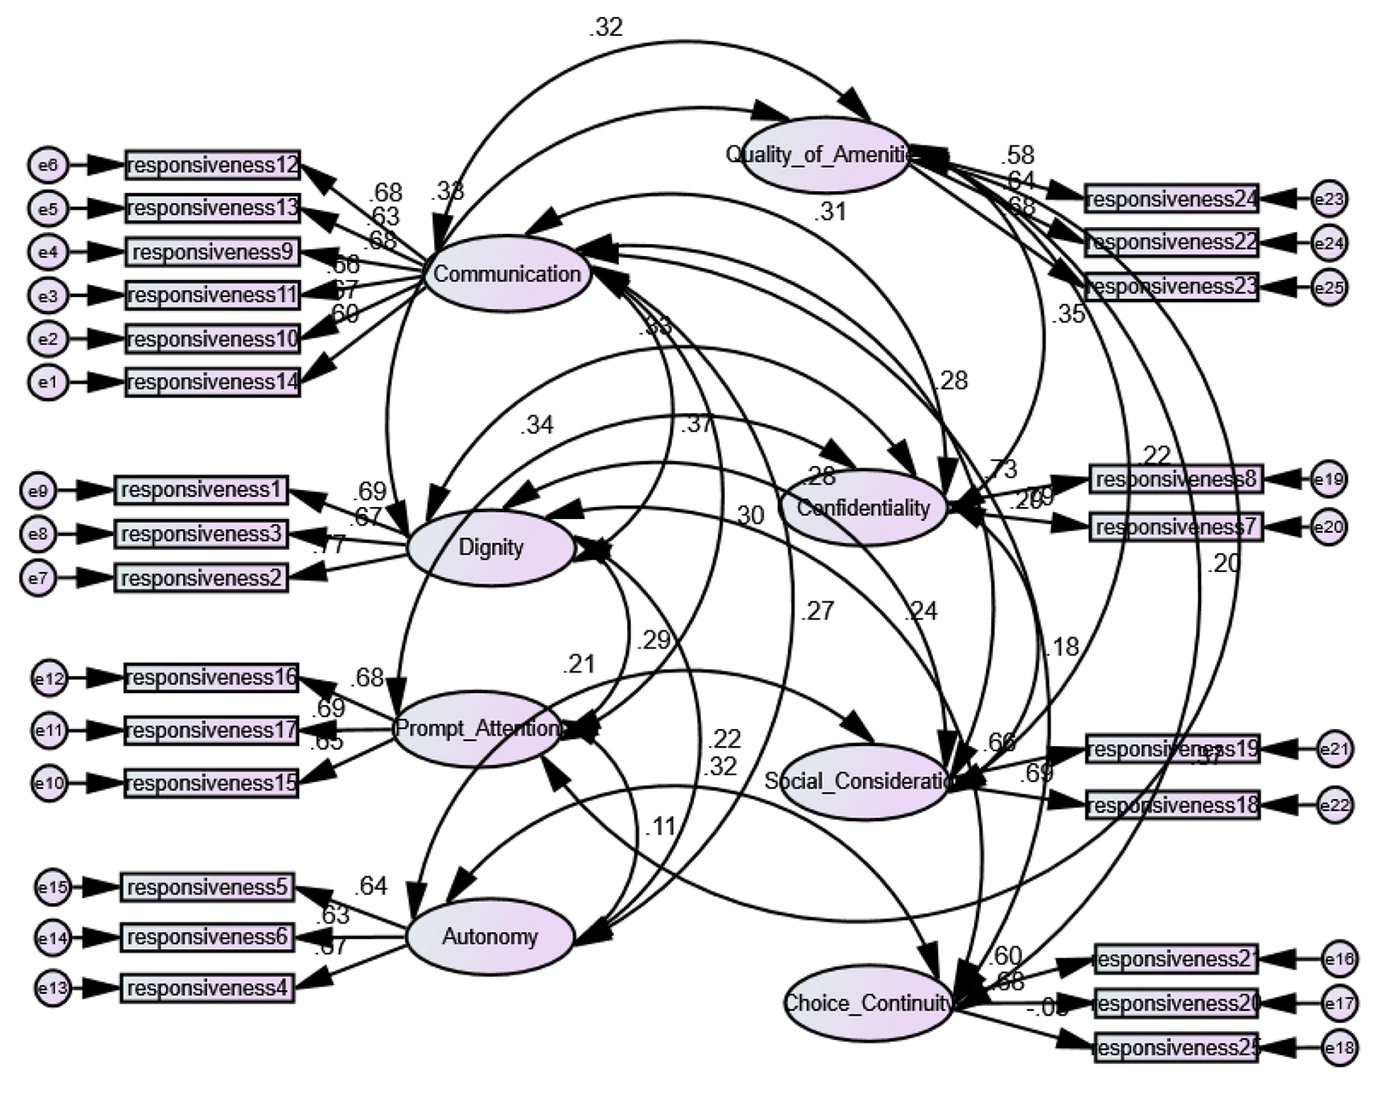
Figure 2.
Confirmatory factor analysis model of the Health System Responsiveness Questionnaire (eight-factor structure)
4.6. Demographic Comparisons
Female participants reported significantly higher satisfaction than male participants (t(1362) = 2.37, P = 0.018, d = 0.128), and recipients of pharmaceutical services reported higher satisfaction than recipients of social services (F(3, 1360) = 3.28, P = 0.020, η2 = 0.007; Tukey HSD P = 0.014). No significant differences emerged by residence, age, marital status, or education (Table 9).
Table 9.
Differences in Client Satisfaction and Health System Responsiveness by Demographic Characteristics (N = 1,364) a
| Variables | Sat. M | Resp. M | Test Statistic | P (Sat.) | P (Resp.) | ES |
|---|---|---|---|---|---|---|
| Gender: Female / Male | 77.04 / 75.85 | 83.22 / 82.01 | t = 2.37, df = 1362 | 0.018 b | 0.086 | d = 0.128 |
| Residence: Urban / Rural | 76.14 / 76.72 | 82.78 / 82.42 | t = −1.16, df = 1362 | 0.248 | 0.611 | d = −0.063 |
| Age Group (5 levels) | 75.52 - 76.52 | 81.83 - 83.51 | F = 0.654, df = 5,1358 | 0.659 | 0.630 | η2 = 0.002 |
| Marital Status (4 levels) | 76.27 - 77.97 | 82.16 - 83.60 | F = 1.866, df = 3,1360 | 0.133 | 0.502 | η2 = 0.004 |
| Service Type (4 levels) | 75.57 - 77.71 | 81.61 - 83.14 | F = 3.280, df = 3,1360 | 0.020 b | 0.415 | η2 = 0.007 |
| Education (8 levels) | 75.66 - 77.47 | 81.18 - 83.45 | F = 0.688, df = 7,1356 | 0.682 | 0.816 | η2 = 0.004 |
a Sat. M = satisfaction mean; Resp. M = responsiveness mean; ES = effect size (Cohen's d for t-tests, η2 for ANOVAs). Post hoc Tukey HSD identified a significant difference only between pharmaceutical and social service groups for satisfaction (P = 0.014). HSD = honestly significant difference.
b A P < 0.05 was considered statistically significant.
4.7. Association Between Health System Responsiveness and Client Satisfaction
Contrary to expectations, total HSR and satisfaction scores were not significantly correlated (r = 0.020, P = 0.454). None of the eight domain-level correlations reached significance (r = −0.019 to 0.045, all P ≥ 0.097), despite strong intercorrelations among the HSR domains themselves (r = 0.53 - 0.77, P < 0.001), indicating a genuine null association rather than measurement unreliability. An ANCOVA (satisfaction as the dependent variable; HSR as a covariate; gender and service type as fixed factors; n = 1,364) confirmed that HSR was a non-significant predictor after adjustment (F(1, 1358) = 0.50, P = 0.479, partial η2 < 0.001, B = 0.014, 95% CI [−0.024, 0.052]); the effects of gender (P = 0.064) and service type (P = 0.051) were likewise attenuated to non-significance once HSR was included. Table 1 reflects the full sample, N = 1,384, whereas Table 9 and this ANCOVA use n = 1,364 participants with complete gender/service-type data; 20 cases were excluded for missing data.
5. Discussion
5.1. Psychometric Adequacy
Both instruments showed adequate psychometric properties. The Satisfaction Scale's acceptable alpha (0.737) is consistent with prior validation studies (15). Its four-factor CFA fit was excellent (Comparative Fit Index (CFI) = 1.000, Root Mean Square Error of Approximation (RMSEA) = 0.000); however, because this CFA used the same sample as the EFA, these indices reflect internal consistency rather than independent structural confirmation (see Limitations). The Responsiveness Questionnaire's strong alpha (0.872) replicates findings from cross-cultural adaptations (16, 17). Its eight-factor CFA fit was acceptable, although NFI, TLI, and RMR fell marginally below thresholds. This was attributable to the retention of item 25 to preserve the original WHO structure—a trade-off that warrants further study of cultural equivalence (18).
5.2. Satisfaction–Responsiveness Gap
Responsiveness scores exceeded satisfaction scores, consistent with their conceptual distinction: responsiveness reflects institutionally controlled process standards, whereas satisfaction is a subjective appraisal shaped by expectations (19, 20). This mean-level gap does not imply a linear relationship; no significant HSR–satisfaction correlation was found at any level, reinforcing their conceptual independence. Among populations dependent on humanitarian assistance, this gap may also reflect a “vulnerability-gratitude effect,” whereby recipients report inflated satisfaction relative to objective quality (21). This gap, combined with the institutional context of data collection, raises the possibility of social-desirability bias, particularly among widowed, divorced, and illiterate subgroups.
5.3. Service-Type and Gender Differences
Pharmaceutical-service recipients reported higher satisfaction than social-service recipients, consistent with an outcome-tangibility framework: pharmaceutical services yield discrete, verifiable outcomes, while social services involve diffuse, relational processes (20), aligning with SERVQUAL literature on tangibility as a satisfaction predictor (22). Rehabilitation was the most frequently used service, reflecting a well-documented global pattern of crisis-linked disability burden and undersupply of rehabilitation services (23). Although this finding is not causal given the cross-sectional design, it may inform resource-allocation priorities. Female participants reported marginally higher satisfaction than males, consistent with evidence that women weight relational dimensions more heavily (20); this contrasts with a recent large Saudi study finding the opposite direction (24), underscoring context dependence. Both differences were attenuated to non-significance in the ANCOVA once HSR was included, suggesting they partly reflect confounding rather than robust independent effects.
5.4. Absence of Other Sociodemographic Effects
No differences emerged by residence, age, marital status, or education. This may reflect the geographic breadth of sampling and adaptation-level processes whereby satisfaction converges toward a shared service baseline under dependency, regardless of individual characteristics, including educational heterogeneity. The McMurtry scale's concrete items may also minimize comprehension-related variance across literacy levels.
5.5. Limitations and Directions for Future Research
A key limitation concerns the sampling approach: because participants were recruited through convenience sampling within strata rather than through pure probability sampling, formal statistical generalization of these findings to the full population of IRCS service recipients in Razavi Khorasan Province is not warranted. Results should therefore be interpreted as descriptive of the sampled clients rather than as population-representative estimates. Several limitations constrain generalizability. The cross-sectional design precludes longitudinal tracking, which is particularly relevant given the organizational and funding volatility common in humanitarian settings. Exclusive reliance on self-report within an institutional power differential may introduce gratitude and social-desirability bias (21); future studies should incorporate anonymous digital modes and objective quality indicators. EFA and CFA were conducted on the same full sample (n = 1,384) rather than on independent subsamples, limiting cross-validation. Principal component analysis, rather than common factor analysis, was used for data reduction, which may somewhat overstate the variance attributable to latent constructs. Subgroup and ANCOVA analyses were based on n = 1,364 participants with complete data (1.4% missing). Service-type and gender differences that reached nominal significance in unadjusted analyses may reflect unmeasured confounding and were attenuated once HSR was included as a covariate; these findings should be treated as exploratory. Retention of a psychometrically underperforming responsiveness item, while preserving structural fidelity, limits discriminant precision. Finally, the absence of longitudinal or intervention-linked data means that these findings cannot directly guide quality-improvement interventions.
5.6. Suggestions for Practice and Future Research
For practice, IRCS quality-improvement resources should prioritize rehabilitation and social services, which showed the highest utilization and, for social services, comparatively lower satisfaction. Provider training should specifically strengthen relational and communication skills, given that the Respect and Attention domain showed the lowest relative satisfaction level. Building on evidence that structured, specialized training improves care quality in crisis settings (8), IRCS branches could adopt similar structured training modules for social-service staff. Routine satisfaction monitoring should incorporate anonymous, interviewer-independent (e.g., digital) data-collection modes to reduce the risk of gratitude and social-desirability bias, particularly among widowed, divorced, and illiterate subgroups.
For research, future studies should pursue independent split-sample or multisite cross-validation of both instruments; employ mixed-methods and longitudinal designs to identify other drivers of client satisfaction beyond HSR; empirically test the proposed “vulnerability-gratitude effect” using qualitative or experimental approaches; and replicate this study in other provinces or Red Crescent branches using probability-based sampling to address the convenience-sampling limitation noted above and strengthen generalizability.
5.7. Conclusions
This study provides empirical evidence regarding HSR and client satisfaction in humanitarian services delivered by the Iranian Red Crescent Society in Razavi Khorasan Province. Both instruments showed sound psychometric properties supporting their four- and eight-factor structures. Responsiveness scores consistently exceeded satisfaction scores; however, contrary to expectations, HSR and satisfaction were not significantly correlated (r = 0.02, P = 0.454), even after adjustment for gender and service type, indicating that these constructs are empirically distinct in this context. Unadjusted analyses suggested marginally higher satisfaction among pharmaceutical-service recipients and female participants, but both findings were attenuated to nonsignificance after adjustment and should be treated as exploratory. These findings point to rehabilitation service capacity and quality monitoring as priorities for further evaluation; detailed practice- and research-oriented suggestions are presented in the preceding section.