


1. Background
In the past few decades, Chronic Kidney Disease (CKD) - a disease with progressive decline in renal function - has become an important problem of global public health, not only in developed countries, but also in developing countries with less economic power. Based on studies conducted in different countries, the prevalence of CKD varies from 6.5% in a study in Iran to 33% in Mexico (1, 2). In a large 130,000 person cohort in UK, the age standardized prevalence of stage 3 to 5 CKD was 10.6% and 5.8% in females and males respectively. Additionally, the total disability adjusted life year (DALY) per 1000 population was 17.22 years, higher than most major cancers (3, 4). Of note, is universal epidemiology and pathophysiology of CKD in elderly, whose population proportion is increasing rapidly.
Regarding rapid increase in the elderly population, the epidemiology and pathophysiology of CKD in these individuals are noteworthy. Based on a 10 year study on , it has been shown that the incidence of ESRD in patients older than 65 years have increased from 16.4% in 1996 to more than 29% in 2005 and 2006 (5). Kidney ages as well as the person and becomes much more vulnerable to some insulting disease processes, which is already more prevalent in some patients, e.g. hypertensive patients. Thus, it seems that the normal decline of glomerular filtration rate (GFR) should be taken into account in elderly population for the diagnosis of CKD. It should also be noted that some classified as CKD patients, have not faced to any pathologic processes and their GFR is declining as a physiologic process of nephrosclerosis and aging. On the other hand, the additional negative impact of CKD as an independent and strong risk factor for cardiovascular events should be observed closely, while this population are already at a higher risk of CKD and thus, many may expire before progression to End Stage Renal Disease (ESRD) (6, 7).
2. Objectives
These studies show the importance and complexity of the course and prognosis of CKD in elderly patients. In this cohort study, the CKD progression to death or ESRD was evaluated in elderly Iranian patients and was compared with their younger counterparts.
3. Patients and Methods
This is a retrospective cohort study on CKD patients, referred to a nephrology clinic in Tehran, Iran from December of 2006 until 2012. The inclusion criteria for definition of CKD were small size kidneys on ultrasound study and/or elevated serum creatinine level (primary eGFR of less than 60 mL/min) for at least 3 months. Those younger than 18 years at the time of study or on renal replacement therapy (RRT) were excluded. The other exclusion criteria were proved malignancy at the start of study and less than six months follow-up. The ratio of patients who were followed up regularly (for at least every six months) to those who did not attend the nephrology clinic and failed to be followed up as scheduled (for at least one year) has been chosen to be similar between two groups (7).
All signed the informed consent for permission to use the recorded data. The factor defined as exposure was age of equal or less than 60 versus greater than 60 years. The evaluated outcomes were RRT initiation, death and eGFR trend defined as changes from beginning of the study through follow-up period. Data were gathered using the questionnaire and by reviewing each patient's file in the affiliated nephrology clinic. eGFR was estimated by using Modification of Diet in Renal Disease (MDRD) formula CKD staging was done according to National Kidney Foundation’s modified Kidney Disease Outcomes Quality Initiative (K/DOQI) classification of CKD (8, 9).
3.1. Data Analysis
Data were analyzed using SPSS version 13. Mean and standard deviation of quantitative variables and absolute and relative frequencies of qualitative variables were calculated. For variables with normal distribution, independent sample T-test was used to compare the means between two groups. To compare the frequency of variables between two or more groups Chi-square test was applied. Survival of the patients between two or more groups was compared using Cox regression and Log Rank tests. Multiple measurement analysis was used to evaluate the trend of eGFR during follow up period. P value of less than 0.05 was considered significant.
4. Results
4.1. Baseline Characteristics
During the study period, 502 patients were enrolled, which 58% were male. The mean age of the patients was 61.4 ± 14.7 years and 63% (316 patients) were older than 60 years. Diabetes mellitus was the leading cause of CKD and other etiologies of CKD as glumerolupathies, polycystic kidney diseases, urologic abnormalities and renovascular stenosis were found in about half of the patients. We could not find the cause of CKD in 31% of patients other than long-term hypertension. The prevalence of glomerulopathy and polycystic kidney disease were 8.8% and 3.7% respectively. The mean eGFR was 33.24 ± 11.6 mL/min). Most patients were classified in CKD stage 3 (60%). The mean baseline eGFR of patients younger and older than 60 years did not differ significantly (34.07 mL/min vs. 32.75 mL/min, P = 0.2). Table 1 shows the demographic data of the patients based on their age group.
Table 1. Baseline Data of the Patients in Two Groups
a Data are presented as Mean.
b Data are presented as %.
4.2. Outcome Data
The patients were followed for an average of 37.6 months. During this period, 15 patients with stage 3 or 4 of CKD died; of which 2 patients were younger than 60, 5 patients were between 60 and 75 years and 8 were older than 75 years. Table 2 shows the incidence density of death and RRT based on age group and CKD stage. The incidence density of death was 0.98 (0.6-1.6; CI 95%) for 100 person years. The incidence density of death in patients younger and older than 60 years was 0.34 (0.08-1.3 CI 95%) and 1.4 (0.8-2.3 CI 95%) for 100 person-years, respectively. During the study period, 71 patients with stage 3 or 4 of CKD required RRT and the incidence density of RRT was 4.6 (3.6-5.8 CI 95%) for 100 person-years. The incidence density of RRT in patients older than 60 years was 3.6 (2.5-5 CI 95%) for 100 person-years. The incidence density of RRT in younger patients was 6.3 (4.5-8.6 CI 95%) for 100 person-years, which was about two times more than older counterparts. Figure 1 compares the incidence density of death and RRT according to the age group of the patients.
Table 2. The Incidence Density of Death and RRT by Age Group and CKD Stage of the Patients
| Total Follow up, Personly | Deaths, No. | Incidence Density of Death (CI 95%) | RRTs, No. | Incidence Density of RRT (CI 95%) | |
|---|---|---|---|---|---|
| Age < 60 | |||||
| Stage 3 | 481.1 | 1 | 0.23 (0.03-1.7) | 13 | 3.1 (1.8-5.3) |
| Stage 4 | 168.8 | 1 | 0.6 (0.8-4.1) | 24 | 14.2 (9.5-21.1) |
| Age > 60 | |||||
| Stage 3 | 620.4 | 5 | 0.8 (0.3-1.2) | 14 | 2.2 (1.3-3.8) |
| Stage 4 | 321.9 | 8 | 2.4 (1.2-5) | 20 | 6.2 (4-9.6) |
| All the patients | 1529.3 | 15 | 0.98 (0.6-1.6) | 71 | 4.6 (3.6-5.8) |
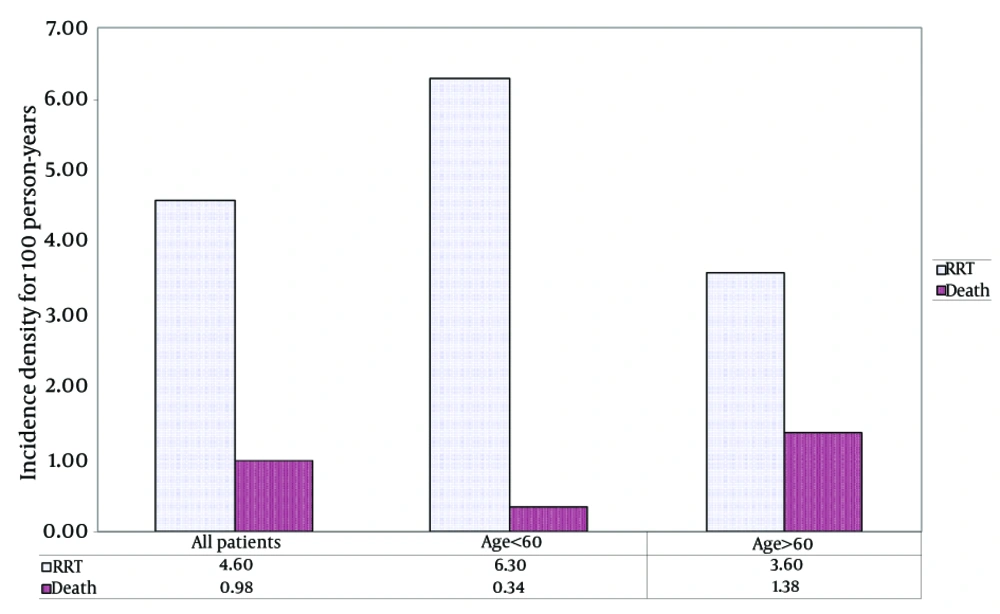
Figure 1.
The Incidence Density of Death and RRT by Age Groups of the Patients
4.3. Survival Data
Figure 2 shows the probability of overall survival of the patients with stage 3 and 4 of CKD by age groups. As showed, the probability of overall survival was greater in younger patients and this difference was statistically significant (P value = 0.029). The hazard ratio of overall survival for patients older than 60 years in comparisons with younger individuals was 4.5 (1.02-20.5 CI 95%). Patients with stage 3 and 4 of CKD who were younger than 60 years had a lower probability for RRT-free survival than their older counterparts with a statistically significant difference (P < 0.005) (Figure 3). The hazard ratio of RRT-free survival for patients older than 60 versus younger patients was 0.5 (0.3-0.8 CI 95%).
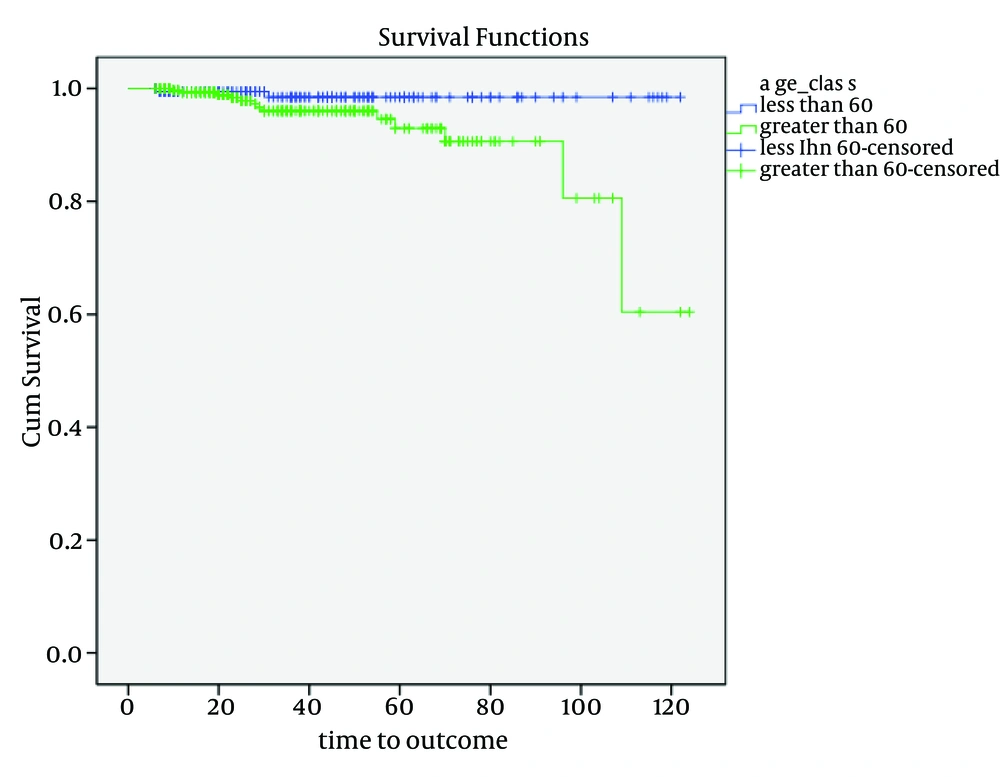
Figure 2.
The Probability of Overall Survival of the Patients by Age Groups
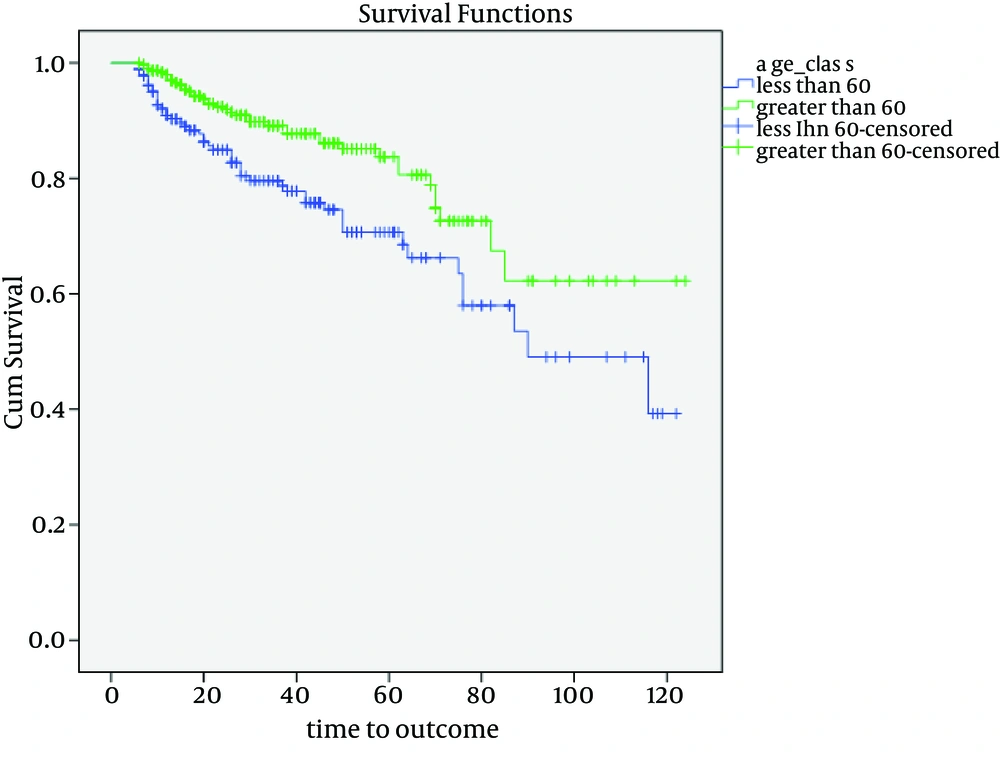
Figure 3.
The Probability of RRT-Free Survival of the Patients by Age Groups
4.4. Decreasing Trend of GFR
The trend of eGFR change was shown in Figure 4. Point 1 in the figure denotes to eGFR of the patients at the beginning of the study and points 2 to 5 are related to annual eGFR of the patients during 4 years of follow-up. The eGFR trend of the patients during the 4 years of follow-up was statistically significant (P value < 0.005). Figure 5 compared the eGFR trend of the patients by age groups. The difference of eGFR trend between patients younger and older than 60 years was statistically significant (P = 0.001)
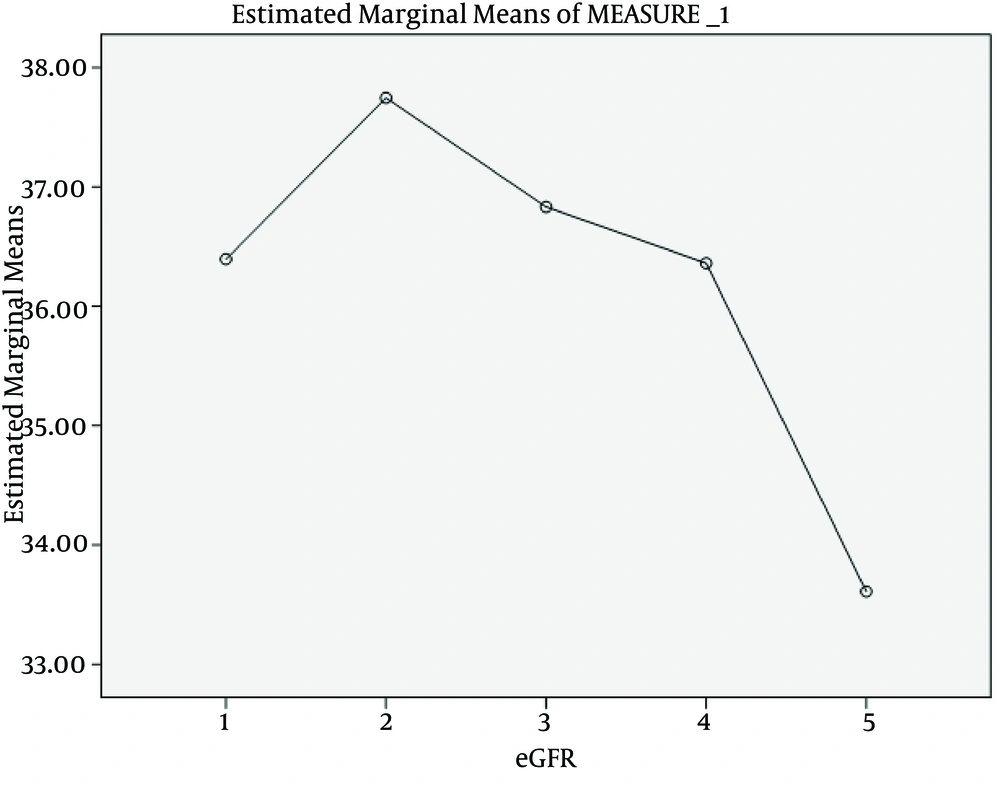
Figure 4.
eGFR Trend of Patients With Stage III and IV of CKD at the Beginning of the Study and During 4 Years Followup
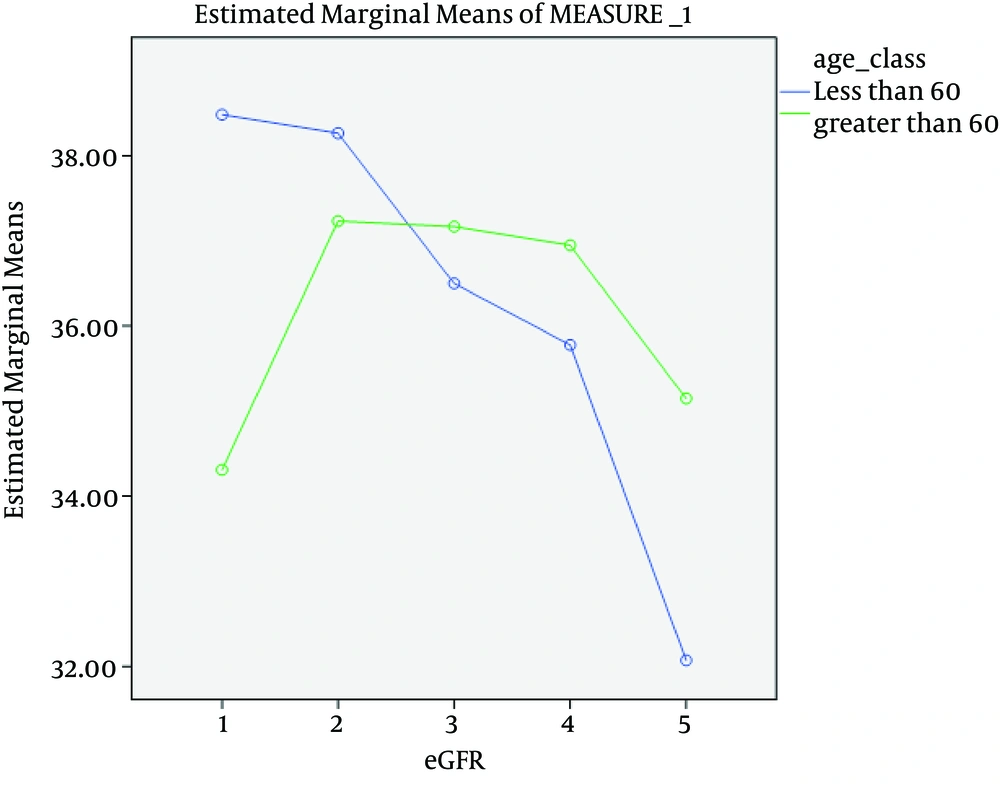
Figure 5.
eGFR Trend of Patients With Stage III and IV of CKD by Age Groups
5. Discussion
The results of this study showed that the incidence density of death in CKD patients was about one for each 100 person-years and older patients had a greater probability for death, but lower probability for ESRD. The results of the cohorts in other countries, like the studies of Dalrymple et al. (10) in the United States, Conway et al. (11) in United Kingdom and Hwang et al. (2) in Taiwan showed greater incidence of death in CKD patients. However, the lower rate of mortality in this cohort could be due to lower mean age of participants. More than half of the deaths in this cohort occurred in those older than 75 years and the mean age of the patients was about 60 years, which was about 10 to 15 years less than the above mentioned studies (Table 3).
Table 3. CKD Cohorts in Comparison
| Sample Size (persons) | Age, y a | Follow up, y | Event | ||
|---|---|---|---|---|---|
| ESRD | Death | ||||
| Present Study | 502 | 61.4 ± 14.7 | 3.13 | Age: ≥ 60 Vs < 60: 3.6 Vs 6.3/100 person-years | Age: ≥ 60 Vs < 60: 1.4 Vs0.34)/100 person-years |
| Dalrymple (10) | 1,268 | 75 | 9.7 | Age: > 65 < 75: 0.5 (0.4 - 0.7) > 85: 1.1 (0.0 - 2.1)/100 person-years | Age:> 65 < 75: 4.8 (4.3-5.3) > 85: 18.1 (13.7, 22.4)/100 person-years |
| Conway (11) | 396 | 71.7% ≥ 65 | 3.76 | Age: > 74 Vs < 65: HR 0.44 (0.23-0.84) | Age: > 74 Vs < 65: HR: 2.40 (1.59-3.62) |
| Hwang (2) | 35,529 | 75.7 ± 5.3 | 2 | - | 2.03/100 person-years |
| Hoefield (12) | 1,325 | 65.1 | 2.17 | 5.1/100 patient-years | 9.6/100 patient-years |
a Data are presented as mean ± SD.
In this study, the incidence rate of ESRD for patients older than 60 years was about half of the younger individuals. At the same stages of CKD, older patients had lower rate of developing to ESRD. Additionally, older patients had a greater RRT free-survival rate (hazard ratio of 0.5). These findings are in favor of other mentioned cohorts that old patients have a slower decline of GFR (Table 3). The greater risk of mortality in older patients might justify the lower incidence of ESRD in these individuals. Elderly patients with CKD would die more frequently and sooner than any need to RRT. The probability of mortality and cardiovascular events in this population were 13 and 6 times of ESRD development respectively (10). O'Hare et al. study was also in favor of the effect of age on slowing down the rate of GFR and risk of death was higher than ESRD (13).
In this cohort, unlike most of other studies, older patients had also a greater incidence of ESRD than death. This would be due to lower rate of mortality in the study, since the rate of ESRD was similar to other studies, which emphasizes the definition of old in different populations. The greater probability of ESRD in younger patients might be due to different speed of progression of CKD in different ages. As seen in figure 3, old patients had a more stable eGFR during the follow up period, while the younger patients had a more rapid decline in their eGFR. It seems that older patients had experienced a renal insult in the remote past and their renal function became relatively stable. However, the decline in renal function of younger individuals was ongoing due to injuries that are more recent and if they survive without RRT, their destiny would be more or less similar to the aged population in different cohorts.
In addition, some of the old patients who were classified by MDRD formula as CKD do not have any renal injury and their eGFR was declined as a physiologic process of aging. The slope of eGFR decline in these patients was slow and the probability of requiring RRT was little. Finally, this study is not a multicentric cohort and despite the prolonged period of follow-up, the sample size was not substantial. However, the two outcomes of death and RRT in young and old patients seem to be the most important indicators for comparisons to conduct studies to determine the course and prognosis of CKD in elderly patients.
The results of this study showed that CKD patients older than 60 years had a greater probability of death in comparison with ESRD. However, the slope of eGFR decline was much slower and the probability of ESRDs decreased by age increase. It seems necessary to conduct more researches in order to redefine the CKD definition and identify the prognostic markers in elderly individuals.


