


1. Background
Developmental dysplasia of the hip (DDH) is one of the most common causes of disability in children (1). This condition results from a developmental defect in the positioning of the femoral head within the hip joint and its surrounding ligaments. Although various pathological factors can lead to this phenomenon, the exact etiology of the disease remains unclear (2). DDH can cause a wide range of disabilities, with its incidence varying geographically, being lowest in South Africa and highest among Native Americans and Caucasians. The overall incidence has been reported to range from 0.6 to 1.1 per 1000 live births, and 30% of total hip joint replacements have been associated with this condition (3). Early diagnosis in childhood allows for non-surgical treatment. However, delayed diagnosis, lack of appropriate treatment, or treatment failure can lead to complications, such as premature osteoarthritis, secondary femoral injuries, and movement disorders, potentially necessitating total hip joint replacement (4). Total hip arthroplasty (THA) is a surgical technique for correcting DDH (5-7). Various THA-based techniques have been developed for managing end-stage osteoarthritis in Crowe DDH type III or IV patients. The primary goal is to achieve long-term stability of the acetabulum by ensuring excellent cap coverage and correctly positioning the hip joint rotation center. Placing the acetabular component in the true acetabulum is considered ideal biomechanically and biologically (8). Femoral shortening, introduced by Eskelinen et al., is a complementary method for THA to address contractions and reduce pressure on the hip joint without stretching the sciatic nerve (9, 10). Several studies have assessed the long-term outcomes of THA for DDH using shortening subtrochanteric osteotomy (STO) (10-15). However, this approach remains challenging, as incompatibility between the diameters of the proximal and distal canals post-shortening STO can lead to difficulties in achieving lasting and secure fixation, increasing the risk of delayed bone healing, malunion, or nonunion (5, 12, 16-19). Additional complications include nerve palsy (17-21), femoral fractures during surgery (12, 16, 22), and dislocation (12, 18, 19, 21). Although various THA-based surgical techniques for end-stage osteoarthritis in DDH Crowe type III or IV patients have been introduced, no gold standard has been established for THA surgery, and study results remain inconsistent (23, 24).
2. Objectives
In the present study, patients with Crowe DDH type III or IV underwent cementless THA using the Watson Jones technique, where the acetabular cap was placed into the true acetabulum via soft tissue release without shortening STO or any femoral osteotomy. We used a conical stem from DePuy Synthes® for the surgery. The Harris hip score (HHS) was compared before and after the surgery. Additionally, complications of this technique, including vascular and neurological injuries and the need for revision surgery, were evaluated.
3. Methods
3.1. Study Setting and Participants
This retrospective cohort study was conducted on patients with DDH type 3 and 4 who were referred to Baqiyatallah Hospital, affiliated with Baqiyatallah University of Medical Sciences, Tehran, Iran. The inclusion criteria included adult patients (> 18 years) with DDH types 3 and 4 who were candidates for THA. Cementless THA was performed using the Watson-Jones technique, and the HHS was calculated and recorded in their medical files before the operation. Patients with missing or incomplete medical files, those without written informed consent, as well as patients with neurovascular diseases, immunosuppressive drug use, congenital bone and articular anomalies, low back pain radiating to the lower extremities, simultaneous fractures, a history of lower extremity fractures, or joint infections, were excluded from the study.
3.2. Sample Size
The sample size was calculated to be 22 subjects based on the study by Zhu et al. (25), and considering HHS as the primary variable, an error rate of 5%, the study power of 80%, μ2 - μ1 = 5, and σd = 8. To increase the power of statistical tests, 32 individuals were enrolled using the below sample size formula.
3.3. Surgical Techniques
All procedures were performed under general anesthesia by a senior surgeon. The approach was anterolateral (Watson Jones), entering between the tensor fasciae latae and gluteus medius muscles in the supine position. Abductors were retracted to access the joint capsule, followed by trochanteric osteotomy on the surface to allow inward placement of the stem, differing from the routine procedure where osteotomy is performed one centimeter above the trochanter. Capsulotomy was carefully done, with complete removal of the posterior and inferior capsule. Subsequently, shaving of the gluteus medius and minimus from the ileum was performed, followed by releasing from the greater trochanter toward the distal part. The release was not completed; thus, the tip of the greater trochanter was also resected. In cases where the corrective procedure for release failed, the iliopsoas were released from the surface of the trochanter, and the muscles were released from behind the femur. Then, cementless THA was performed similarly to routine hip replacement surgeries. Stability tests were conducted, followed by washing, and then the muscular, fascia, subcutaneous, and cutaneous tissues were sutured (Figure 1) (8).
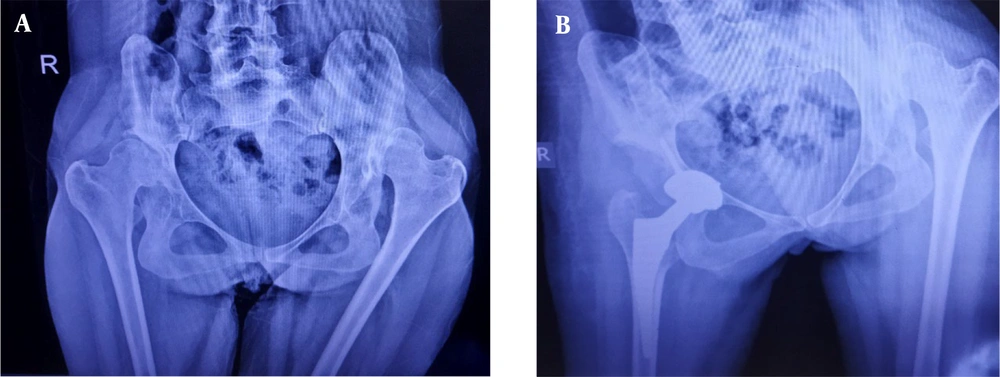
Figure 1.
Radiography of a patient with bilateral developmental dysplasia of the hip before and after cementless total hip arthroplasty without subtrochanteric shortening osteotomy.
3.4. Measurements
The Crowe classification is based on three anatomical parameters: (1) Pelvic height, (2) the junction of the head and neck in the hip joint, and (3) the lower margin of the acetabulum (teardrop). The Crowe classification of DDH is as follows: Group I: Subluxation of < 50% or proximal dislocation < 0.1% of the pelvic height, Group II: Subluxation of 50 - 70% or proximal dislocation 0.1% - 0.15% of the pelvic height, Group III: Subluxation 75 - 100% or proximal dislocation 0.15 - 0.20% of the pelvic height, and Group IV: Subluxation > 100% or proximal dislocation > 0.20% of the pelvic height (26).
The HHS was calculated for each patient before surgery and recorded in the patient's medical files. This scale, developed to evaluate the outcomes of hip surgery, assesses various hip disabilities and the effectiveness of therapeutic methods in adults. The original version, published in 1969, has achieved acceptable validity and reliability. The scale includes several parts, categorized into four items: Pain, function, deformity, and range of motion. The HHS is divided into three sections: The first addresses pain and its effects, while the second and third require a physiotherapist to evaluate the patient's hip joint and function. It measures dysfunction, with higher scores indicating better patient outcomes. The maximum possible score is 100, divided as follows: ≤ 70: Poor; 70 - 80: Relatively good; 80 - 90: Good; and 90 - 100: Excellent (24-29).
During the follow-up period after surgery, with a mean ± SD of 4 ± 1.24 years, patients were seen as outpatients, and the HHS was recalculated. Neurovascular defects and the need for reoperation were also evaluated. All data were recorded on a data collection form and statistically analyzed.
3.5. Data Analysis
Analyses were conducted using SPSS software version 16.0, employing chi-square and Fisher's exact tests for proportions and independent sample t-test, paired t-test, Mann-Whitney U test, and Wilcoxon test for means. Results were presented as mean ± SD for continuous variables and number (percentage) for categorical ones. A P-value of less than 0.05 was considered statistically significant.
3.6. Ethical Consideration
This study was approved and supported by Baqiyatallah University of Medical Sciences, receiving approval from the vice-chancellor of research and technology and the local Ethics Committee (IR.BMSU.BAQ.REC.1400.012). Each patient received an explanation of the surgical technique and signed an informed consent form before surgery. Patient data were accessible only to the researchers and used solely for research purposes. Patients did not incur additional costs for the technique, and all ethical issues were observed.
4. Results
In total, 32 patients were enrolled, with a mean age of 50.34 ± 15.45 years (range: 22 - 78 years), and the majority were women (75%). The mean body mass index (BMI) was 26.66 ± 2.16 kg/m2. The patients were followed for a period ranging from 2 to 7 years. Postoperative nerve defects were observed in only 1 (3.1%) patient. Additionally, hip reoperation was performed for 1 (3.1%) patient due to traumatic dislocation after a fall (Table 1). Two patients had limb length discrepancies, which were treated with orthopedic insoles.
Table 1.Patients’ Demographic Information (n = 32) a
| Variables | Values |
|---|---|
| Age (y) | 50.34 ± 15.45 |
| Minimum | 22 |
| Maximum | 78 |
| Gender | |
| Male | 8 (25) |
| Female | 24 (75) |
| Body mass index | 26.66 ± 2.16 |
| Minimum | 23 |
| Maximum | 33 |
| Side of operation | |
| Right | 16 (50) |
| Left | 16 (50) |
| Nerve defect after the operation | 1 (3.1) |
| Hip reoperation (yes) | 1 (3.1) |
| Limb length discrepancy (LLD) | 2 (6.2) |
a Values are expressed as mean ± standard deviation or No. (%).
As shown in (Table 2), the mean total HHS before the operation was 50.10 ± 12.48, and all patients (100%) were categorized in the poor (score of < 70) group. The score increased to 77.99 ± 15.60 after the operation, which was statistically significant (P < 0.0001), with most patients (56.3%) categorized as good (score of 80 - 89.9). The score of all indicators increased after the intervention, statistically (P < 0.05), except for the total degrees of adduction, which remained the same before and after using the Watson-Jones technique (P = 0.18).
Table 2.Harris Hip Score (HHS) Before and After the Intervention a
| Variables | Before Intervention | After Intervention | Mean Difference | P-Value |
|---|---|---|---|---|
| Pain | 21.56 ± 8.07 | 37.81 ± 7.84 | 16.25 ± 6.60 | < 0.001 b |
| Function | ||||
| Support devices | 5.84 ± 2.5 (0 - 11) | 9.19 ± 3.34 (0 - 11) | 3.34 ± 3.15 | < 0.001b |
| Distance walked | 5.22 ± 2.061 (0 - 8) | 7.09 ± 2.07 (0 - 11) | 1.87 ± 2.83 | 0.001b |
| Limp | 6.19 ± 2.32 (0 - 11) | 7.59 ± 2.98 (0 - 11) | 1.41 ± 1.70 | < 0.001 b |
| Put on shoes and socks | 1.63 ± 1.29 (0 - 4) | 2.13 ± 1.68 (0 - 4) | 0.5 ± 1.14 | 0.0200 b |
| Stairs | 1.41 ± 0.84 (0 - 4) | 2.16 ± 1.19 (0 - 4) | 0.75 ± 0.92 | < 0.001 b |
| Enter public transportation | 0.47 ± 0.57 (0 - 2) | 0.59 ± 0.56 (0 - 2) | 0.13 ± 0.34 | 0.040 b |
| Sitting | 3.59 ± 1.16 (0 - 5) | 4.34 ± 1.18 (0 - 5) | 0.75 ± 0.98 | < 0.001 b |
| Absence of deformity | 1.75 ± 2.02 (0 - 4) | 3.13 ± 1.68 (0 - 4) | 1.38 ± 2.18 | 0.001 b |
| Range of motion (ROM) | ||||
| Total degrees of flexion | 2.11 ± 0.92 (0 - 3) | 2.97 ± 0.82 (1.5 - 3.9) | 0.86 ± 0.49 | < 0.001 b |
| Total degrees of abduction | 0.23 ± 0.29 (0 - 0.6) | 0.36 ± 0.29 (0 - 0.6) | 0.13 ± 0.25 | 0.006 b |
| Total degrees of external rotation | 0.10 ± 0.15 (0 - 0.6) | 0.18 ± 0.17 (0 - 0.6) | 0.08 ± 0.17 | 0.020 b |
| Total degrees of adduction | 0.08 ± 0.08 (0 - 0.15) | 0.09 ± 0.07 (0 - 0.15) | 0.01 ± 0.06 | 0.180 |
| Total score | 50.10 ± 12.48 (18.0 - 67.55) | 77.99 ± 15.60 (30.50 - 97.95) | 27.89 ± 8.39 | < 0.001 b |
| Poor (< 70) | 32 (100) | 7 (21.9) | ||
| Relatively good (70 - 79.9) | 0 (0) | 4 (12.5) | ||
| Good (80 - 89.9) | 0 (0) | 18 (56.3) | ||
| Excellent (90 - 100) | 0 (0) | 3 (9.4) |
a Values are expressed as No. (%) or mean ± standard deviation (minimum–maximum) unless otherwise indicated.
b Statistically significant.
Furthermore, the HHS before and after the intervention was evaluated separately for each gender. In the male group, the mean total score before and after the operation was 50.96 ± 10.59 and 78.64 ± 9.06, respectively (P = 0.01). In the female group, the score increased from 49.81 ± 13.25 to 77.77 ± 17.40, which was statistically significant (P < 0.001) (Table 3).
Table 3.Harris Hip Score (HHS) in Different Genders a
| Variables | Gender | |||||||
|---|---|---|---|---|---|---|---|---|
| Male (n = 8) | Female (n = 24) | |||||||
| Before | After | Mean Difference | P-value | Before | After | Mean ± SD of Difference | P-Value | |
| Pain | 23.75 ± 5.18 | 38.51 ± 5.53 | 14.76 ± 5.23 | 0.010 b | 20.83 ± 8.81 | 37.58 ± 8.57 | 16.75 ± 8.67 | < 0.001 b |
| Function | ||||||||
| Support devices | 6.00 ± 2.60 | 10.25 ± 2.12 | 4.25 ± 2.42 | 0.020 b | 5.79 ± 2.52 | 8.83 ± 3.64 | 3.04 ± 2.77 | 0.001 b |
| Distance walked | 6.13 ± 1.6 | 6.88 ± 2.23 | 0.75 ± 1.86 | 0.410 | 4.91 ± 2.15 | 7.17 ± 2.88 | 2.26 ± 2.35 | 0.002 b |
| Limp | 5.88 ± 2.80 | 7.00 ± 3.60 | 1.12 ± 3.10 | 0.080 b | 6.29 ± 2.20 | 7.79 ± 2.80 | 1.50 ± 2.43 | 0.001 b |
| Put on shoes and socks | 1.25 ± 1.04 | 1.75 ± 1.70 | 0.50 ± 1.44 | 0.160 | 1.75 ± 1.36 | 2.25 ± 1.70 | 0.50 ± 1.48 | 0.060 b |
| Stairs | 1.38 ± 0.74 | 1.75 ± 0.71 | 0.37 ± 0.72 | 0.080 b | 1.42 ± 0.88 | 2.29 ± 1.30 | 0.87 ± 0.99 | 0.002 b |
| Enter public transportation | 0.38 ± 0.52 | 0.50 ± 0.50 | 0.12 ± 0.52 | 0.320 | 0.50 ± 0.60 | 0.63 ± 0.58 | 0.13 ± 0.58 | 0.080 b |
| Sitting | 3.25 ± 0.71 | 4.25 ± 1.04 | 1.00 ± 0.75 | 0.040 b | 3.71 ± 1.27 | 4.38 ± 1.25 | 0.67 ± 1.26 | 0.005 b |
| Absence of deformity | 1.50 ± 2.07 | 4.0 ± 0.00 | 2.50 ± 2.00 | 0.030 b | 1.83 ± 2.04 | 2.83 ± 1.86 | 1.00 ± 1.99 | 0.030 b |
| Range of motion (ROM) | ||||||||
| Total degrees of flexion | 1.94 ± 0.62 | 3.11 ± 0.49 | 1.17 ± 0.55 | 0.010 b | 2.17 ± 1.01 | 2.92 ± 0.91 | 0.75 ± 0.97 | < 0.001 b |
| Total degrees of abduction | 0.30 ± 0.32 | 0.38 ± 0.31 | 0.08 ± 0.31 | 0.320 | 0.20 ± 0.29 | 0.35 ± 0.30 | 0.15 ± 0.30 | 0.010 b |
| Total degrees of external rotation | 0.11 ± 0.16 | 0.15 ± 0.16 | 0.04 ± 0.16 | 0.560 | 0.10 ± 0.14 | 0.19 ± 0.17 | 0.09 ± 0.15 | 0.020 b |
| Total degrees of adduction | 0.08 ± 0.08 | 0.06 ± 0.07 | 0.02 ± 0.07 | 0.320 | 0.08 ± 0.08 | 0.10 ± 0.07 | 0.02 ± 0.07 | 0.040 b |
| Total score | 50.96 ± 10.59 | 78.64 ± 9.06 | 27.68 ± 9.4 | 0.010 b | 49.81 ± 13.25 | 77.77 ± 17.40 | 27.96 ± 14.34 | < 0.001 b |
| Poor (< 70) | 8 (100) | 2 (25) | 24 (100) | 5 (20.8) | ||||
| Relatively good (70 - 79.9) | 0 (0) | 0 (0) | 0 (0) | 4 (16.7) | ||||
| Good (80 - 89.9) | 0 (0) | 6 (75) | 0 (0) | 12 (50) | ||||
| Excellent (90 - 100) | 0 (0) | 0 (0) | 0 (0) | 3 (12.5) | ||||
a Values are expressed as mean ± standard deviation.
b Statistically significant.
5. Discussion
In this study, 32 patients with DDH Crowe III and IV who were candidates for cementless THA underwent the Watson Jones technique without shortening STO. The HHS was compared before and after surgery, and the complications of this technique were evaluated in terms of vascular and neurological injuries and the need for revision surgery. The results showed a statistically significant increase in the mean total HHS score from 50.10 ± 12.48 to 77.99 ± 15.60. All indicators' scores improved post-intervention, except for the total degrees of adduction. A unique aspect of our study was the separate comparison of HHS before and after the intervention for both genders, which is not commonly found in similar research. In the male group, the HHS significantly increased from 50.96 ± 10.59 to 78.64 ± 9.06. Similarly, the female group rose significantly from 49.81 ± 13.25 to 77.77 ± 17.40.
In a study by Huo et al., cementless total hip replacement was performed on 22 hips (17 patients with DDH). The surgeries were conducted via an anterior approach without trochanteric osteotomy, placing the acetabular cup anatomically in the actual acetabulum. Autografts to regenerate a lost acetabular roof were performed in only two patients. The mean HHS increased from 35 before surgery to 96 at the last follow-up, demonstrating satisfactory clinical outcomes (30). Hitz et al. assessed the outcomes of cementless THA without STO over 10 years in patients with DDH Crowe III and IV. In total, 98 THAs were performed using this technique, including 26 high-grade dislocated hips (12 in grade III and 14 in grade IV). The mean follow-up period was 16 years, ranging from 10 to 22 years. The HHS in 23 patients (26 hips) significantly increased from 49 before the intervention to 86 at follow-up, indicating the effectiveness of this technique (8).
Conversely, a retrospective study in India by Jain et al. involved 29 patients aged 19 - 75 (34 hips with Crowe IV) with osteoarthritis secondary to DDH. These patients underwent cementless THA with shortening STO. Baseline evaluations of patients’ hip radiographs revealed an increase in the HHS from 40.80 to 87.96 post-surgery (23). Similarly, Wang et al. evaluated 62 patients with DDH Crowe IV (76 hips from 49 women and 13 men, mean age: 38.8 years) who underwent cementless THA with transverse shortening STO. The mean HHS significantly increased over a 10-year follow-up period from 38.8 to 86.1 (14). In another study by Rasi et al. in Iran, THA with shortening STO technique was used, positioning the cup in the actual acetabulum. Forty-eight patients (52 hips) with DDH Crowe III and IV (unilateral or bilateral) were evaluated. The mean age of the patients was 41 years, and they were followed up for 12 months to three years. In their recent report, the HHS significantly increased from 41.70 to 88.1 (24). Femoral shortening has been suggested to facilitate reduction and protect the sciatic and femoral nerves, as placing the anatomic socket often leads to challenges in hip reduction. Reduction may require significant limb lengthening, which is associated with an increased risk of neurological injuries (8). In Rasi et al.'s study, two patients who underwent shortening STO developed transient peroneal nerve palsy immediately after surgery, but they recovered within two months. No other major complications were observed (24). In Wang et al.'s study, shortening STO led to transient nerve palsy in two patients (14).
Huo et al. demonstrated that no patients experienced sciatic nerve dislocation or infection following THA without shortening STO, although three patients showed radiographic evidence of aseptic loosening (30). Additionally, Hitz et al. reported that only two patients (7.7%) experienced transient nerve palsy; one case involved the sciatic nerve and the other the femoral nerve (8). Our results also indicated that nerve defects following revision surgery occurred in only 1 (3.1%) patient. On the other hand, shortening STO can lead to discrepancies between the diameters of the proximal and distal canals, making secure fixation challenging. This situation can increase the risk of delayed union or nonunion of the osteotomy (8). The rate of nonunion in the femoral shortening STO technique varied across studies. Ollivier et al. observed it in 7% of patients (13), while Mutlu et al. reported rates of 18.6% for nonunion and 20.9% for delayed union. Mutlu et al. also noted that THA with shortening STO led to a higher incidence of complications, but these did not affect clinical outcomes (31). Wang et al., who performed STO with transverse shortening, observed that three patients developed dislocation post-surgery, one patient had nonunion, and four patients sustained fractures during surgery. Furthermore, two patients required a revision operation (14). Our study found that hip reoperation was necessary and performed in only 1 (3.1%) patient, aligning with Hitz et al.'s finding that 6 (23.1%) patients required revision surgery (8). In Jain et al.'s study, no septic or aseptic loosening of implants, implant migration, or heterotopic bone formation was observed until the last follow-up. However, four patients with shortening STO experienced a limb length discrepancy of about 2 cm, requiring the use of a shoe lift (23).
Overall, it appears that THA without shortening STO may have fewer side effects than THA with shortening STO; however, further research is needed to confirm this observation. A limitation of our study was the small number of patients due to limited access to patients' medical files or missing data in those files. Additionally, some patients discontinued their participation during the follow-up period. The follow-up duration ranged from two to seven years, and only one patient required reoperation for traumatic dislocation after a fall. Consequently, conducting a survival analysis similar to previous studies was not feasible (8). Given the discrepancies among studies using different surgical techniques to treat DDH and the lack of a universally accepted gold standard technique for THA surgery, randomized controlled trials comparing procedures with and without subtrochanteric shortening STO over extended follow-up periods are recommended. These trials would help to better understand the various aspects of these methods and their advantages and disadvantages. However, designing large prospective studies with long-term follow-up is challenging and may not be feasible for many patients who are likely to withdraw from the study.
5.1. Conclusion
The results of this study indicate that cementless THA using the Watson-Jones technique without shortening STO can improve the HHS in patients with DDH Crowe III and IV, leading to satisfactory outcomes. Moreover, complications, such as neurological defects and the need for reoperation, were minimal with this method. Therefore, while further studies are conducted, it is recommended that surgeons consider this practical and reliable technique to achieve satisfactory clinical outcomes.

