


1. Background
Colorectal cancer (CRC) is recognized as the third most common cancer and the second leading cause of cancer-related death worldwide, affecting both men and women. Each year, over a million people are diagnosed with CRC, with a disease-specific mortality rate of approximately 33% in developed countries (1). Given the high mortality rate among patients, it is imperative to develop effective diagnostic and treatment methods, particularly for early-stage patients. About 75% of CRC cases are sporadic, while only 25% are familial, indicating that environmental, genetic, and epigenetic factors all contribute to the disease (2).
The progression of CRC involves a series of clinical and histopathological changes, starting with single crypt lesions and advancing to the formation of small, benign tumors known as adenomatous polyps, which can ultimately develop into malignant carcinomas. Colorectal cancer stages are typically classified using the tumor-node-metastasis (TNM) system, as established by the American Joint Committee on Cancer (AJCC) (3). The development of CRC is characterized by the accumulation of mutations and epigenetic alterations in tumor driver genes through a multi-step process. These changes play a crucial role in regulating molecular pathways essential for cancer initiation and progression (4).
Understanding the polymorphisms underlying genetic susceptibility to CRC, based on the known functions of related genes and the disease's pathogenesis, is vital for developing targeted, effective management strategies (5). According to several studies, a nonsynonymous single nucleotide polymorphism (SNP) in ATG16L1 (Thr300Ala), which replaces polar threonine with nonpolar alanine, is associated with the progression of human cancers (6, 7).
On the other hand, epigenetic alterations refer to changes in gene expression that can be inherited without changes to the DNA sequence. These alterations include aberrant DNA methylation, which is involved in the pathogenesis of various cancers, including CRC (8, 9). DNA hypermethylation of 5’-CpG sites typically occurs in promoter regions (10). A high density of cytosine methylation in the CpG islands located within the promoters of tumor suppressor genes can result in the complete inhibition of transcription. Since autophagy genes are believed to play a critical role in tumor suppression, the inactivation of these genes could contribute to the development of cancer. Therefore, investigating the methylation patterns of these genes is highly valuable (11, 12).
Autophagy is considered an anti-malignant mechanism that eliminates damaged proteins, DNA abnormalities, and reactive oxygen species (ROS). Additionally, it has various effects on cancer cells, influencing tumor initiation, progression, and responses to therapy (13). A proper autophagic mechanism is essential for eliminating mutagens and maintaining genomic stability, thereby preventing the accumulation of genetic defects that could lead to malignant transformation. As a result, autophagy may serve as a tumor suppressor in the early stages of tumorigenesis in CRC. Recently, several studies have revealed crosstalk between autophagy-related genes (ATGs) and oncogenes or tumor suppressor genes (14, 15).
The ATG5 and light chain 3 (LC3B) genes play critical roles in the autophagy pathway. The combination of ATG5 and autophagy protein 12 functions as an E1-like enzyme in a ubiquitin-like conjugation process. Additionally, LC3B is recognized as a cytosolic protein that serves as an autophagosomal marker and induces autophagy in most cells (16, 17). These two genes are vital in various physiological processes, such as adaptation to starvation, prevention of neurodegeneration, expression of intracellular antigens, and tumor suppression. Their significance is evident in several types of cancers, including breast cancer (18, 19).
2. Objectives
Understanding the mechanisms underlying the polymorphism and promoter methylation status of the ATG5 and LC3B genes could lead to the identification of effective clinical biomarkers. Since molecular alterations are considered potential CRC biomarkers, the present study aimed to investigate the polymorphism of ATG16L1 and the methylation status of the ATG5 and LC3B gene promoters in blood samples from patients with CRC.
3. Methods
3.1. Sample Collection
Blood sample collection and analyses were performed as part of our case-control study, which included 320 samples—160 CRC patients and 160 healthy individuals—all recruited from Shahid Faghihi Hospital. The demographic and clinicopathological characteristics are presented in Table 1. This study, conducted from September 2022 to January 2023 at Shiraz University of Medical Sciences, was approved by the university's ethical review board. Informed consent was obtained from all participants.
| Variables | Control (n = 160) | Case (n = 160) | Total (n = 320) | P-Value c |
|---|---|---|---|---|
| Age groups (y) | 0.432 | |||
| < 56 | 90 (56.25) | 83 (51.87) | 172 (53.75) | |
| ≥ 56 | 70 (43.75) | 77 (48.13) | 148 (46.25) | |
| Median (range) | 53 (34.5 - 68) | 56 (45 - 65) | 55 (41 - 66) | |
| Mean (SD) | 50.85 (21.57) | 55.24 (15.09) | 53.23 (18.45) | |
| Gender | 0.434 | |||
| Male | 75 (46.87) | 82 (53.75) | 157 (49.06) | |
| Female | 85 (53.13) | 78 (46.25) | 163 (50.94) | |
| Age by gender | ||||
| < 56 and male | 42 (46.66) | 36 (43.1) | 77 (44.76) | 0.664 |
| < 56 and female | 48 (53.34) | 47 (56.9) | 95 (55.24) | |
| ≥ 56 and male | 44 (62.28) | 48 (62.34) | 92 (62.16) | 0.948 |
| ≥ 56 and female | 26 (37.72) | 29 (37.66) | 56 (37.84) | |
| Tumor stage | - | |||
| I | - | 42 (26) | 42 (26) | |
| II | - | 58 (36.4) | 58 (36.4) | |
| III | - | 52 (32.5) | 52 (32.5) | |
| IV | - | 8 (5.1) | 8 (5.1) | |
| Grade | - | |||
| Well | - | 105 (65.63) | 105 (65.63) | |
| Moderate | - | 30 (18.75) | 30 (18.75) | |
| Poor | - | 25 (15.62) | 25 (15.62) |
a Values are expressed as No. (%) unless otherwise indicated.
b Tumor stage and grade are reported only for patients.
c Chi-square test.
Participants were examined histopathologically to confirm the diagnosis and assign samples from any stage of the disease. Rigorous inclusion criteria ensured that participants were over 20 years old and had no diagnosed cancers or other medical conditions, such as inflammatory diseases, autoimmune disorders, endocrine disorders, or cardiovascular events (e.g., myocardial infarction). Subjects with a history of colon or other cancers, cardiovascular diseases, or those taking anti-inflammatory drugs or medications for benign prostate enlargement were excluded from the study.
Peripheral blood samples (5 mL) were obtained from all participants via the median cubital vein and transferred into tubes containing 200 microliters of 5% EDTA. The samples were preserved with an anticoagulant at +4°C and analyzed within 24 hours.
3.2. Genomic DNA Extraction
Genomic DNA was extracted from 2.5 mL of blood using the phenol-chloroform protocol for both tumor and normal samples. The DNA was eluted in 25 µL of AE buffer. Organic extraction involved the use of sodium dodecyl sulfate (SDS) and proteinase K to enzymatically digest proteins and other non-nucleic acid cellular components. The DNA purity was assessed using a 260/280 nm UV absorbance ratio, and its integrity was evaluated by agarose gel electrophoresis.
3.3. Polymorphism Analysis
The A-to-G polymorphism in the ATG16L1 gene, which causes an amino acid substitution at position 300 (Thr300Ala), was genotyped using polymerase chain reaction (PCR) and restriction fragment length polymorphism (RFLP) analysis following the manufacturer's protocol (T300A, rs2241880). A 282 bp fragment of the ATG16L1 gene was amplified using PCR with the following primer sequences:
- Forward: 5′-CTCTGTCACCATATCAAGCGTGG-3′
- Reverse: 5′-TCTAGAAGGACAGGCTATCAACAGATG-3′
Polymerase chain reaction amplification was performed under the following conditions: Preheating at 94°C for 5 minutes, followed by 33 cycles of denaturation at 94°C for 30 seconds, annealing at 58°C for 40 seconds, and extension at 72°C for 30 seconds, with a final extension at 72℃ for 5 minutes. Polymerase chain reaction products were separated on 2.5% agarose gels stained with GelRed and visualized under UV illumination.
After PCR amplification, a PCR–RFLP assay was conducted. The amplicons were digested using the LweI endonuclease and incubated at 37℃ for 1 hour. The LweI enzyme cleaves DNA at the GCATCN5 sequence, producing 172 bp and 110 bp fragments. The digested products were then electrophoresed on a 2.5% agarose gel for 30 minutes and visualized under UV light.
Genotyping was categorized as follows: (1) AA genotype: A single 282 bp band; (2) AG genotype: Three bands at 282 bp, 172 bp, and 110 bp; (3) GG genotype: Two bands at 172 bp and 110 bp.
3.4. DNA Methylation Analysis
Extracted DNA was treated with sodium bisulfite, which converts cytosine to uracil while leaving 5-methylcytosine (5-mC) intact, using 3 M NaOH, sodium bisulfite, and hydroquinone. The methylation status of autophagy-related gene promoters was determined via methylation-specific PCR (MS-PCR). The bisulfite-converted DNA was used to investigate the potential methylated regions of the autophagy-related genes ATG5 and LC3B. Specific methylated and unmethylated primers were designed for the ATG5 and LC3B promoters to amplify the target regions (Table 2).
Table 2.Primer Sequences of Autophagy-Related 5 and Light Chain 3 Genes
| Genes and Primers | MW (Da) | Temperature (℃) |
|---|---|---|
| ATG5 | ||
| FM TAG GAT AGT GTG TTA GGC GGG T | 6.237 | 58 |
| RM ACT ATA ACT CCT CCT TCC GAC T | 6.383 | 57 |
| FU TGA TAT AGA TTT GGT GAG GGT | 6.571 | 55 |
| RU AAA AAC AAA ACT TCT AAA CAC ATC A | 7.588 | 56 |
| LC3B | ||
| FM GAT ATA GAT TCG GTG AGG GC | 6.901 | 62 |
| RM ACG AAA CTT CTA AAC GCG TCA | 6.585 | 60 |
| FU TGA TAT AGA TTT GGT GAG GGT | 7.246 | 63 |
| RU AAA AAC AAA ACT TCT AAA CAC ATC A | 7.161 | 62 |
Abbreviations: ATG5, autophagy-related 5; LC3B, light chain 3.
Polymerase chain reactions were performed using a reaction mixture consisting of 1 μL of modified DNA, 1 μL of each primer, 7 μL of distilled water, and 10 μL of 2 × Amplicon master mix (Amplicon), resulting in a total reaction volume of 20 μL. The PCR amplification program included:
- Preheating at 95℃ for 5 minutes.
- 37 cycles of: (1) Denaturation at 95℃ for 45 seconds; (2) annealing at 60℃ for ATG5 and 58˚C for LC3B for 45 seconds; (3) extension at 72℃ for 10 minutes.
To verify the PCR products, agarose gel electrophoresis was performed. A 100 bp DNA ladder was used to ensure the correct placement of DNA bands. Electrophoresis was carried out at a constant voltage of 75 V for 40 minutes. Following gel electrophoresis, the bands were visualized using a Gel Doc machine under UV light.
3.5. Statistical Analysis
IBM SPSS Statistics 26 was used to perform statistical calculations for each group. Logistic regression was applied to compare the methylation patterns and genotyping between case and control groups, while the chi-square test was used to compare demographic variables based on the groups. In this study, a statistical significance level of P < 0.05 was used to evaluate the results.
4. Results
4.1. Demographic and Clinicopathological Characteristics
As shown in Table 1, the age and gender distribution between the control and intervention groups is not statistically significant, indicating that the distribution of individuals across the groups is comparable. Additionally, tumor stage and grade are reported exclusively for the patient group.
4.2. ATG16L1 Mutation in Colorectal Cancer
We analyzed the ATG16L1 Thr300Ala (G > 898A+) mutation using the RFLP technique (Figure 1) and identified the rs2241880 mutant allele in 24 (15%) of 160 CRC patients compared to 10 (6.25%) in the control group. Table 3 summarizes the frequencies of rs2241880 and the clinicopathological characteristics of samples associated with this mutation. The Thr300Ala mutant allele was more prevalent in well-differentiated tumors (19% = 79.16) than in moderately differentiated (2%) and poorly differentiated (3%) tumors. Additionally, rs2241880 showed no significant correlation with age, sex, or tumor stage.
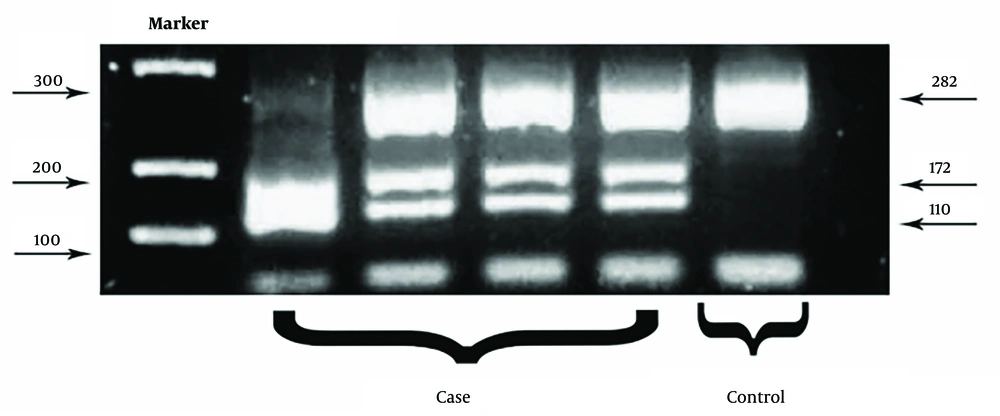
Figure 1.
ATG16L1 Thr300Ala variant genotypes between case and controls
Table 3.Association Between Clinicopathological Factors and rs2241880 in Colorectal Cancer Patients
| Variables | ATG16L1 | |||||||||
|---|---|---|---|---|---|---|---|---|---|---|
| Case (n = 160) | Control (n = 160) | |||||||||
| No. (%) | AA | AG | GG | P | No. (%) | AA | AG | GG | P | |
| Total | 160 (100) | 6 (3.75) | 130 (81.25) | 24 (15) | 160 (100) | 17 (10.63) | 133 (83.12) | 10 (6.25) | ||
| Age groups (y) | 0.759 | 0.722 | ||||||||
| < 56 | 83 (51.87) | 4 (4.88) | 66 (80.49) | 13 (14.63) | 90 (56.25) | 11 (12.22) | 73 (81.11) | 6 (6.67) | ||
| ≥ 56 | 77 (48.13) | 2 (2.56) | 63 (82.06) | 12 (15.38) | 70 (43.75) | 6 (8.57) | 60 (85.72) | 4 (5.71) | ||
| Gender | 0.459 | 0.872 | ||||||||
| Male | 82 (51.25) | 2 (2.44) | 69 (84.15) | 11 (13.41) | 75 (46.88) | 7 (9.33) | 63 (84) | 5 (6.67) | ||
| Female | 78 (48.75) | 4 (5.13) | 60 (76.92) | 14 (17.95) | 85 (53.12) | 10 (11.77) | 70 (82.35) | 5 (5.88) | ||
| Tumorstage | 0.068 | - | ||||||||
| I | 42 (26.25) | 2 (4.76) | 31 (73.81) | 9 (21.43) | - | - | - | - | ||
| II | 58 (36.25) | 3 (5.17) | 51 (87.93) | 4 (6.90) | - | - | - | - | ||
| III | 52 (32.5) | 1 (1.92) | 43 (82.69) | 8 (15.39) | - | - | - | - | ||
| IV | 8 (5) | 0 (0) | 5 (62.5) | 3 (37.5) | - | - | - | - | ||
| Grade | 0.104 | - | ||||||||
| Well | 105 (65.63) | 3 (33.33) | 81 (60) | 21 (79.16) | - | - | - | - | ||
| Moderate | 30 (18.75) | 5 (16.67) | 21 (70.00) | 4 (13.33) | - | - | - | - | ||
| Poor | 25 (15.62) | 1 (4.00) | 20 (80.00) | 4 (16.00) | - | - | - | - | ||
| Location | 0.235 | - | ||||||||
| Proximal | 40 (25) | 1 (2.5) | 36 (90) | 3 (7.5) | - | - | - | - | ||
| Distal | 120 (75) | 5 (4.17) | 93 (77.5) | 22 (18.33) | - | - | - | - | ||
Of the 160 patients, tumor grades were classified as follows: Twenty five poorly differentiated, 30 moderately differentiated, and 105 well-differentiated. According to the results, patients with the GG and AG alleles for the ATG16L1 gene had higher tumor grades compared to those with the AA allele, a difference that was statistically significant (P = 0.034).
Furthermore, based on Hardy-Weinberg (HW) equilibrium analysis, a significant difference was observed between the observed genotype frequencies and the expected genotype frequencies (P < 0.001), indicating HW disequilibrium due to the presence of a disrupting factor (mutation) in the population (Table 4).
Table 4.Hardy-Weinberg Equilibrium Analysis of rs2241880 in Colorectal Cancer Patients
| Genotype | Observed Frequency | Observed Frequency Ratio | Expected Frequency | Expected Frequency Ratio | p | q | Chi-Square Value | P-Value |
|---|---|---|---|---|---|---|---|---|
| Case | 0.5563 | 0.4438 | 66.74 | < 0.001 | ||||
| AA | 6 | 0.038 | 31.51 | 0.197 | ||||
| AG | 130 | 0.812 | 78.99 | 0.494 | ||||
| GG | 24 | 0.15 | 49.51 | 0.309 | ||||
| Total | 160 | 1 | 160 | 1 | ||||
| Control | 0.5218 | 0.4781 | 70.90 | |||||
| AA | 17 | 0.106 | 43.58 | 0.271 | ||||
| AG | 133 | 0.831 | 79.85 | 0.499 | ||||
| GG | 10 | 0.076 | 36.38 | 0.229 | ||||
| Total | 160 | 1 | 160 | 1 |
4.3. Autophagy-Related 5 and Light Chain 3 Methylation Status
The methylation status of the ATG5 and LC3B genes was analyzed in 160 colorectal tumor samples and 160 normal samples using the MSP method. Controls in this study were considered 0% methylated (unmethylated) and 100% methylated. The amplified product was loaded onto an agarose gel, and the results were analyzed (Figure 2).
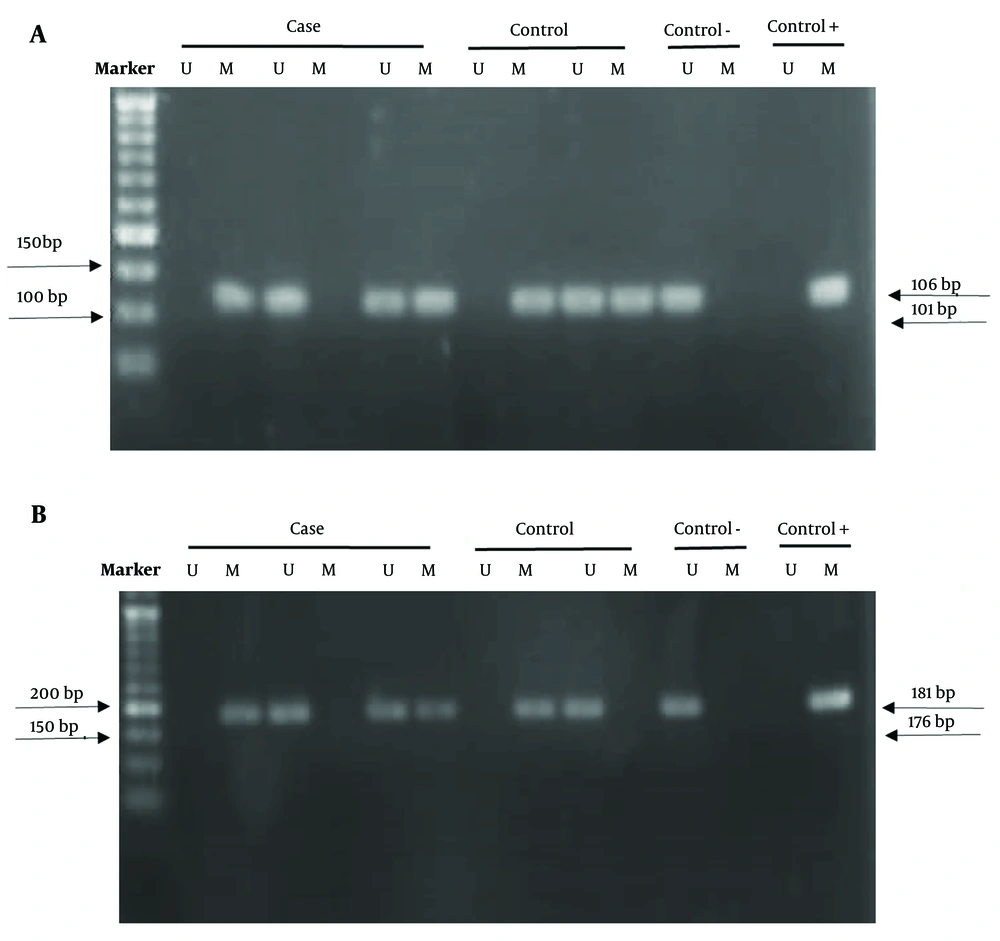
Figure 2.
The CpG island methylation status in the promoter of the A, autophagy-related 5 (ATG5); and B, light chain 3 (LC3B|) genes. M, product of methylated specific primer; U, product of unmethylated specific primer.
The promoter methylation status of the LC3B gene candidate region showed a lower methylation pattern in the case group (37.5%) compared to the control group (85.6%). These findings suggest that individuals with a methylated LC3B promoter have a significantly lower risk of developing CRC compared to those with an unmethylated promoter (P < 0.001).
Conversely, the selected CpG sites for the ATG5 gene promoter exhibited higher methylation levels in cases (80.6%) than in controls (10.6%). Table 5 demonstrates a significant difference in the methylation pattern of the ATG5 gene between the tumor and control groups (P < 0.001). This indicates that individuals with a methylated ATG5 promoter have a higher risk of developing CRC compared to those with an unmethylated promoter, suggesting that methylation could play a role in the pathogenesis of the disease.
Table 5.Methylation Profile of Light Chain 3 and Autophagy-Related 5
| Variables | Groups a | OR (95% CI) | P-Value | |
|---|---|---|---|---|
| Control (n = 134) | Case (n = 153) | |||
| LC3B | ||||
| Methylated | 137 (85.63) | 60 (37.5) | 0.264 (0.161 - 0.432) | < 0.0001 |
| Unmethylated | 23 (14.37) | 100 (62.5) | Ref | - |
| ATG5 | Control (n = 160) | Case (n = 160) | OR (95% CI) | P-Value |
| Methylated | 17 (10.63) | 129 (80.62) | 2.021 (0.045 - 6.829) | < 0.0001 |
| Unmethylated | 143 (89.37) | 31 (19.38) | Ref | - |
Abbreviations: 95% CI, confidence interval; OR, odds ratio; ATG5, autophagy-related 5; LC3B, light chain 3.
a Values are expressed as No. (%).
Since there were no significant findings regarding other variables potentially associated with the outcome, adjusted odds ratios (ORs) could not be calculated. Adjusted ORs account for the effects of other variables and would provide a more accurate estimate of the association between gene methylation and CRC.
4.4. Clinicopathological Characteristics of the Patients and Methylation Status
Table 6 presents the clinical variations observed in the samples. The methylation patterns of these two genes were analyzed in relation to the clinicopathological and demographic characteristics of the patients. According to the statistical data, only the methylation pattern of the LC3B gene showed a significant difference with respect to age (P = 0.019). The methylation level of this gene was higher in individuals over 56 years old. In contrast, no significant correlation was found between the methylation patterns of the LC3B and ATG5 gene promoters and the factors of sex, grade, or stage.
Table 6.The Association Between Autophagy-Related 5 and Light Chain 3 Methylation and Clinicopathological Factors in Colorectal Cancer Patients a
| Variables | LC3B | P-Value | ATG5 | P-Value | ||
|---|---|---|---|---|---|---|
| Methylated | Unmethylated | Methylated | Unmethylated | |||
| Total | 60 (37.5) | 100 (62.5) | 129 (80.62) | 31 (19.38) | ||
| Age groups | 0.019 | 0.727 | ||||
| < 56 | 24 (26.67) | 66 (73.33) | 67 (79.77) | 17 (20.23) | ||
| ≥ 56 | 36 (51.43) | 34 (48.57) | 62 (81.58) | 14 (18.42) | ||
| Gender | 0.788 | 0.407 | ||||
| Male | 31 (36.90) | 53 (63.10) | 65 (95.59) | 3 (4.41) | ||
| Female | 29 (38.16) | 47 (61.84) | 64 (69.56) | 28 (30.44) | ||
| Tumor stage | 0.829 | 0.962 | ||||
| I | 19 (45.24) | 23 (74.76) | 32 (76.19) | 10 (23.81) | ||
| II | 25 (43.10) | 33 (56.90) | 53 (91.38) | 5 (8.62) | ||
| III | 13 (25) | 39 (75) | 39 (75) | 13 (25) | ||
| IV | 3 (37.5) | 5 (62.5) | 5 (62.5) | 3 (37.5) | ||
| Grade | 0.718 | 0.192 | ||||
| Well | 31 (29.52) | 74 (70.48) | 83 (83.84) | 16 (16.16) | ||
| Moderate | 10 (33.33) | 20 (66.67) | 17 (68) | 8 (32) | ||
| Poor | 19 (76) | 6 (24) | 29 (80.55) | 7 (19.45) | ||
| Location | 0.472 | 0.102 | ||||
| Distal | 17 (41.46) | 24 (58.54) | 29 (72.5) | 11 (27.5) | ||
| Proximal | 43 (36.13) | 76 (63.87) | 101 (84.2) | 19 (15.8) | ||
Abbreviations: ATG5, autophagy-related 5; LC3B, light chain 3.
a Values are expressed as No. (%).
5. Discussion
In recent years, several hypotheses have been proposed regarding the mechanisms underlying autophagy and its involvement in CRC (20). The currently accepted hypothesis suggests that autophagy plays dual roles, with a potential contradiction in its function during carcinogenesis. However, the exact mechanisms by which autophagy contributes to cancer remain unknown (21). Autophagy is a surveillance mechanism utilized by normal cells to protect against malignancy. It removes organelles, accumulated proteins, reduces ROS, mitochondrial abnormalities, and DNA damage (22). However, autophagy also facilitates access to essential nutrients that are crucial for cell metabolism and growth (23). As a result, autophagy plays a crucial role in tumor development by preventing cell death and promoting drug resistance. Autophagy-related genes (ATGs) are essential for regulating and organizing the autophagy process (24, 25). Light chain 3, specifically, accumulates on nascent autophagosomes and is one of the most widely used and reliable markers for the autophagy process. Therefore, given the importance of LC3B and ATG5 genes, we examined the methylation status of these genes, along with the ATG16L1 autophagy gene polymorphism, in peripheral blood samples collected from 160 patients with CRC and 160 control samples in Fars province. The methylation pattern of the LC3B gene showed a methylation level of 37.5% in patients, compared to 85.6% in controls. This suggests that the methylation level of this gene decreases during cancer progression. Furthermore, methylation of the LC3B gene was significantly higher in individuals over the age of 56 compared to those under 56 years old. This indicates a significant correlation between age and LC3B gene methylation. Our results are consistent with those of Tanida and Xiao et al., who demonstrated that LC3B is the first autophagy marker proposed in human CRC and is overexpressed compared to normal tissue, particularly in advanced stages (26, 27).
Moreover, Zheng et al. reported that LC3BII is overexpressed in cancer cells, and its expression is associated with tumor differentiation, growth pattern, and advanced stages in cancer tissues (28). In contrast, the analysis of the methylation pattern in the ATG5 gene promoter revealed higher levels in patients (80.6%) compared to controls (10.6%). Therefore, it can be inferred that ATG5 gene methylation plays a significant role in the expression level of this gene and in the occurrence of CRC in the studied population. An association between a mutation in the ATG5 gene and a decreased level of ATG5 expression has been indicated in gastrointestinal cancers, such as CRC, by An et al. (29). However, the study conducted by Mohammadnejad Pahmadani et al. showed no significant difference in the promoter methylation status of the ATG5 and LC3B genes in breast cancer (18). On the other hand, the investigation of the ATG16L1 gene polymorphism (Thr300Ala) and the clinicopathological characteristics of patients revealed significant differences between the case and control samples. These differences were associated with the severity of the disease. In the meta-analysis conducted by Moazeni-Roodi et al., the results indicated that the ATG16L1 rs2241880 polymorphism may not be associated with cancer development (30).
However, our findings demonstrate that the role of this polymorphism in cancer risk may depend on the study population or subgroups, including the type of cancer and ethnicity, across different genetic models. Nicoli et al. reported that the ATG16L1 + 898A > G (Thr300Ala) polymorphism increases the risk of CRC in the Romanian population. This polymorphism primarily affects male carriers of the GG genotype (31). Another study by Jamali et al. revealed that the T allele in ATG16L1 rs2241880 was significantly associated with an increased risk of CRC in the Iranian population (32, 33). However, no significant impact was observed in the Chinese population. We identified HW disequilibrium in the population under study, indicating the presence of a disruptive factor, such as a mutation, within the population. The new knowledge gained from this study can be used to enhance our understanding of CRC. As the risk of recurrence is the most significant challenge in the advanced stages of CRC (34), there is a need for novel and potent biomarkers to aid in treatment management and provide reliable prognostic information for patients.
5.1. Conclusions
In summary, CRC is a rapidly progressing group of cancers. Combined approaches targeting the dysfunction of ATG5, LC3B, and ATG16L1 may be beneficial for patients with methylated or mutated tumors. This could establish the foundation for prospective studies to compare clinical responses to therapeutic interventions. According to our study, changes in the methylation pattern of the ATG5 and LC3B promoters are significant factors in the development of CRC. Furthermore, the mutant genotype of ATG16L1 rs2241880 may increase susceptibility to CRC.

