1. Background
Fluid management in critically-ill patients is a challenging task. Thus, it is highly important to predict which patient will respond to the volume expansion in order to avoid undesired hypovolemia or fluid overload (1).
In the presence of intravascular fluid depletion, the veins respond to volume expansion by increasing their diameter, but the response of the arterial vessels to volume expansion is not yet known (2-4).
The CVP measurement is used for the estimation of intravascular volume. However; the insertion of central venous catheters is time- consuming (5). Therefore, non-invasive assessment of the intravascular volume using bedside ultrasound became popular (6, 7). Previous studies tried to find a relation between the changes in the CVP and the extra-thoracic vessels via the inferior vena cava (IVC) diameter (8-10), IVC collapsibility index (11), internal jugular (IJV), or femoral vein collapsibility (12), IJV/CCA ratio (13), but the assessment was difficult in obese and surgical patients, and their results were not reliable.
To the best of our knowledge, Hilbert et al. (14) reported that the diameter of the CCA responds to intravascular volume expansion with significant dilation in fluid demanding patients. They also recommended further studies to confirm their results.
2. Objectives
The present study attempted to find a relation between the diameter CCA, an easily accessible extra-thoracic artery, and the change in the CVP after fluid administration to help assess the intravascular volume status and find the cutoff value for the diameter of the CCA that can predict the response to fluid administration.
3. Methods
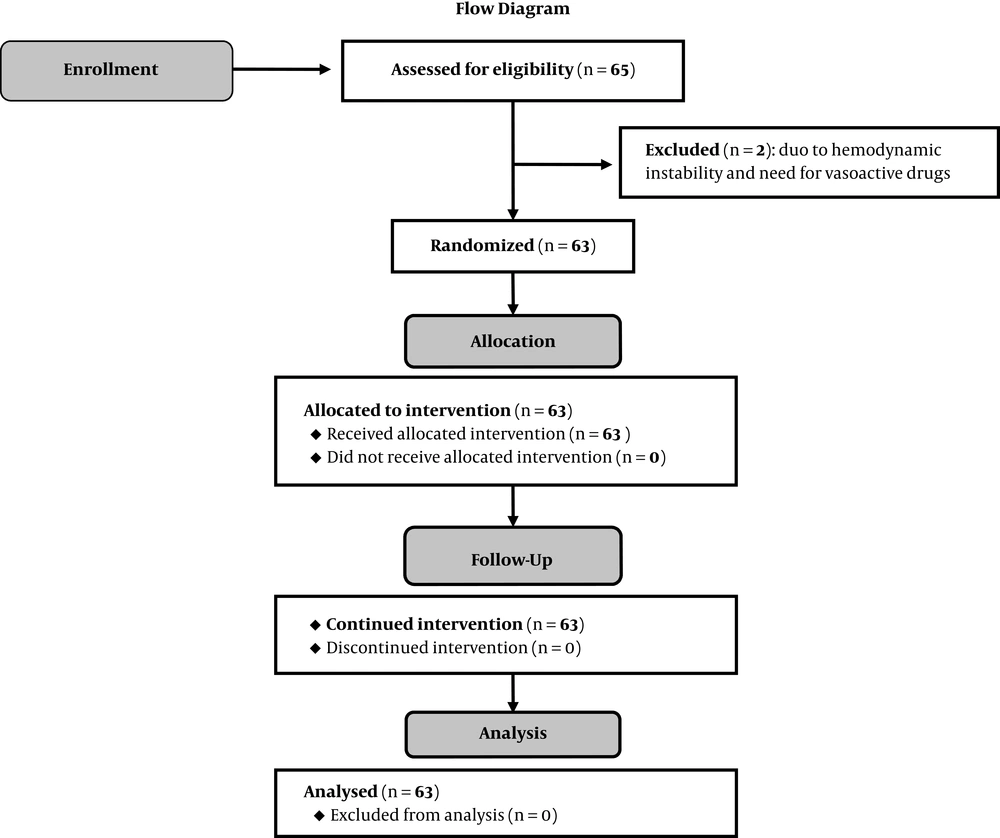
This observational clinical trial was conducted at the surgical intensive care unit (SICU) in Beni-Suef University Hospital, after approval of the local ethics and research committee and the department of the anesthesia, surgical ICU and pain management, and obtaining consents from the patients, it was registered at ClinicalTrials.gov.https://clinicaltrials.gov/ct2/show/NCT04018443From August 2019 to January 2020, the study admitted 65 patients of both sex (age 20 - 60 years) from the American Society of Anesthesiology (ASA) physical status II and III who were able to breathe spontaneously, lie supine, and had CVP catheter (subclavian or internal jugular vein) (the CPV catheter was inserted guided by sonography, a chest x-ray was done to confirm its position and to exclude any complications) from following elective or emergency major surgeries (e.g., abdominal exploration for intestinal obstruction, aorto-femoral bypass, and radical cystectomy. It required post-operative close monitoring and assessment of the intravascular volume status; it had signs of depleted intravascular volume as low urine output < 0.5 mL/kg/h for > 2 h, systolic blood pressure < 90 mmHg or tachycardia (heart rate > 100/min) (15).
The exclusion criteria were patients with a history of carotid artery surgery, significant cardiac disease (cardiomyopathy or moderate to severe valvular heart lesion or having systolic and diastolic dysfunction), significant hepatic disease (Child-Pugh score B or C), renal failure, obesity (BMI > 30 kg/m2), pulmonary hypertension, the patients who need mechanical ventilation or having unstable vital signs during the process of sonograph (patients on vasoactive drugs ) were also excluded.
3.1. Clinical Management
Upon admission to the surgical intensive care unit, the standard monitors were attached, including [5 leads Electrocardiogram (ECG), non-invasive arterial blood pressure, and pulse oximetery]. Heart rate, arterial blood pressure, and oxygen saturation (SPO2), invasive arterial blood pressure, and urine output were monitored.
Laboratory investigations were obtained (complete blood count, coagulation profile, liver, and renal function test, and serum electrolytes), chest x-ray, and arterial blood gases (ABG).
3.2. CVP Measurement
While the patient in the supine position the CVP was measured in cmH2O using water- manometer at the end-expiration (16), the CVP was measured and recorded by SICU residents unaware of the study protocol and the sonographers were blinded to the CVP readings.
3.3. The CCA Diameter
The CCA was visualized with the ultrasound transducer 12 MHz linear probe using a short-axis view perpendicular to the skin in a transverse plane on the patient’s neck lateral to the cricoid cartilage on the contralateral side of the central venous line insertion. While the patient was in a supine position with the head of the bed 30° elevated the diastolic antro-posterior diameter of the CCA was measured in millimeters (mm). The diastolic antro-posterior diameter of the CCA was measured in millimeters (mm) from intimal to intimal edge using the frozen B-Mode image at the end of expiration. The position of the transducer was marked on the skin (each measure was taken three times and the average was recorded; using Philips ultrasound HD5 machine (Philips Ultrasound, Bothell, WA, USA). These measures were done by an anesthesia consultant expert in ultrasound-guided central venous cannulation and trained in measuring the diameter of CCA.
The following data were collected:
1) Demographic data: age, sex.
2) ASA physical status.
3) Type of surgery.
4) Vital signs (heart rate, mean arterial blood pressure): baseline reading after admission to the SICU, then before and after sonographic assessment.
5) CVP (cmH2O): Baseline reading, before and after infusion of normal saline solution (30 ml/min till reaching 5ml/kg) and sonographic measurement of CCA diameter.
The percentage increase in the CVP was calculated using the formula: [(CVPpost/CVPpre) × 100] - 100
6) CCA diameter measurements: Baseline measurement after admission, before (diam pre) and after (diam post) infusion of normal saline solution (30 mL/min till reaching 5 mL/kg).
The percentage increase in CCA diameter was calculated using the formula: [(diam post/diam pre) × 100] - 100 (14).
3.4. Sample Size Calculation
Considering a type, I error of 0.05, a power of 0.95 and based on a Spearman’s rank correlation analysis revealed that the increase in CCA diameter following fluid administration (r = 0.53) as extracted from the previous study (14); a minimum sample size of 40 cases was calculated; the study included 65 patients who were admitted to the SICU from August 2019 to January 2020. The sample size was calculated using G*Power software version 3.1.2 for MS Windows, Franz Faul, Kiel University, Germany.
3.5. Statistical Analysis
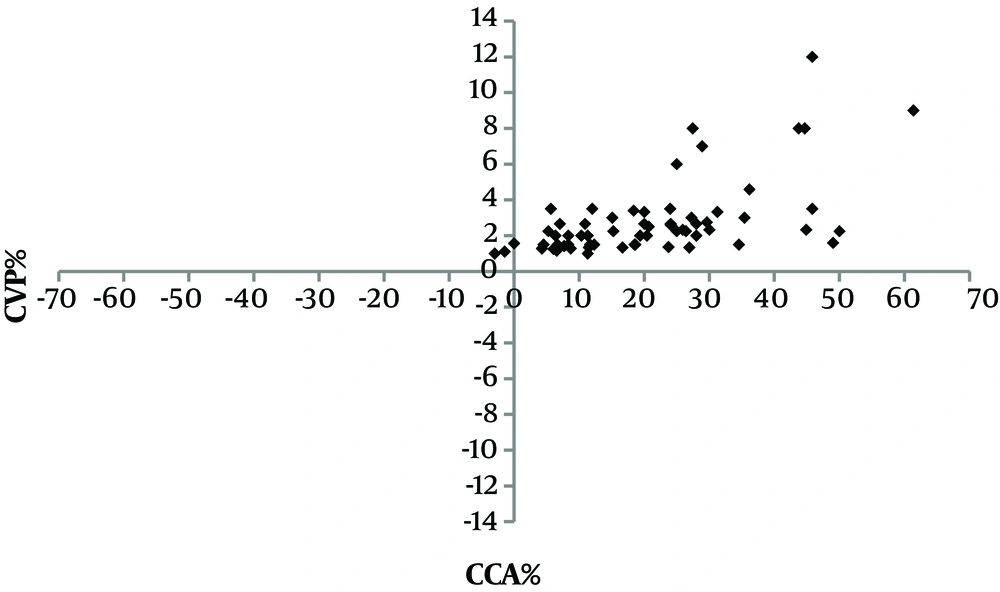
Data were presented as mean ± standard deviation (SD) for the quantitative variables and numbers or percentages for the categorical variables. The changes in hemodynamic parameters were assessed via the t-test. The correlations between CVP and CCA diameter were done by Pearson correlation coefficient, and the percentage increase in CCA diameter and CVP was represented using a 4 quadrant scatter plot. Receiver operator characteristic (ROC) analysis was used to determine the optimum cut off value for CCA% to predict CVP < 8. P values < 0.05 was considered statistically significant. Computer program IBM SPSS (Statistical Package for the Social Science; IBM Corp, Armonk, NY, USA) release 22 for Microsoft Windows was used for statistical calculations.
4. Results
Sixty five patients were admitted to the surgical intensive care unit (SICU) after major surgeries [abdominal exploration for intestinal obstruction (54%), radical cystectomy (25%), aorto- femoral bypass surgeries (21%)]; 2 patients were excluded due to hemodynamic instability and needed for vasoactive drugs (Table 1 and Figure 1).
| Demographic Data and Type of Surgery | Values |
|---|---|
| Age, y | 48 ± 8.6 |
| Gender (male/female) | 40/23 |
| ASA status (II/III) | 21/42 |
| Procedure | |
| Abdominal exploration for Intestinal obstruction | 34 (54%) |
| Major vascular surgery | 13 (21%) |
| Radical cystectomy | 16 (25%) |
aValues are expressed as mean ± SD or No. (%).
The mean of the heart rate (bpm) on admission to the SICU was 105 ± 8, and significantly decreased from 103 ± 8 to 84 ± 7 after fluid administration (P < 0.001) while the mean of MAP (mmHg) was 56 ± 5.9 on admission and significantly increased from 57 ± 5.7 to 63 ± 6.2 after fluid administration (P < 0.001) (Table 2).
Abbreviations: bmp, beat per minutes; CCA, common carotid artery; cmH2O, centimeter water; CVP, central venous pressure; HR, heart rate; MAP, mean arterial pressure; mm, millimeter; mmHg, millimeter mercury.
aValues are expressed as mean ± SD.
bHighly statistically significant compared to before fluid bolus, P value < 0.001.
The mean CVP was 3.7 ± 1.7 (cmH2O) on admission and significantly increased from 4.1 ± 2 to 8.5 ± 1.4 (cmH2O) after fluid administration (P < 0.001) (Table 2). Also, the mean diastolic CCA diameter was 5.4 ± 0.6 (mm) on admission and significantly increased from 5.5 ± 0.7 to 6.6 ± 0.5 (mm) after fluid administration (P < 0.001) (Table 2).
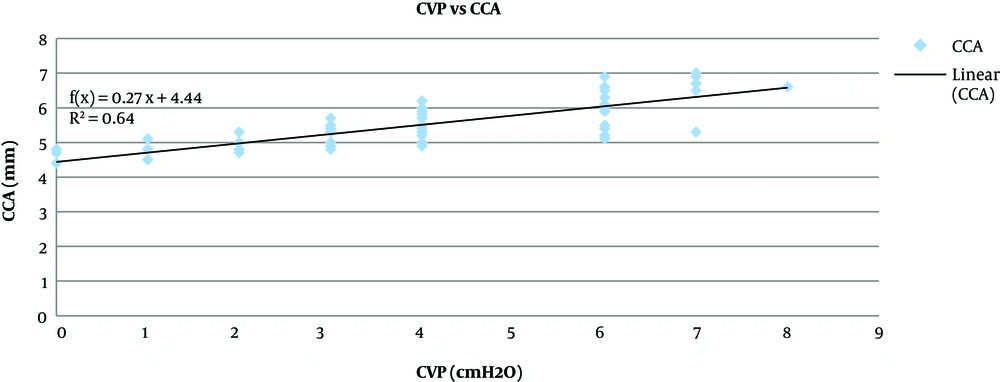
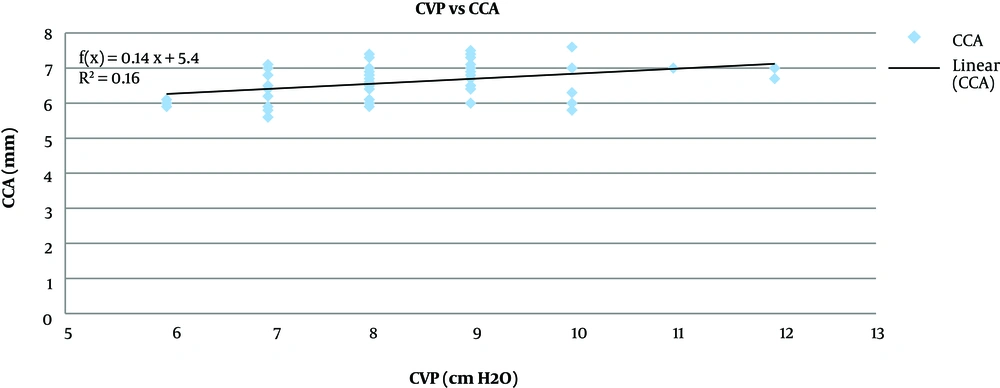
Pearson correlation analysis showed that the CCA diameter before fluid administration had a significant strong positive correlation to the CVP (P < 0.001, r = 0.8) (Figure 2), the increase in CCA diameter after fluid administration had a significant moderate positive correlation with the increase in the CVP (P < 0.001, r = 0.4) (Figure 3).
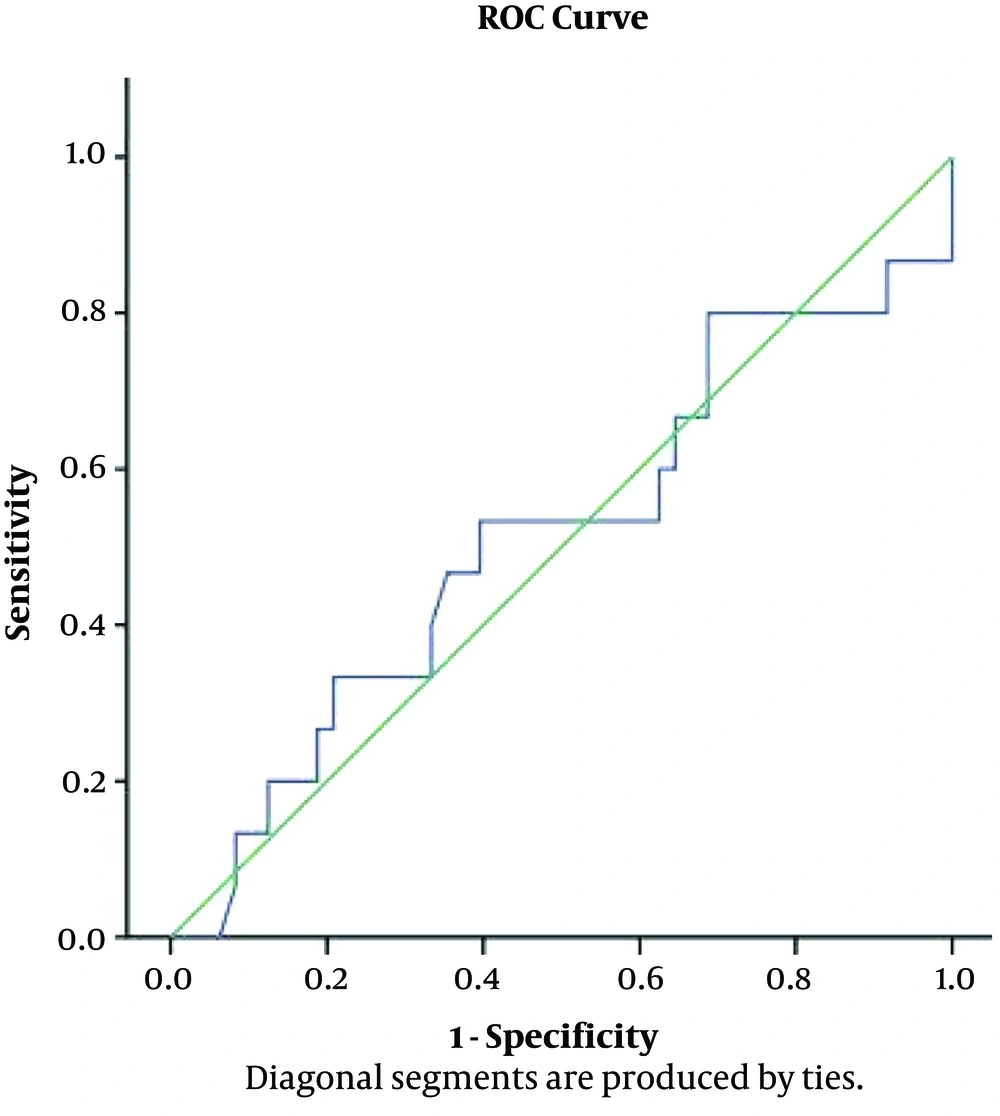
Following fluid administration, the mean CCA diameters increased by 21 ± 14 % and the mean CVP increased by 181.5 ± 64.8%; there was a moderate positive correlation (r = 0.589, P < 0.001) between them as presented by the four-quadrant plot analysis (Figure 4) that evaluated the trending capabilities of the changes in the CCA diameter compared with the CVP. Using ROC analysis to find the accuracy of CCA% to determine the changes in CVP% (CVP ≥ 8), the maximum accuracy was 51%, so it was an invalid test (area under curve 0.513, P value = 0.885). The overall accuracy of the curve is 51.3%, and this is non-significant from the null of hypothesis, and the cut of limit cannot be determined (Figure 5).
5. Discussion
The results of the present study showed that the diameter of the CCA (measured using bedside ultrasound) increased after intravenous fluid expansion; this increase had a moderate positive correlation to the increase in the CVP, but the ROC curve for the changes in the CCA in predicting a CVP ≥ 8 cmH2O was non-significant (area under curve 0.531, P value = 0.885) in spontaneously breathing adult patients who needed close monitoring of the intravascular fluid volume status after major surgeries.
The most commonly used methods for evaluating the intravascular volume are the pulmonary artery catheter (PAC) and CVP. However, PAC is not widely used these days due to the high incidence of complications with its placement (17). Also, CVP catheterization is invasive, expensive, and time-consuming (18).
Bedside ultrasonography is widely used in patient management, especially in emergency and intensive care units (19) because it is simple and noninvasive (20). Some of the noninvasive methods for volume status assessment include an ultrasonographic assessment of IVC diameter (8-10), IVC collapsibility index (11), IJV or femoral vein collapsibility (12), IJV/CCA ratio (13), but no single method is universally accepted since each has its limitations (21).
Following the intravenous fluid administration to correct hypovolemia, 65% - 85 % of the fluid is accumulated inside veins (4), and the increased intravascular volume dilates the veins by the intrinsic pressure (22) while the arterial dilatation is caused by endothelial shear stress that causes an increase in nitric oxide (NO) syntheses and a decrease in endothelin secretion (23). Also, the activation of baroreflex is involved in the regulation of arterial diameter (24).
In the current study, the mean CCA diameters were increased by 21 ± 14 % following fluid administration (30 mL/min till reaching 5 mL/kg). This coincides with the result of Hilbert et al. (14), who reported that CCA diameters increased by 5.0 (1.9 - 10.5) % in comparison to its diameter before fluid bolus.
The mean diastolic CCA diameter (mm) was 5.5 ± 0.7 before fluid administration then increased significantly to 6.6 ± 0.5 after fluid administration (P < 0.001). This was also reported by Hilbert et al. (14) who found that the diameter of CCA diameter increased significantly after the crystalloid solution from 6.2 (5.4 - 7.1) mm to 6.7 (5.8 - 7.3) mm (P = 0.03) in mechanically ventilated patients after cardiac surgery.
Marik et al. (25) used carotid artery Doppler ultrasound to assess hemodynamically unstable patients and observe a significant increase in the diameter of the CCA in the fluid responders. Bapat et al. (26) reported an increase in the diameter of the brachial artery in response to volume loading by a passive leg raising (PLR) maneuver.
In the present study, Pearson correlation analysis showed that the CCA diameter before fluid administration had a significant strong positive correlation to the CVP (P < 0.001, r = 0.8) and showed that the increase in the CCA diameter after fluid administration had a significant moderate positive correlation with the increase in the CVP (P < 0.00, r = 0.4). These findings are contradicted with the results of Bano et al. (13), who reported that there was no significant correlation between CCA diameter and CVP (r = 0.281, P = 0.051). This contradiction was because Bano et al. (13) measured the CVP and CCA diameter once; without explaining the relation of these measurements to fluid administration and their study was on a mixed population of the ventilated and non-ventilated patients, while the present study aimed to assess the change in the CVP and CCA diameter in response to fluid on spontaneously breathing patients. In the present study, after fluid administration, the mean CCA diameters increased by 21 ± 14 % and the mean CVP increased by 181.5 ± 64.8% and there was moderate positive correlation; (r = 0.589, P < 0.001) between them. When using ROC analysis to find the accuracy of CCA% to determine the changes in CVP% (CVP ≥ 8), the maximum accuracy was 51%, so it was an invalid test (area under curve 0.513, P value = 0.885) and the overall accuracy of the curve is 51.3% which was an invalid test to discriminate between normal and abnormal CVP. It cannot be used as a clinical discriminator, and the cut of limit cannot be determined.
5.1. Limitations
It is a single-center study conducted on a limited number of spontaneously breathing patients after major surgeries.
5.2. Conclusions
The changes in the CCA diameter is positively correlated with the changes in the CVP values in response to fluid administration, but the cut- off limit cannot be reached. Thus further studies are recommended on multi-centers in different settings and larger population samples to find the cutoff value for the diameter of the CCA that can predict the response to fluid administration.
