


1. Background
Sevoflurane anesthesia is associated with common postoperative adverse effects. It is estimated that up to 80% of children undergoing surgeries using sevoflurane can develop emergence delirium (1). Emergence delirium (ED) is more common at the pre-school age and is characterized by short-lived psychomotor agitation, alteration of child’s awareness of the surrounding environment, and decreased parents’ satisfaction, resulting in bad subsequent anesthetic experience (2). Emergence delirium can last 30 minutes after surgery. Although it is a self-limited phenomenon, it needs extra nursing care to protect the child from hurting himself or touching the site of surgery (3).
Dexmedetomidine (DEX) is a highly selective α-2 receptor agonist proven to have sedative, analgesic, and anxiolytic effects with minimal respiratory depression. These effects qualify DEX to be used for controlling postoperative ED (4). Recently, DEX has started to be used in perioperative pediatric anesthesia although its sympatholytic effects and the lack of studies evaluating its pharmacological effects have limited its use (5).
Strabismus surgery is one of the most common ophthalmological surgeries in pediatrics. It is commonly associated with postoperative visual disturbance, which leads to an increased risk of ED (1). In addition, around 30% of children undergoing strabismus surgeries can develop postoperative vomiting and pain, which, in turn, aggravate ED. Much research demonstrated that increased preoperative anxiety is commonly associated with increased occurrence of ED (6).
The introduction of agents such as propofol and short-acting opioids like remifentanil and midazolam has enormously changed pediatric anesthesia practice (7). Recently, total intravenous anesthesia (TIVA) has become a good substitute for inhalational anesthesia because of its multiple advantages like smooth emergence from anesthesia, decreased incidence of postoperative vomiting (POV), and postoperative analgesia (8).
2. Objectives
Our study aimed to compare the incidence of ED using inhalational sevoflurane with DEX versus TIVA with remifentanil.
3. Methods
Following approval by the Hospital Ethics Committee of Magrabi Center, Doha, Qatar, in June 2017, 84 patients with ASA class I or II aged 3 - 11 years scheduled for strabismus surgery were enrolled in this randomized, prospective, double-blinded study from October 2018 to January 2020. Written consent was taken from participants’ parents or their legal guardians. Children with physical developmental delay, pre-existing neurological disorders, history of allergy to used medications, and cardiac disorders were excluded from the current study. All patients were fasting for eight hours for food, and four hours for clear fluids before surgery.
Basic monitoring was applied, including pulse oximetry, non-invasive blood pressure, temperature probe, electrocardiogram, and inspiratory and expiratory gas concentration. No premedication was given. Anesthesia in all groups was induced using face masks with sevoflurane (8%) in oxygen. An intravenous cannula was inserted immediately after mask induction. Then, IV glycopyrrolate 5 µg.kg-1 was given to all patients, followed by the insertion of laryngeal mask airway (LMA).
Subjects were randomized into one of the two groups receiving either sevoflurane and DEX (1 mcg.kg-1) using syringe pumps over 10 minutes (group I, n = 42) or TIVA with propofol (4 mg.kg-1 h-1) and remifentanil infusion (0.03 mcg.kg-1 min-1) and a mixture of oxygen in the air (group II, n = 42) in a double-blinded fashion obtained by random number generation.
Mean arterial pressure (MAP), heart rate (HR), and pulse oximetry (SpO2) were monitored just before induction as a baseline, at induction, and every 10 minutes during the surgery. Supplementary fentanyl 0.5 mcg.kg-1 was given intravenously if tachycardia or hypertension occurred. Furthermore, intravenous atropine 0.01 mg.kg-1 was given to treat bradycardia, and 10 ml.kg-1 normal saline solution was administered to treat hypotension. Ondansetron 0.1 mg.kg-1 was given as a rescue medicine for PONV. At the end of the surgery, LMA was removed while the patients were deeply anesthetized. Then, they were brought to the postanesthetic care unit (PACU).
In the PACU, children were received by a research nurse who recorded the post-anesthesia outcome variables including ED, postoperative pain, recovery time, the need for rescue analgesics, satisfaction level of parents, and PONV. The time between the arrival of the patient to the PACU and reaching an Aldrete score of ≥ 9 was defined as recovery time. The Aldrete score is a scoring system used for the clinical evaluation of patients recovering from general anesthesia. It consists of five main items (activity, circulation, consciousness, O2 saturation, and respiration). Each item is given a score of 0 - 2 with a maximum score of 10.
We monitored the postoperative pain using the face, legs, activity, cry, and consolability scale (FLACC). Each item is given a score of 0 - 2 with a maximum score of 10. It was started once the patient was able to do a purposeful movement. Paracetamol 15 mg.kg-1 was given to all children for pain relief in the PACU. Then, ED was assessed using the pediatric anesthesia emergence delirium (PAED) scale, which consists of five main items (Table 1). We asked the parents to grade their levels of satisfaction with the recovery of their children from 0-10 where 0 means very dissatisfied and 10 means very satisfied.
Table 1.The Pediatric Anesthesia Emergence Delirium Scale
| Item | Score |
|---|---|
| The child makes eye contact with the caregiver; The child’s actions are purposeful; The child is aware of his/her surroundings | Not at all (4); Just a little (3); Quite a bit (2); Very much (1); Extremely (0) |
| The child is restless; The child is inconsolable | Extremely (0); Very much (1); Quite a bit (2); Just a little (3); Not at all (4); Extremely (0) |
3.1. Statistical Analysis
A sample size of 42 patients in each group was adequate to obtain an 80% power to detect a significance level (P < 0.05). The IBM SPSS program for Windows (version 25) was used to do statistical analysis. Continuous variables were presented as mean and standard deviation (SD) and analysis was done using student’s t-test. We used the Mann-Whitney U test for comparison between non-normally distributed variables. On the other hand, we used the chi-square test to compare qualitative data. We considered P values of less than 0.05 in any test as statistically significant.
4. Results
Of 98 children who were initially enrolled in this study, 84 children were included in the final study. No significant differences were found between the groups regarding age, sex, weight, ASA class, anesthesia duration, and surgical duration (Table 2).
Table 2.Demographic, Anesthetic, and Postanesthetic Care Unit Data a
| Group I (N = 42) | Group II (N = 42) | P Value | |
|---|---|---|---|
| Age (y) | 6.6 ± 2.5 | 5.8 ± 2.3 | 0.131 |
| Weight (kg) | 31 ± 12 | 29 ± 11 | 0.335 |
| Sex (M/F) | 25/17 | 20/22 | 0.382 |
| ASA class I/II | 33/9 | 36/6 | 0.570 |
| Duration of anesthesi (min) | 49 ± 12 | 47 ± 13 | 0.531 |
| Parents’ satisfactiona | 39 (92.9) | 37 (88.1) | 0.713 |
| Recovery time (min) | 28.3 ± 5.0 | 40.1 ± 6.1 | 0.001 c |
| FLACC b | 1 (1 - 3) | 1 (0 - 4) | 0.661 |
| PAED ≥ 10 | 5 (11.9) | 7 (16.7) | 0.756 |
| PONV | 14 (33.3) | 3 (7.1) | 0.005 c |
| Rescue analgesic | 2 (4.8) | 1 (2.4) | 1.0 |
| Rescue atropine | 14 (33.3) | 4 (9.5) | 0.015 c |
aValues are mean ± SD and No. (%) unless otherwise indicated.
bMedian (interquartile range).
cSignificant differences (P < 0.05)
Parents’ satisfaction was not statistically different; 39 parents were satisfied in group I versus 37 in group II. The PAED score showed no significant difference between both groups where five out of 42 patients (12%) in group I had a score more than 10, and seven out of 42 patients (17%) had the same score in group II. Recovery time in group I (28.3 ± 5.0 min) was significantly shorter than the time in group II (40.1 ± 6.1 min). Besides, PONV was significantly reduced in patients receiving propofol and remifentanil, with a total of three patients only experiencing PONV. In contrast, 14 patients in the DEX group experienced PONV. The FLACC score of pain showed no significant difference between both groups. There was no statistical difference in the use of rescue analgesic between group I (4.8%) and group II (2.4%) (Table 2).
Mean hemodynamic values decreased considerably 10 and 20 minutes after induction compared to baseline in group I after the infusion of DEX (Figure 1). However, HR and MAP in group II showed no significant difference in comparison with baseline (Figure 2). Atropine was used for the treatment of bradycardia in 14 children in group I while four patients only were treated by atropine in group II (P < 0.05) (Table 2).
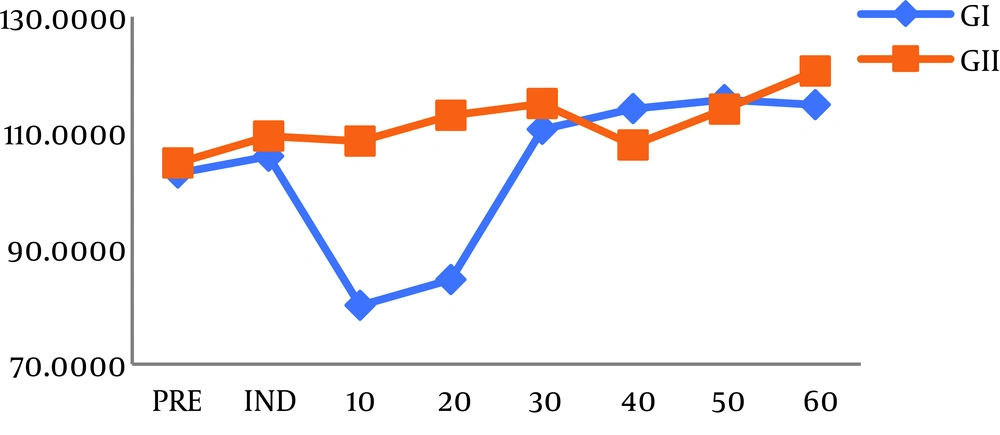
Figure 1.
Intraoperative heart rate values in both groups. *P < 0.05 when group II is compared with group I.
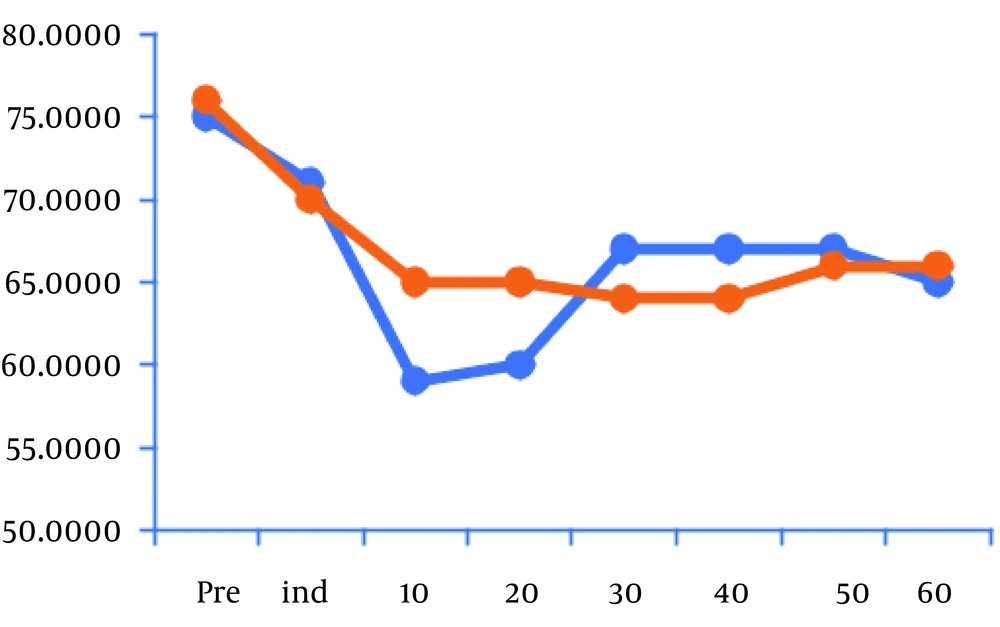
Figure 2.
Intraoperative mean arterial pressure (MAP) values in both groups. *P < 0.05 when group II is compared with group I.
5. Discussion
Emergence delirium and pain commonly affect children after strabismus surgeries, leading to postoperative agitation that needs extra care and additional nursing staff in the PACU to protect the child from hurting himself. Furthermore, parents’ dissatisfaction and apprehensions are also considered (9). Postoperative medication that provides sedation and analgesia without producing respiratory depression is required in such surgeries.
In our study, we used PAED for evaluating postoperative ED. Its reliability and validity have been proven in many studies (10). We found no significant difference between using sevoflurane with DEX and using propofol with remifentanil concerning PAED. Dexmedetomidine has been used for a long time as an anxiolytic, anesthetic, analgesic, and sympatholytic agent (11). The mechanism with which it prevents postoperative ED is through the sedative effect in a way similar to natural sleep (12). In our study, TIVA using propofol plus remifentanil resulted in a decrease in ED. Remifentanil is an ultrashort-acting potent opioid with rapid action. Anesthesiologists are encouraged to use it as an adjunct to TIVA owing to the easiness of dose adjusting, rapid offset, and synergistic effects to propofol, leading to a decrease in its requirement (13). It is not easy to separate ED from pain-related agitation, as there is an overlap in the parameters assessing the two conditions. Therefore, the control of postoperative pain is highly recommended to reduce ED in pediatrics (14).
In our study, two children in group I and one in group II needed rescue analgesics. Olutoye et al. (15) demonstrated that administering DEX 1 mcg.kg-1 to children undergoing adenotonsillectomy resulted in the reduction of the dose of rescue analgesia in the PACU. These results can be explained by the analgesic effect of DEX, which is mediated by the inhibition of substance P release and activation of α-2 receptors in the dorsal horn of the spinal cord (15). Peng et al. (16) demonstrated that propofol-remifentanil is more potent than volatile anesthesia for postoperative pain control. This finding was due to the synergism between propofol and remifentanil caused by the inhibitory effect of propofol on NMDA receptors, which are responsible for hyperalgesia produced by remifentanil. Amri et al. found that the intensity of pain was less in patients doing colonoscopy receiving dexmedetomidine than in other patients who received fentanyl. Dexmedetomidine resulted in a lower dose of rescue propofol when compared to the fentanyl group (17).
Our results showed a significant decrease in HR and MAP in the DEX group 10 and 20 minutes after the induction of anesthesia and 33% of children needed rescue atropine in this group. We infused DEX with loading doses over 10 min to decrease the dose-dependent biphasic, hemodynamic reaction. First, DEX increases blood pressure for a short time through the stimulation of peripheral α2-adrenoreceptor, followed by long-lasting bradycardia and hypotension induced by central α2-adrenoreceptor stimulation (18). This is supported by Chen et al. (19) who stated that DEX should be given as loading doses over 10 min. In their study, initial hypertension, which could happen during rapid infusion of DEX, was not noticed.
Nausea and vomiting are considered major reasons for postoperative discomfort in pediatrics. Furthermore, parents consider vomiting as the most relevant outcome symptom postoperatively. It directly affects parents’ satisfaction (20). Compared with sevoflurane, TIVA and remifentanil reduced the risk of PONV by 26% in our study. It is now well established whether TIVA with propofol decreases the incidence of postoperative nausea and vomiting as compared to inhalational anesthesia (21). Therefore, TIVA with propofol is the anesthetic of choice for high-risk PONV patients or surgeries (7).
In conclusion, both total intravenous anesthesia using propofol and remifentanil and inhalational anesthesia using sevoflurane in addition to dexmedetomidine had the same ED outcome but DEX was associated with a higher incidence of hypotension, bradycardia, and PONV when compared to TIVA and remifentanil.

