1. Background
The assessment of intravascular volume status is important for critically ill patients to guide fluid therapy (1). Different techniques are helpful for this purpose, including physical examination and invasive and non-invasive methods. Invasive methods include measurements of pulmonary artery occlusion pressure (PAOP) or central venous pressure (CVP), but both techniques can result in multiple complications (2-6). Recently, non-invasive techniques have been introduced into clinical practice; these include an ultrasonographic assessment of the IVC collapsibility index and femoral or internal jugular vein (IJV) collapsibility (7-11). Ultrasound measurements of the IVC diameter or collapsibility index are used to guide fluid therapy and to diagnose different types of shock, but measurements of the IVC are difficult in obese patients or patients with high intra-abdominal pressure (8). Recently, a significant relationship between the internal jugular vein/common carotid artery (IJV/CCA) cross-sectional area (CSA) ratio and the CVP was reported in paediatric burn patients (12). However, there are limited reports about the estimation of the IJV/CCA CSA ratio in the adult population. To the best of our knowledge, there are no available data comparing the IJV/CCA CSA ratio and the IVC diameter to date for evaluating the intravascular volume in spontaneously breathing adult patients following major surgeries. Therefore, the rationale for this study was to assess the correlation between the IJV/CCA CSA ratio and the IVC diameter for estimating intravascular volume status in spontaneously breathing adult patients following major surgeries as a primary outcome. The correlations of the IJV/CCA CSA ratio and IVC diameter with CVP were also assessed as a secondary outcome.
2. Methods
This clinical trial was conducted from December 10, 2018, to July 30, 2020, at the surgical intensive care unit (ICU) in Beni-Suef University Hospital, Egypt. The study was approved by the anesthesiology, surgical ICU, and pain management departments and the local ethics and research committee (November 4 2018/FWA00015574), and it was registered at ClinicalTrials.gov under ID: NCT03766451. Written informed consent was obtained from 35 adult patients of both sexes (age range: 20 - 60 years) according to the criteria of American Society of Anaesthesiology (ASA) physical status II - III, who were breathing spontaneously and were admitted to the surgical ICU after elective or emergency major surgeries [pelvic-abdominal surgeries (e.g., radical cystectomy, nephrectomy) and orthopaedic surgeries (e.g., the fixation of a fractured femur)] for postoperative assessment of intravascular volume status. Patients were excluded if they had a history of obstructive or restrictive lung disease, cardiac disease (e.g., recent myocardial infarction within 3 months and tricuspid regurgitation), hepatic disease, renal impairment (creatinine > 2 mg/dL), body mass index (BMI) > 30 kg/m2, pneumothorax or mediastinal masses, requirements for mechanical ventilation or vasopressors and inotropes, pregnancy, sepsis, and septic shock.
CVP was measured in cmH2O at the end of expiration using a water manometer at the mid-axillary level and 4th intercostal space while the patient was lying supine (13, 14). The IJV/CCA CSA ratio was measured at the end of inspiration and at the end of expiration using a Philips Ultrasound system (Bothell, WA, USA) and a high-resolution 3 - 12 MHz linear probe. The patients were placed in the supine position, and ultrasound gel was applied to the side of the neck contralateral to the central venous catheter. After the identification of the IJV, the CSA of the IJV and CCA were measured in transverse view at the lowest level of the thyroid cartilage (11). The maximum and minimum IVC diameters were measured 3 - 4 cm from the junction of the IVC with the right atrium using an M-mod Philips HD5 ultrasound machine and a 2 - 5 MHz ultrasound convex probe (11). All measurements were evaluated by an intensive care specialist and consultant with the help of a trained surgical ICU resident. For each measurement, three readings were recorded, and their mean value was calculated by the surgical ICU resident, who was blinded and unaware of the study protocol. The following data were recorded by the resident who was unaware of the study protocol): (1) demographic data (age, sex, BMI, and ASA physical status); (2) type of surgery; (3) vital signs including heart rate (beats/min), mean arterial pressure (MAP) (mmHg); (4) central venous pressure (cmH2O): If the CVP was < 8, a 4 mL/kg, isotonic saline bolus was administered over 10 minutes (15, 16); (5) IVC maximum and minimum diameter (mm); (6) common carotid artery (CCA) surface area (mm2); (7) IJV surface area (mm2) at inspiration and expiration; and (8) IJV/CCA CSA ratio at inspiration and expiration.
2.1. Statistical Analysis
Sample size was calculated using G*Power software version 3.1.2 for MS Windows, Franz Faul, Kiel University, Germany. The published data indicated that the coefficient of determination between the IJV/CCA CSA ratio and the CVP was 0.728 (9), while it was 0.827 between the IVC diameter and the CVP (11). Assuming that this was the true population coefficient between the IJV/CCA CSA ratio and the IVC diameter and considering a power of 99.5% and an α = 0.05, 30 patients were needed. Accordingly, the number of patients was increased to 35 to compensate for any participant dropouts. Data are described in terms of the mean ± standard deviation (SD) or frequencies and percentages. Numerical data were tested for normal distribution using the Kolmogorov-Smirnov test. Comparisons of values before and after fluid therapy were performed using a paired t-test. Correlation between variables was calculated using the Pearson moment correlation equation for linear relation of normally distributed variables and the Spearman rank correlation equation for non-normally distributed variables (r: Pearson's coefficient: 0.01 - 0.19 very weak correlation; 0.20 - 0.39: weak correlation; 0.40 - 0.69: moderate correlation; 0.70 - 0.89: strong correlation; 0.90 - 1.00: very strong correlation). P-values less than 0.05 were considered as statistically significant, and values less than 0.01 were considered as highly significant. Receiver operator characteristic (ROC) analysis was used to determine the optimum cut-off value for the IJV/CCA CSA ratio at inspiration and expiration in predicting a CVP of 8 - 12 cmH2O after fluid therapy. Statistical calculations were performed using IBM SPSS software version 22 for Microsoft Windows.
3. Results
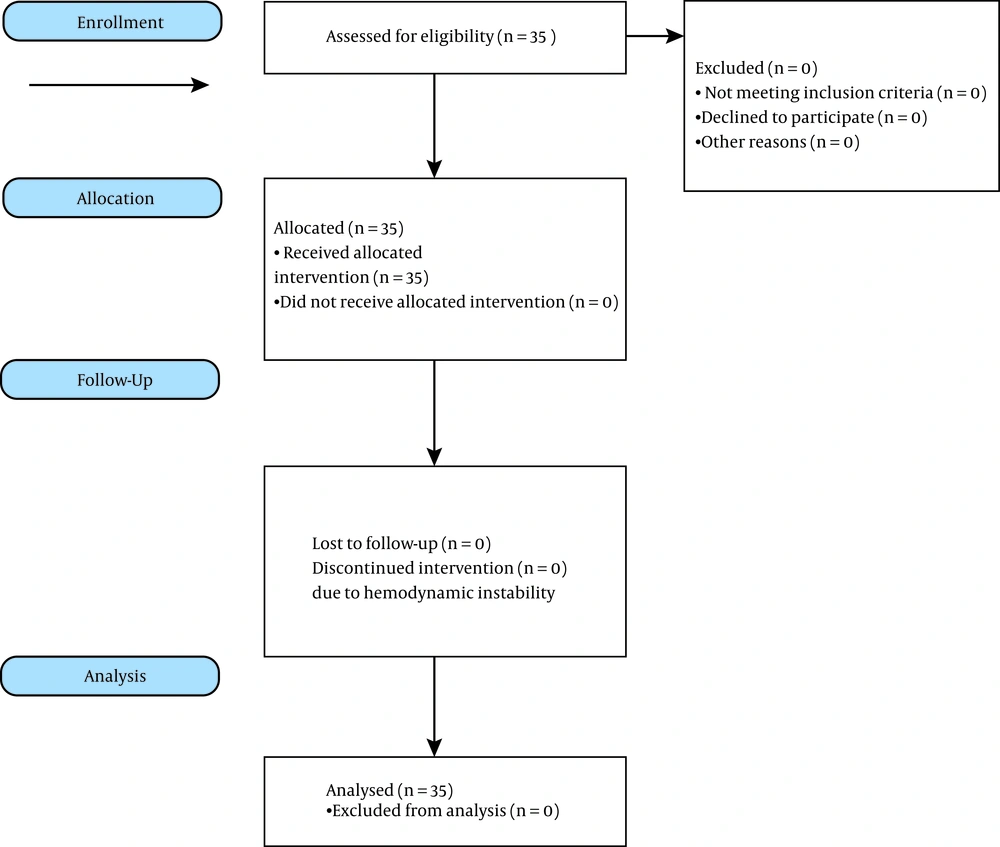
The patients included 22 (62.86%) males and 13 (37.14%) females. As shown in the flow diagram (Figure 1), all patients completed the study.
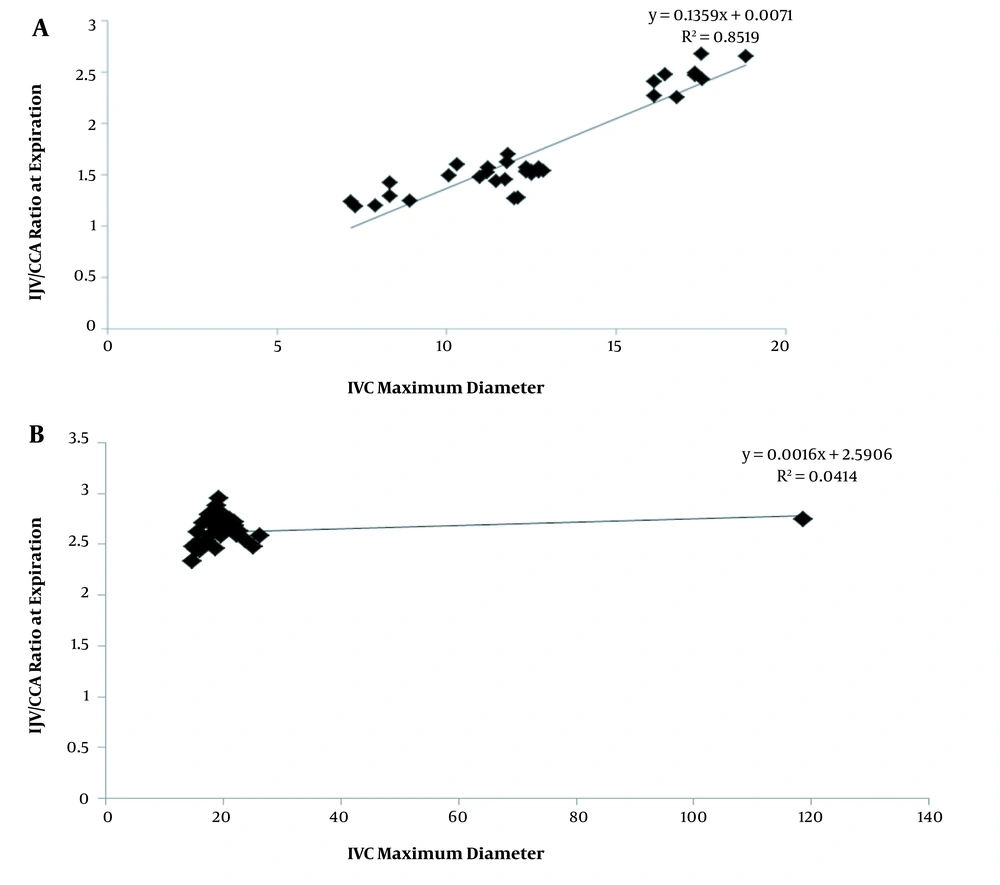
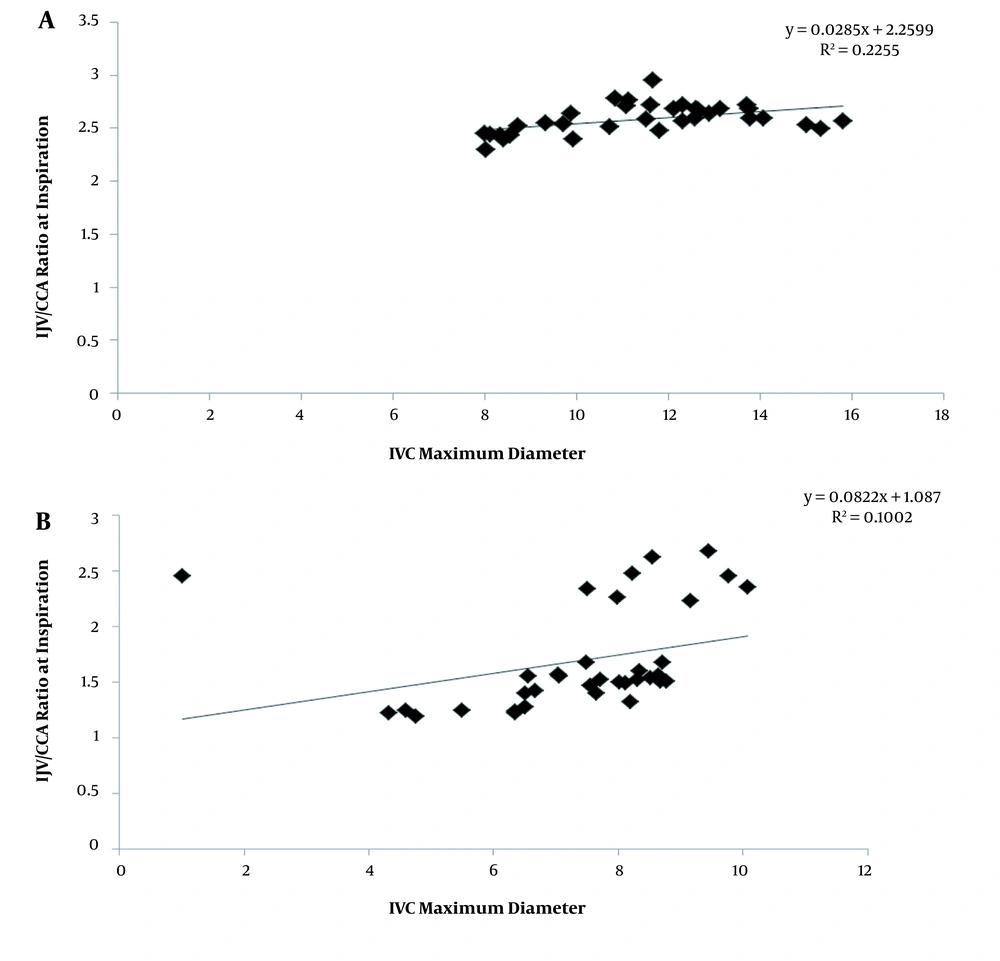
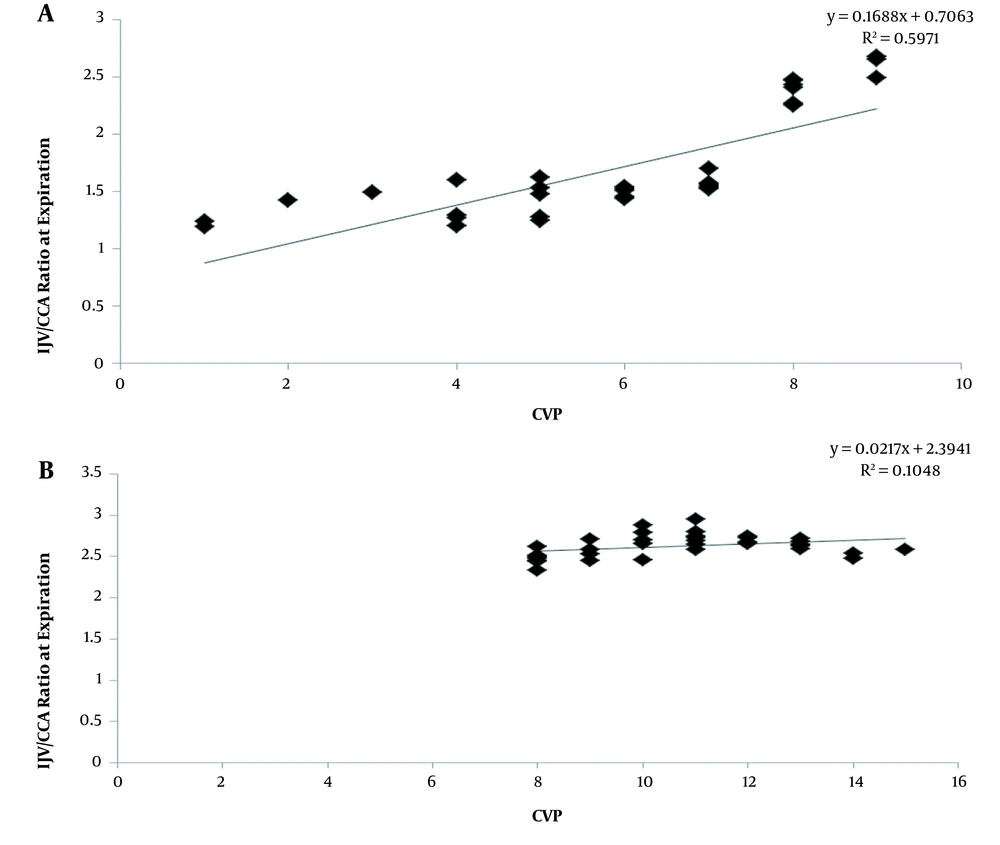
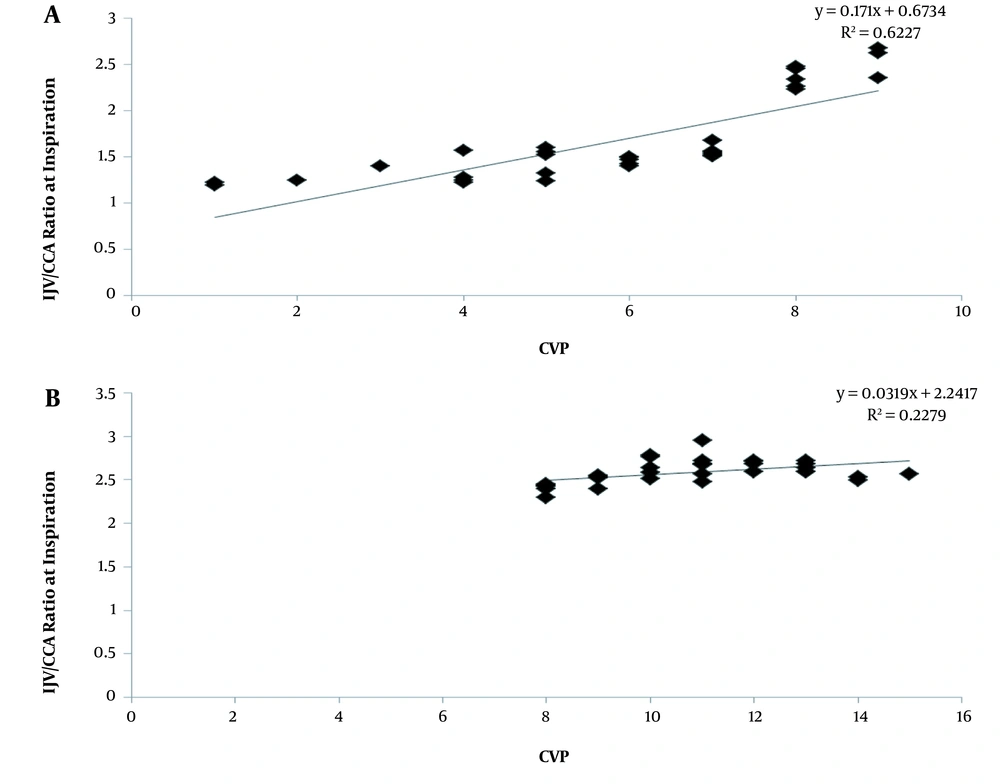
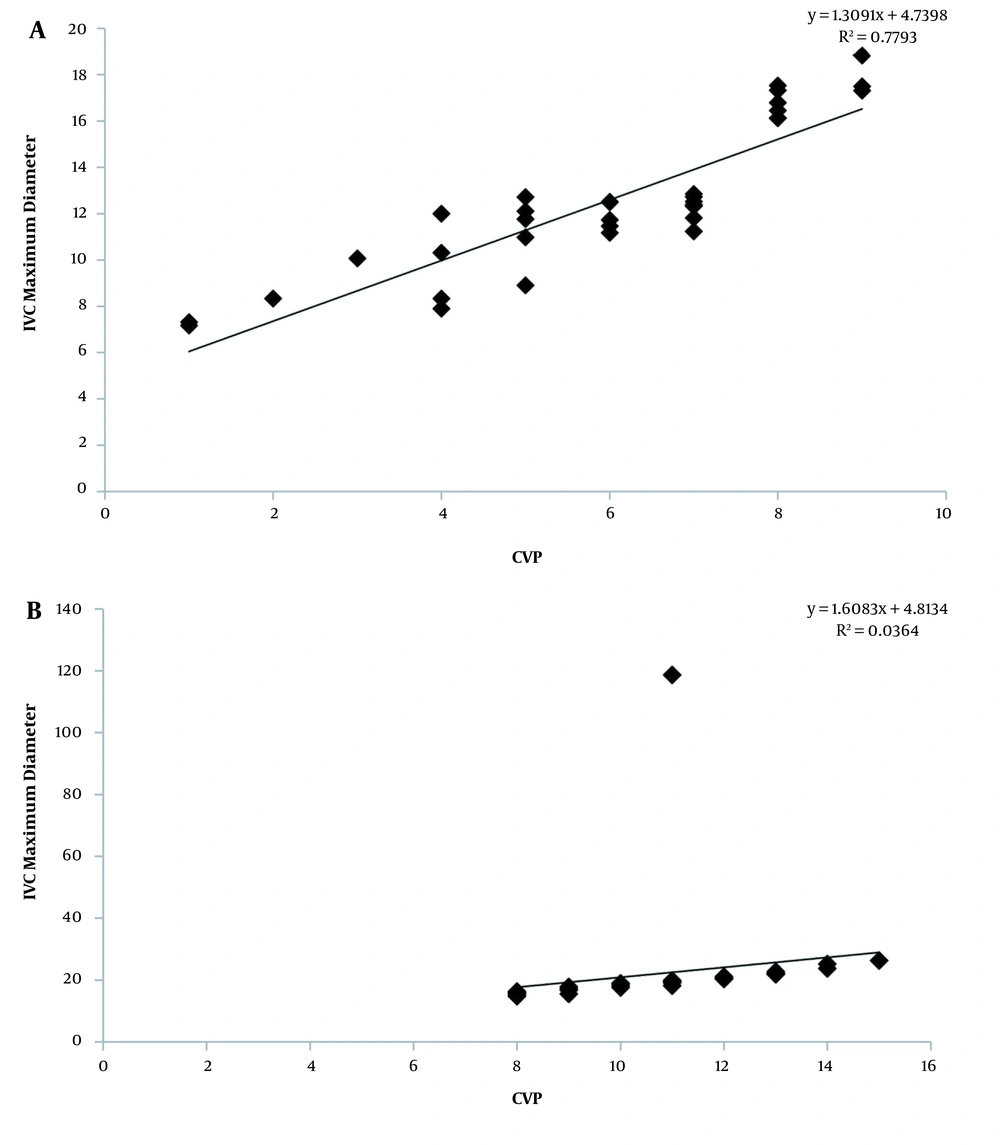
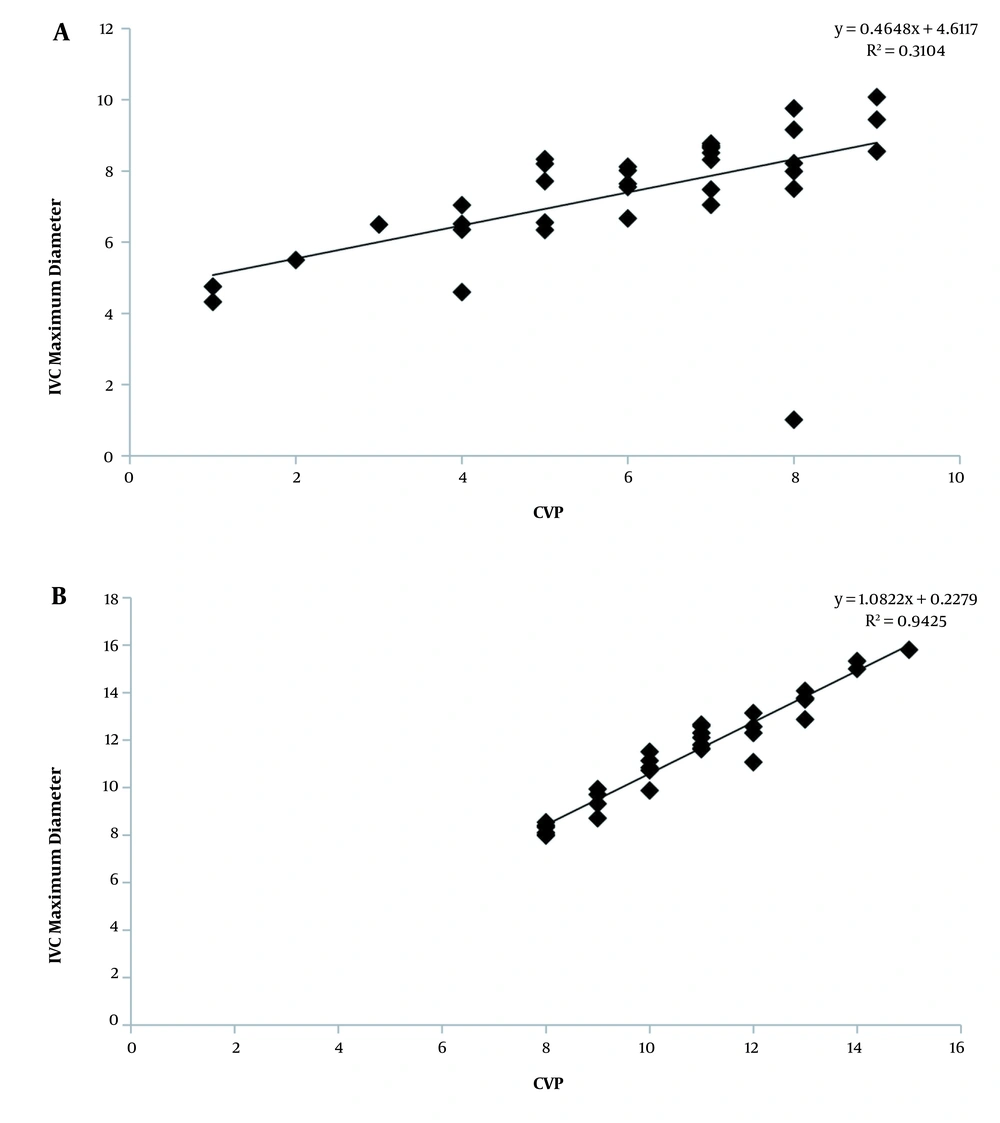
The mean age was 42.230 ± 9.277 years, the mean BMI was 21.378 ± 2.143 (kg/m2), and there were 20 (57.14%) ASA II and 15 (42.85%) ASA III patients. Ultrasound measurement of the IJV/CCA CSA ratio at expiration and inferior vena cava maximum diameter (IVC MAX. D) showed that there was a positive correlation between the IJV/CCA CSA ratio and the IVC MAX. D before and after fluid infusion (r = 0.923, P < 0.001 and 0.390, P = 0.021, respectively) (Figure 2 and Table 1). There was a positive correlation between the IJV/CCA CSA ratio at inspiration and inferior vena cava minimum diameter (IVC MINI. D) before and after fluid infusion (r = 0.605, P < 0.001 and 0.496, P = 0.002, respectively) (Figure 3 and Table 1). There was a positive correlation between the IJV/CCA CSA ratio at expiration and the CVP before and after fluid infusion (r = 0.861, P < 0.001 and 0.360, P = 0.034, respectively) (Figure 4 and Table 1) and a positive correlation between the IJV/CCA CSA ratio at inspiration and the CVP before and fluid infusion (r = 0.860, P < 0.001 and r = 0.540, P = 0.00, respectively) (Figure 5 and Table 1). Additionally, there was a positive correlation between the maximum IVC diameter at expiration and the CVP before and after fluid infusion (r = 0.890, P < 0.001 and r = 0.940, P < 0.001, respectively) (Figure 6 and Table 1) and a positive correlation between the IVC MAX. D at inspiration and the CVP before and after fluid infusion (r = 0.693, P < 0.001 and r = 0.971, P < 0.001, respectively) (Figure 7; Table 1). The heart rate (HR) decreased from 87.89 ± 12.902 to 85.97 ± 9.192 beat/minute after fluid infusion, although it was not statistically significant (P = 0.226). Also, the MAP significantly increased from 86.89 ± 11.787 to 92.83 ± 12.983 mmHg after fluid infusion (P = 0.001), the CVP significantly increased from 5.97 ± 2.135 to 10.71 ± 2.023 cmH2O after fluid infusion (P = 0.001) (Table 2).
| Variables | Before Fluid (n = 35) | After Fluid (n = 35) | ||
|---|---|---|---|---|
| R Value | P Value | R Value | P Value | |
| IJV (exp)/CCA with IVC MAX. D. | 0.923 | < 0.001 | 0.390 | 0.021 |
| IJV (insp)/CCA with IVC MINI. D. | 0.605 | < 0.001 | 0.496 | < 0.001 |
| IJV (exp)/CCA with CVP | 0.861 | < 0.001 | 0.360 | 0.034 |
| IJV (insp)/CCA with CVP | 0.860 | < 0.001 | 0.540 | 0.001 |
| IVC MAX. D. (exp)with CVP | 0.890 | < 0.001 | 0.940 | < 0.001 |
| IVC MINI. D. (insp)with CVP | 0.693 | < 0.001 | 0.971 | < 0.001 |
Correlations Between IJV/CCA CSA Ratio (at End Expiration and End Inspiration) and IVC Diameter (Maximum and Minimum Diameter)/CVP Before and After Fluid Infusion
The IJV diameter, the CCA CSA, and the IJV/CCA CSA ratio at the end of expiration and inspiration increased significantly after fluid infusion (P < 0.01) (Table 3).
| Variables | Before Fluid (n = 35) | After Fluid (n = 35) | P Value |
|---|---|---|---|
| IVC MAX. D (mm) | 12.557 ± 3.166 | 22.044 ± 17.059 | 0.003 |
| IVC MIN. D (mm) | 7.387 ± 1.781 | 11.367 ± 2.255 | < 0.001 |
| CCA.CSA (mm2) | 45.160 ± 2.340 | 48.274 ± 2.974 | < 0.001 |
| IJV CSA (mm2) at expiration | 77.957 ± 23.093 | 126.966 ± 11.070 | < 0.001 |
| IJV CSA (mm2) at inspiration | 77.059 ± 22.856 | 124.970 ± 11.631 | < 0.001 |
| IJV/CCA ratio at expiration | 1.714 ± 0.466 | 2.626 ± 0.135 | < 0.001 |
| IJV/CCA ratio at inspiration | 1.694 ± 0.462 | 2.583 ± 0.135 | < 0.001 |
IVCD, CCA CSA, IJVCSA, and IJV/CCA Ratio at Inspiration and Expiration a
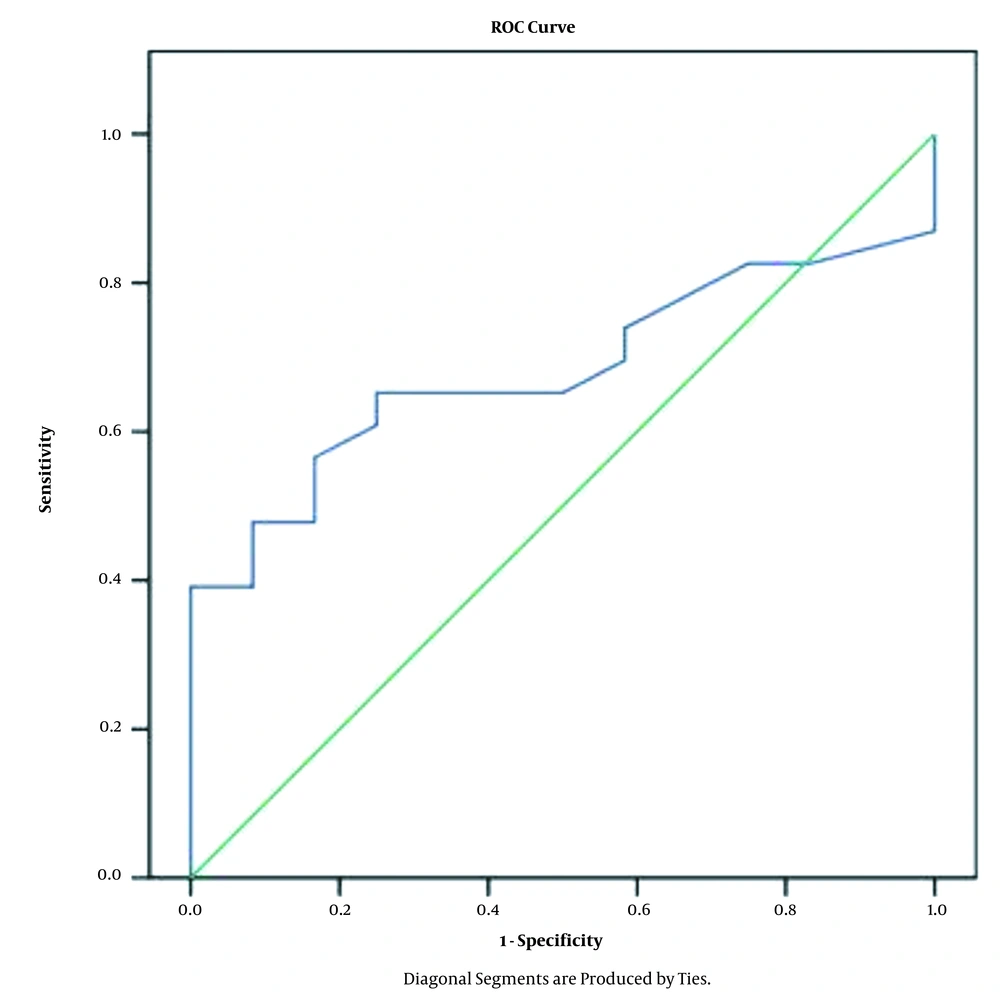
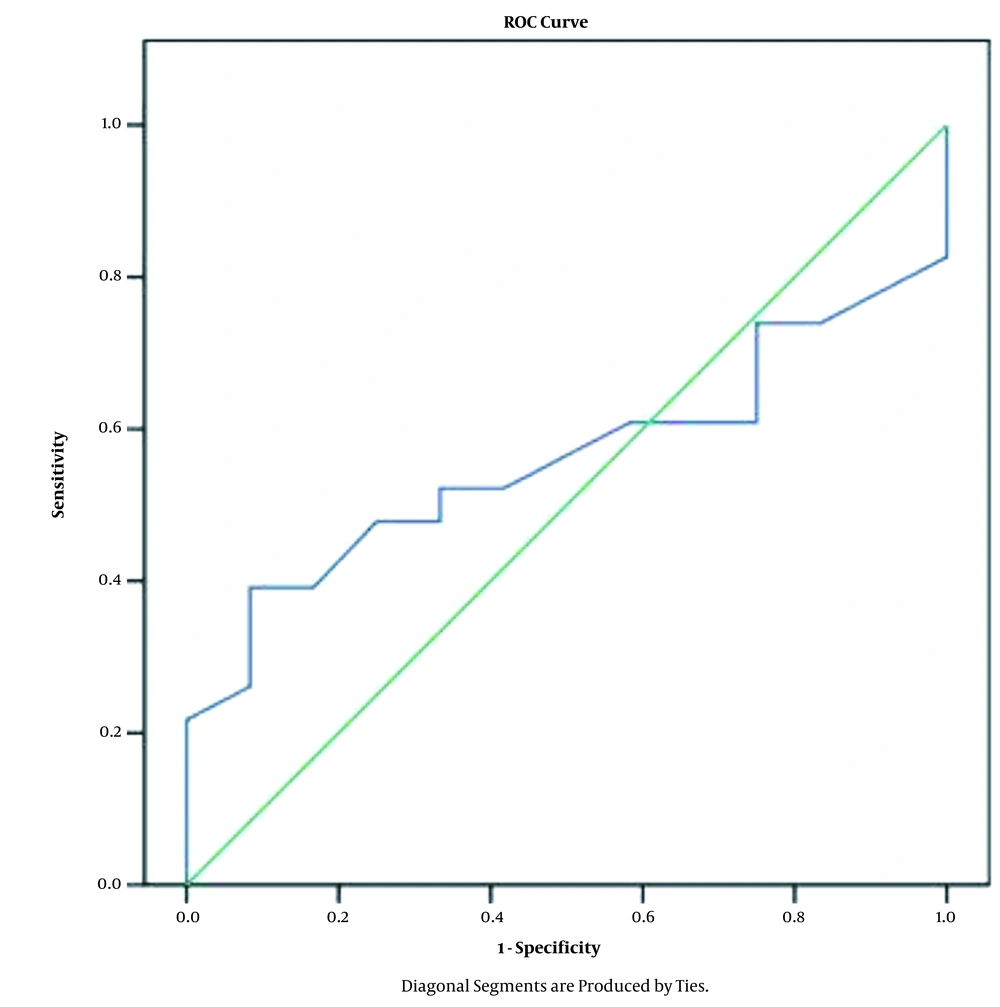
In addition, ROC analysis was performed to predict the best cut-off limit for the ratio of IJV/CCACSA during inspiration after fluid correction for a CVP of 8 - 12 cmH2O. At a ratio of 2.56, the highest sensitivity was 56.5%, and the specificity was 83.3%. At a ratio of 2.58, the highest sensitivity was 65.2%, the specificity was 75%, and the area under the curve (AUC) was 0.681 (Figure 8). During expiration at a ratio of 2.62, the highest sensitivity was 52.2%, and the specificity was 67%; and at a ratio of 2.65, the sensitivity was 56.5%, the specificity was 50%, and the AUC was 0.56 (Figure 9).
4. Discussion
The results of this study found a positive correlation between the IJV/CCA CSA ratio and the IVC diameter before and after fluid infusion. There was a positive correlation between the IJV/CCA CSA ratio and the CVP before and after fluid infusion during inspiration, with 56.5% sensitivity and 83.3% specificity at a ratio of 2.56 and 65.2% sensitivity and 75% specificity at a ratio of 2.58 in predicting a CVP of 8 - 12 cmH2O. During expiration, when the ratio was 2.62, the highest sensitivity was 52.2%, and the specificity was 67%, and when the ratio was 2.65, the highest sensitivity was 56.5%, and specificity was 50%. Moreover, the AUC was 0.56, which is considered an insufficient diagnostic marker for a CVP of 8 - 12 cmH2O.
IVC ultrasound was used as a non-invasive method to assess the intravascular volume and to guide fluid responsiveness in critically ill patients (17). However, the correlation between the CVP and IVC measurements was controversial, as reported by previously published studies. In a pilot study by Bailey et al. (12) in paediatric patients, a significant relationship was reported between the IJV/CCA CSA ratio and the CVP in paediatric burn patients, but this conclusion was not evaluated for adult patients after major surgeries, which is the rationale of this study. Hossein et al. (9) investigated the accuracy of the IJV/CCA CSA ratio in predicting CVP in 52 critically ill adult patients. A significant correlation was found between the IJV/CCA CSA ratio and the CVP; while the highest sensitivity was 90% the specificity was 86.36% for a CVP of < 10 cmH2O. Bano et al. (18) also found a significant correlation between the IJV/CCA diameter ratio and CVP at expiration (r = 0.401, P = 0.004). These results coincide with the results of the present study, which demonstrated positive correlations between the IJV/CCA ratio and the CVP. The different results of the ROC analysis of the presented study may be related to different sample size and the selected data for comparison. The present study was performed on 35 spontaneously breathing adult patients, and the collected data were related to fluid administration, and the ROC analysis was used to determine the optimum cut-off value for the IJV/CCA CSA ratio at inspiration and expiration in predicting a CVP of 8 - 12 cmH2O after fluid therapy; but in the study by Hossein et al. (9), ROC analysis was used to examine the specificity and sensitivity of the IJV/CCA ratio < 2 for a CVP less than 10 cmH2O. In the study by Bano et al. (18), the cut-off value of the IJV/CCA diameter ratio of < 2 for CVP < 10 cmH2O was insignificant. Also, the study by Kasem et al. (19) conducted on 65 spontaneously breathing adult patients reported that although the CCA diameter before fluid administration had a significant strong positive correlation with the CVP, the ROC analysis was an invalid test to determine the optimum cut-off value for CCA% to predict CVP > 8 cmH2O (AUC = 0.513, P = 0.885).
The present study showed a positive correlation between the IVC diameter and the CVP, which was inconsistent with some previous studies. Wiwatworapan et al. (20) evaluated 47 patients in the medical ICU and concluded that the measurement of the IVC diameter has a good correlation with CVP, which was also reported by Nik et al. (21).
Ilyas et al. (11) found a strong positive correlation between CVP and IVC diameter, and Abdelwahab and El-Wahab (22) found a significant relationship between CVP and IVC measurements in spontaneously breathing patients but a weak correlation in mechanically ventilated patients. Vaish et al. (23) reported a positive correlation of CVP with IVC diameters during inspiration and expiration. On the other hand, Ng et al. (24) reported that IVC measurements are not reliable indicators of intravascular volume in critically ill children.
Zehra et al. (14) also found a weak negative correlation between the IVC diameter and the CVP among critically ill patients.
The results of the present study differ from those of previously reported studies due to the different patient characteristics (adults or paediatric patients) and the conditions during ultrasonographic evaluation in terms of ventilated or spontaneously breathing patients. Some studies did not relate those measurements to fluid administration, and others included patients from medical and surgical ICUs.
4.1. Limitations
The main limitations of current study include a single-center nature of study and a relatively small sample size.
4.2. Recommendations
Further studies are recommended to confirm the results of the present study in different settings and population samples to find the best cut-off limit for the IJVV/CCA CSA ratio to determine different values of the CVP.
4.3. Conclusion
The results of this study found a positive correlation between the IJV/CCA CSA ratio and both the CVP and IVC diameters in relation to fluid infusion, but the optimum cut-off limit of the IJV/CCA CSA ratio in predicting a CVP of 8 - 12 cmH2O cannot be reached. Hence, the preliminary results of this study suggest that the assessment of the IJV/CCA CSA ratio using bedside ultrasonography could be a non-invasive method for evaluating intravascular volume status in spontaneously breathing adult patients after major surgeries. However, further studies are recommended to correlate these parameters together in different populations.
