


1. Background
The outbreak of coronavirus disease 2019 (COVID-19) caused by SARS-CoV-2 was announced by World Health Organization (WHO) as a global epidemic on March 11, 2020. The disease has spread rapidly throughout China and many other countries since its first appearance in Wuhan, China, in December 2019 (1).
COVID-19 increases inflammation by triggering a cytokine storm and has a high mortality rate with many complications, such as severe acute respiratory syndrome (SARS) and Middle East Respiratory Syndrome (MERS). Cytokines are central regulators of the immune system, and increased production of inflammatory cytokines leads to deregulation of the immune system (2, 3).
Increased fat cells contribute to the exacerbation of the cytokine storm. Increased body fat leads to the accumulation of excess metabolic byproducts of obesity in obese people and activates inflammatory signaling pathways similar to infection (4). In addition, high leptin level in obese people increases inflammation (5). Many studies have also identified obesity as a risk factor for COVID-19 patients (6-8). Obesity leads to an irregular immune response to respiratory infections (9). Researchers believe that obesity and increased body fat can exacerbate the cytokine storm and lead to severe symptoms or death in obese patients (10). Obesity also has a significant impact on normal lung function. Fat deposits alter the mechanics of the lungs, thus reducing lung compliance (11).
Body mass index (BMI) is used to classify obesity. BMI is calculated as the weight ratio in kilograms to height squared in meters, expressed in kilograms per square meter (12). BMI above 30 and obesity are associated with poor outcomes, including invasive unit care (ICU) admission, acute respiratory distress syndrome (ARDS), severe COVID-19, use of mechanical ventilation, hospitalization, and mortality in adult COVID-19 patients (13). Thus, obesity can increase the complications associated with COVID-19.
2. Objectives
In this study, we evaluated the relationship between the hospitalization length of COVID-19 patients with BMI. We also assessed the effect of obesity on COVID-19 severity.
3. Methods
3.1. Study Population
This cross-sectional descriptive study included patients with COVID-19 admitted to the general ward and ICU of Razi Hospital in Ahvaz, Iran, from January 2019 to December 2020. Inclusion criteria were definitive diagnosis of COVID-19 by the reverse transcription polymerase chain reaction (RT-PCR) or detection of lung involvement by computed tomography (CT) scan. Outpatients and patients with incomplete data were excluded from the study.
The Research Ethics Board of xxx University of Medical Sciences approved the study protocol (IR.AJUMS.REC.1399.937), and a written informed consent was obtained from all patients.
3.2. Data Collection
We recorded the patients' demographic and clinical data, including age, sex, BMI, underlying disorders, and length of hospitalization.
3.3. Statistical Analysis
In quantitative variables, mean or median and standard deviation (SD) or interquartile range (IQR) were used. In qualitative variables, frequency and percentage were used to describe data. The normality of the data was evaluated using the Kolmogorov-Smirnov test and Q-Q diagram. All analyses were performed using the Statistical Package for the Social Sciences (SPSS) software version 20. The significance level was considered as P < 0.05.
4. Results
4.1. Study Population
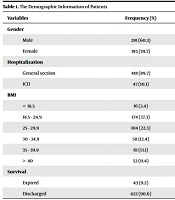
The present study included 466 patients, including 281 (60.3%) males and 185 (39.7%) females. The mean age was 59.49 ± 14.5 years. Also, 47 (10.1%) patients were admitted to the ICU, and 418 (89.7%) patients to the general ward (Table 1). The mean hospitalization length was 14.5 ± 6.8 days. All patients were categorized based on their BMI into six subgroups, including < 18.5, 18.5 - 24.9, 25 - 29.9, 30 - 34.9, 35 - 39.9, and > 40. The BMI of most patients (37.3%) was in the range of 18.5 - 24.9, followed by 25 - 29.9 (22.3%), 35 - 39.9 (13.1%), and 30 - 34.9 (12.4%) (Table 1). At the end of the study, 9.2% of patients died.
| Variables | Frequency (%) |
|---|---|
| Gender | |
| Male | 281 (60.3) |
| Female | 185 (39.7) |
| Hospitalization | |
| General section | 418 (89.7) |
| ICU | 47 (10.1) |
| BMI | |
| < 18.5 | 16 (3.4) |
| 18.5 - 24.9 | 174 (37.3) |
| 25 - 29.9 | 104 (22.3) |
| 30 - 34.9 | 58 (12.4) |
| 35 - 39.9 | 61 (13.1) |
| > 40 | 53 (11.4) |
| Survival | |
| Expired | 43 (9.2) |
| Discharged | 422 (90.6) |
The Demographic Information of Patients
4.2. The Association Between BMI and Hospitalization
A higher BMI was associated with higher length of hospitalization (P < 0.001). Based on our results, patients with BMI in the range of 18.5-24.9 experienced a longer hospitalization (10 - 20 days) (Table 2). However, no association was found between BMI with noninvasive ventilation (NIV) and intubation (P > 0.05) (Table 2). The death rate was higher in patients with BMI in the range of 18.5 - 24.9; however, there was no significant difference (P = 0.74). In our study, patients > 59 and < 59 were the same for BMI, and there was no significant difference (P = 0.37).
| Variables | BMI | P-Value | |||||
|---|---|---|---|---|---|---|---|
| < 18.5 | 18.5 - 24.9 | 25 - 29.9 | 30 - 34.9 | 35 - 39.9 | > 40 | ||
| Length of hospitalization (d) | < 0.001 | ||||||
| < 10 | 6 (4.1) | 40 (27.6) | 39 (26.9) | 20 (13.8) | 27 (18.6) | 13 (9) | |
| 10 - 20 | 7 (2.8) | 116 (46.4) | 53 (21.2) | 26 (10.4) | 28 (11.2) | 20 (8) | |
| > 20 | 3 (4.2) | 18 (25.4) | 12 (16.9) | 12 (16.9) | 6 (8.5) | 20 (28.2) | |
| NVI | 0.55 | ||||||
| Yes | 1 (4.8) | 9 (42.9) | 3 (14.3) | 1 (4.8) | 5 (23.8) | 2 (9.5) | |
| No | 15 (3.4) | 165 (37.1) | 101 (22.7) | 57 (12.8) | 56 (12.6) | 51 (11.5) | |
| Intubation | 0.18 | ||||||
| Yes | 0 | 9 (39.1) | 1 (4.3) | 5 (21.7) | 5 (21.7) | 3 (13) | |
| No | 16 (3.6) | 164 (37.1) | 103 (23.3) | 53 (12) | 56 (12.7) | 50 (11.3) | |
| Survival | 0.74 | ||||||
| Death | 2 (4.7) | 12 (27.9) | 10 (23.3) | 5 (11.6) | 8 (18.6) | 6 (14) | |
| Alive | 14 (3.3) | 161 (38.2) | 94 (22.3) | 53 (12.6) | 53 (12.6) | 47 (11.1) | |
The Influence of BMI on the COVID-19 Progression and Treatment a
4.3. The Association Between BMI and ICU Admission
BMI had no significant effect on the rate of ICU admission (P = 0.36) (Also, Also, there was no significant difference between the two groups regarding the length of hospitalization (P = 0.49) (Table 3). Non-diabetic patients were less likely to be admitted to the ICU (73.3% vs. 26.7%) (P < 0.001). Furthermore, the number of discharged patients was higher in patients admitted to the general ward compared to ICU admissions (93.8% vs. 63.8%) (P < 0.001) (Table 3).
| Variables | ICU Hospitalization | Total | P-Value | |
|---|---|---|---|---|
| Yes | No | |||
| BMI | 0.36 | |||
| < 18.5 | 1 (2.1) | 15 (3.6) | 16 (3.4) | |
| 18.5 - 24.9 | 19 (40.4) | 154 (36.8) | 173 (37.2) | |
| 25 - 29.9 | 5 (10.6) | 99 (23.7) | 104 (22.4) | |
| 30 - 34.9 | 7 (14.9) | 51 (12.2) | 58 (12.5) | |
| 35 - 39.9 | 7 (14.9) | 54 (12.9) | 61 (13.1) | |
| > 40 | 8 (17) | 45 (10.8) | 53 (11.4) | |
| Length of hospitalization (d) | 0.49 | |||
| < 10 | 11 (23.4) | 133 (31.8) | 144 (31) | |
| 10 - 20 | 28 (59.6) | 222 (53.1) | 250 (53.8) | |
| > 20 | 8 (17) | 63 (15.1) | 71 (15.3) | |
| Gender | 0.17 | |||
| Male | 24 (51.1) | 256 (61.2) | 280 (60.2) | |
| Female | 23 (48.9) | 162 (38.8) | 185 (39.8) | |
| Hypertension | 0.26 | |||
| Yes | 15 (31.9) | 102 (24.4) | 117 (25.2) | |
| No | 32 (68.1) | 316 (75.6) | 348 (74.8) | |
| Diabetes | 0.023 | |||
| Yes | 6 (12.8) | 118 (28.2) | 124 (26.7) | |
| No | 41 (87.2) | 300 (71.8) | 341 (73.3) | |
| Hyperlipidemia | 0.92 | |||
| Yes | 1 (2.1) | 8 (1.9) | 9 (1.9) | |
| No | 46 (97.9) | 410 (98.1) | 456 (98.1) | |
| Cardiovascular disease | 0.67 | |||
| Yes | 2 (4.3) | 13 (3.1) | 15 (3.2) | |
| No | 45 (95.7) | 405 (96.9) | 450 (96.8) | |
| Smoking | 0.11 | |||
| Yes | 2 (4.3) | 50 (12) | 52 (11.2) | |
| No | 45 (95.7) | 368 (88) | 413 (88.8) | |
| Liver dysfunction | 0.28 | |||
| Yes | 0 | 10 (2.4) | 10 (2.2) | |
| No | 47 (100) | 408 (97.6) | 455 (97.8) | |
| Kidney disorder | 0.16 | |||
| Yes | 5 (10.6) | 23 (5.5) | 28 (6) | |
| No | 42 (89.4) | 395 (94.5) | 437 (94) | |
| Rheumatism | 0.65 | |||
| Yes | 1 (2.1) | 14 (3.3) | 15 (3.2) | |
| No | 46 (97.9) | 404 (96.7) | 450 (96.8) | |
| Cancer | 0.47 | |||
| Yes | 1 (2.1) | 18 (4.3) | 19 (4.1) | |
| No | 46 (97.9) | 400 (95.7) | 446 (95.9) | |
| Brain stork | 0.92 | |||
| Yes | 1 (2.1) | 8 (1.9) | 9 (1.9) | |
| No | 46 (97.9) | 410 (98.1) | 456 (98.1) | |
| NIV | 0.45 | |||
| Yes | 3 (6.4) | 17 (4.1) | 20 (4.3) | |
| No | 44 (93.6) | 401 (95.9) | 445 (95.7) | |
| Survival | < 0.001 | |||
| Death | 17 (36.2) | 26 (6.2) | 43 (9.2) | |
| Alive | 30 (63.8) | 392 (93.8) | 422 (90.8) | |
Comparing Two Groups for Influencing Factors in ICU Admission
5. Discussion
Recognizing the associated risk factors with COVID-19 hospitalization reduces the mortality rate and cost of care. Researchers are trying to improve treatment and increase safety by vaccination. In this line, the present study investigated the possible relationship between BMI and hospitalization in southwest Iran, as one of the most prevalent regions of COVID-19.
Our findings indicated that BMI is directly associated with COVID-19 progression and mortality rate. Based on the present results, patients with BMI in the range of 18.5 - 24.9 experienced longer hospitalization and intubation. In addition to the lung cells, the fatty cell has the coronavirus receptor; in this regard, the higher severity of the infection and more extended hospitalization can be attributed to this finding. Bhasin et al. in the US revealed a negative correlation between age and BMI; they indicated that younger hospitalized patients had higher BMI (14). It means that younger age alone cannot reduce the disease severity following higher BMI. Our results showed no difference between younger and older patients with BMI levels. Many surveys recommend nutritional supplements for improving immunity against coronavirus infection. Mohseni et al. compared the COVID-19 infected patients for the induced immunity following nutritional consumption; their findings revealed that the higher BMI as a risk factor was not influenced, and patients with higher BMI had a higher severity of infection (15).
Our data indicated that ICU admission did not affect BMI. This agrees with a recent meta-analysis reporting that BMI and obesity account for poor risk factors for COVID-19 patient outcomes associated with ICU admission (1). BMI represents the visceral fat area (VTA), subcutaneous fat area (SFA), and total fat area (TFA); on the other hand, it was demonstrated that just VTA and SFA are associated with COVID-19 progression (16), which indicates no association between higher BMI and ICU admission.
The association between obesity and higher BMI with increasing inflammation is obvious. In this regard, considerable literature recommends more attention to managing inflammation in patients with high BMI. The primary therapeutic strategy for COVID-19 is targeting the inflammation pathway. However, this is not entirely achieved. Toll-like receptor 4 (TLR4) is one of the pathogeneses of coronavirus. TLR4 increases the angiotensin-converting enzyme 2 (ACE2), the primary receptor COVID-19 receptor on the surface of lung tissue (17). So, in obese patients and those with a high BMI, the level of TLR4 expression increases and alters the myeloid-lymphoid ratio in favor of myelogenesis and lymphocytopenia (18), aggravating the COVID-19 progression. BMI influences the immune system and promotes COVID-19 pathogenesis in the early stage of infection, contributing to ICU admission. In this line, it was reported that the improvement in COVID-19 caused a significant reduction in ICU admission during recent waves (19). This report indicates a more complex situation than BMI contributes to patients recently hospitalized in the ICU.
The limitation of the present study was the lack of data about the vaccination status of participants, including the number of injections, type of vaccine, and the interval between infection and last dosage of vaccine. Evaluating adverse events of COVID-19 with the level of BMI is highly recommended.
5.1. Conclusions
The current survey evaluated the impact of BMI on ICU admission in patients with COVID-19. Our data demonstrated that high BMI is a risk factor for CVID-19, especially in the early stage of infection.
