1. Background
Residual neuromuscular blockade is the main factor of anesthesia-related morbidity and mortality, which has been mentioned in many international studies (1-4). Qualitative monitoring is important to avoid residual neuromuscular blockade (5, 6). According to the literature, the return of neuromuscular transmission, defined as a factor of recovery from four consecutive stimulations (train-of-four ratio (TOF R)) > 0.9, is required for the safe extubation of a patient (7, 8). However, in contrast to the recommendations of the anesthesia association, quantitative neuromuscular monitoring is not routinely used (9-11). The most common method of neuromuscular transmission in clinical practice is objective monitoring with an acceleromyograph (12). Electromyography (GE Datex Medical Instrumentation) is used less frequently and records the electrical activity of muscles and thus quantifies the neuromuscular blockade. This technique records the compound action potentials produced by the stimulation of individual muscles in the area supplied by the nerve. This is a simple method and only requires the electrodes to be attached without fixing the accelerometer (10).
The response of the adductor pollicis muscle to the electrical stimulation of the ulnar nerve is routinely used in clinical practice for monitoring the neuromuscular block (13). However, in a certain group of patients, measurements obtained by relaxometry on the hand is not possible due to difficult access to the arm (patients with bilateral arm or forearm fractures, burns, amputations, and malformations of the limbs and those requiring bilateral upper limb surgery) (6). For such patients, the relaxometry on the posterior tibial nerve is an alternative (14, 15).
2. Objectives
This study aimed to compare the neuromuscular monitoring of the posterior tibial nerve with the standard procedure for the ulnar nerve using electromyography. We hypothesized an acceptable agreement between the ulnar and posterior tibial nerves during the recovery of neuromuscular function.
3. Methods
3.1. Ethics
This study was provided by the Ethics Committee of the Medizinische Hochschule Hannover, Hannover, Germany (Chairperson Prof. Dr. H. D. Tröger) on 21 December 2012 (Code: 1668-2021). The study was also conducted in accordance with the Declaration of Helsinki 1975 (revised 2013).
3.2. Trial Registration
All patients involved in this study provided their written informed consent, and the study was registered with the German Clinical Trial Register (www.DRKS.de, DRKS00025042). The trial was registered after the enrollment of patients since the registration of the trial was not required when the study was conducted. The first enrollment was recorded on 28.03.2013, and the study was registered on 22.04.2021. Only the results obtained from stimulation of the ulnar nerve and, by extension, the thumb adductor muscle were considered in the study.
3.3. Patients
The study included 101 patients scheduled for elective abdominal surgery, aged between 18 and 75 years, with an American Society of Anesthesiologists (ASA) score of one to three. Exclusion criteria were neuromuscular diseases, pregnancy, obesity, diabetes, non-fasting patients, polyneuropathy, and use of narcotics. The 101 patients completed the study. Twelve and two patients were excluded due to incorrect measurements on the foot and the hand, respectively. Five patients had a TOF = 0.0 on the foot due to unknown causes. Three and two patients had TOF = 0.0 on the foot due to compensated heart failure, and peripheral edema, respectively. Tow patients had TOF > 0.7 on the foot due to unknown causes, one patient had TOF > 0.6 on the hand due to unknown causes, and one patient was excluded due to technical artifacts. Accordingly, eighty-seven patients were included in the final analysis.
3.4. Neuromuscular Monitoring
This study used the NMT module (GE Healthcare) with ElectroSensor to record electromyography measurements. The ulnar and posterior tibial nerves were monitored by the Datex Ohmeda (GE Healthcare) and Carescape B650 (GE Healthcare) monitors, respectively. During general anesthesia, the patients had relaxometry measurements simultaneously performed on the ulnar and the posterior tibial nerves. The depth of relaxation was determined by electromyography with four-fold stimulation (TOF stimulation) up to the time of extubation. After the administration of 0.1 mg/kg cisatracurium, the onset time (time from the start of the injection of the neuromuscular blocking agent to the disappearance of the stimulus-response at TOF = 0) and relaxation time (time from the start of the injection of the neuromuscular blocking agent to recovery at TOF = 0.9) were compared on the hand and the foot. The Ag/AgCl stimulation electrodes (hydrogel adhesive) were used in this study. There was no sign of skin damage after using neuromuscular monitoring.
3.5. Study Procedure
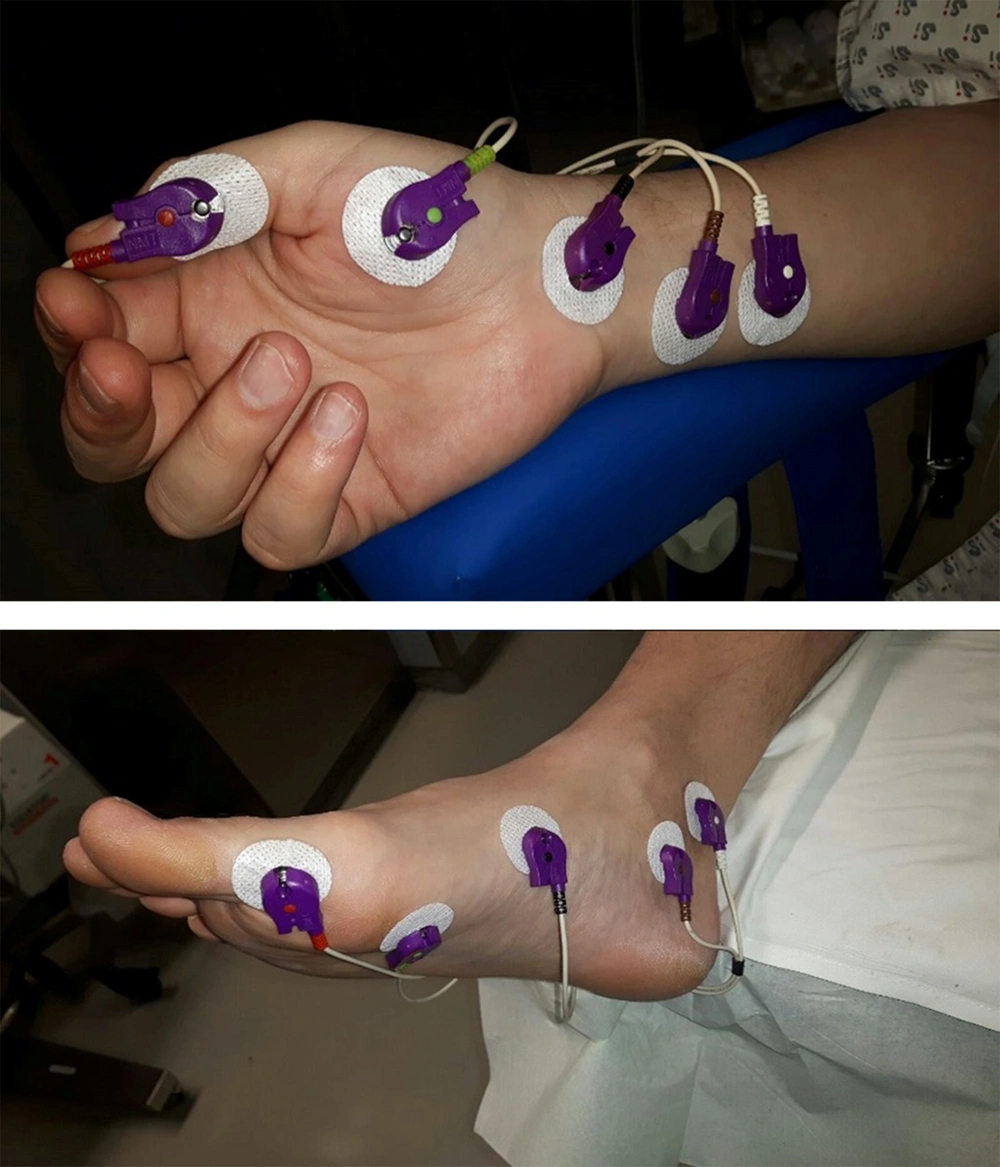
The induction and maintenance of general anesthesia were carried out by the same anesthesiologist according to a fixed scheme. Standard monitoring consisted of an electrocardiogram, a noninvasive blood pressure measurement, pulse oximetry, and capnography. Anesthesia was induced with 1.5 μg/mg fentanyl, 2.0 mg/kg propofol, 0.1 mg/kg cisatracurium and continued with sevoflurane (2% inspired concentration). Clinical relaxation was maintained with additional doses of cisatracurium, which were given depending on surgery conditions (e.g., clinical muscle relaxation was maintained utilizing intermittent administration of cisatracurium, as dictated by intraoperative conditions, such as patient movement or surgeon’s needs for increased muscle relaxation). At the end of the procedure, a standard dose of 40 μg/kg neostigmine and 7 μg/kg atropine were administered to facilitate the reestablishment of neuromuscular function in patients who may not have achieved spontaneous recovery to a TOF ratio > 0.9. Prior to the induction of anesthesia, five electrodes were attached to the hand and the foot (Figure 1) for the relaxometry recording using electromyography and then connected to the measuring device. The ulnar nerve was stimulated on the hand, and the response was measured by electromyography on the adductor pollicis muscle. At the same time, the posterior tibial nerve was stimulated on the foot, and the response was measured by electromyography on the flexor hallucis brevis muscle. After calibration, the TOF stimulation with a frequency of 2 Hz was given every 20 s before the time of intubation at 5-minute intervals by the time of extubation. In this study, all patients were extubated at TOF > 0.9 (was measured by electromyography at the ulnar nerve). The electromyography neuromuscular monitoring was conducted according to the Good Clinical Research Practice recommendations (13).
3.6. Data Collection
Demographic data and clinical details (total cisatracurium dosages, intubation, maintained dose, reversal, extubation, and anesthesia times) were considered. Each patient’s intubation was rated from 1 (very easy) to 4 (impossible intubation). Technical problems regarding the stimulation of both nerves were also documented.
3.7. Statistical Analysis
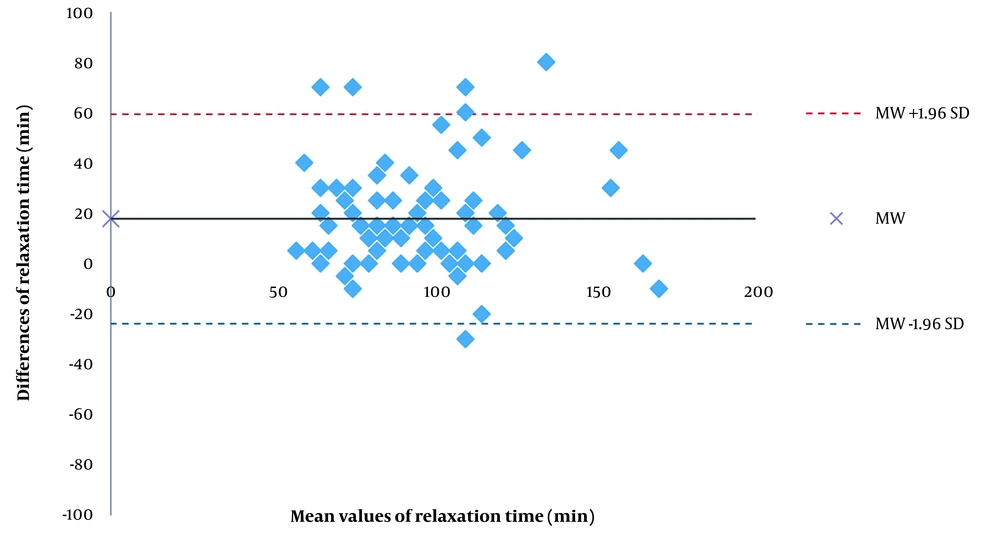
The Bland-Altman method was used to compare the two measurement methods (hand-foot) (16). The mean differences in time from the cisatracurium administration to TOF = 0 and TOF > 0.9 between the individual pairs of measured values on the hand were plotted against the values measured on the foot in a Bland-Altman diagram. The limits of agreement (mean ± 1.96 × standard deviation), containing 95% of all differences, were represented as a horizontal line. The Bland-Altman analysis was compared using the paired t-test and the Pearson correlation. In this study, P < 0.05 was set as the significance level. The patients’ individuality and perioperative characteristics are described as the number of patients (%), mean ± standard deviation, or median (interquartile range). Data analysis was performed using Microsoft Excel 2013 (Microsoft, Redmond, USA).
4. Results
Eighty-seven patients were included in the evaluation (Table 1). Twelve patients received pharmacological reversal with neostigmine and atropine before emergency from anesthesia. Eighty-five and two patients were successfully intubated at the first and second attempts, respectively.
| Characteristic | Results |
|---|---|
| Age (y) | 53.3 ± 16.8 |
| Height (m) | 1.7 ± 0.11 |
| Weight (kg) | 78 ± 12.8 |
| Body mass index (kg/m2) | 25 ± 3.6 |
| Gender-male | 46 (52.9) |
| ASA physical status | |
| I | 19 (21.8) |
| II | 50 (57.6) |
| III | 18 (20.6) |
| Ease of intubation | |
| 1 | 65 (74.7) |
| 2 | 20 (23) |
| 3 | 2 (2.3) |
| 4 | 0 (0) |
Participants’ Demographic Information (n = 87) a
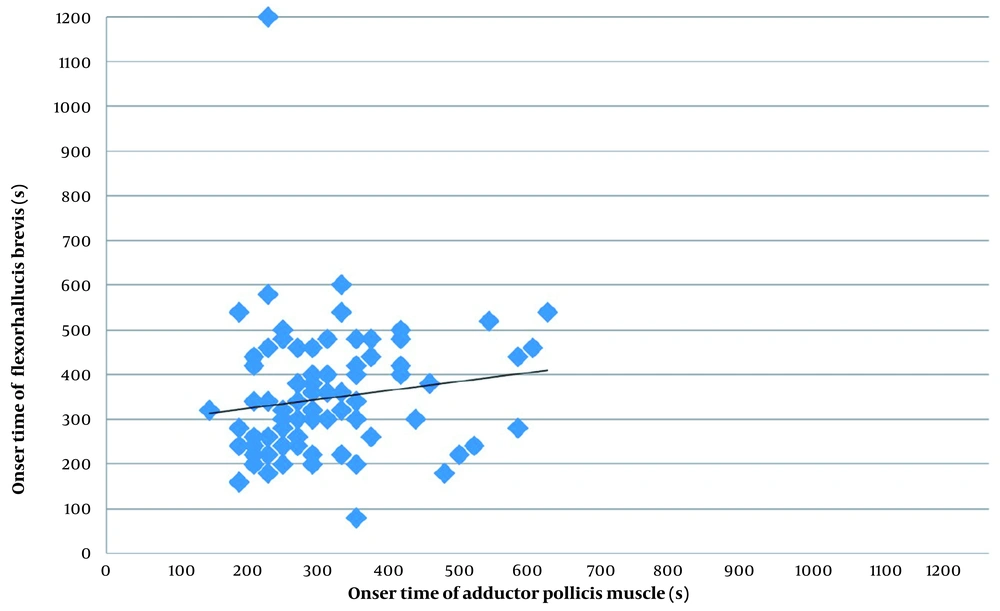
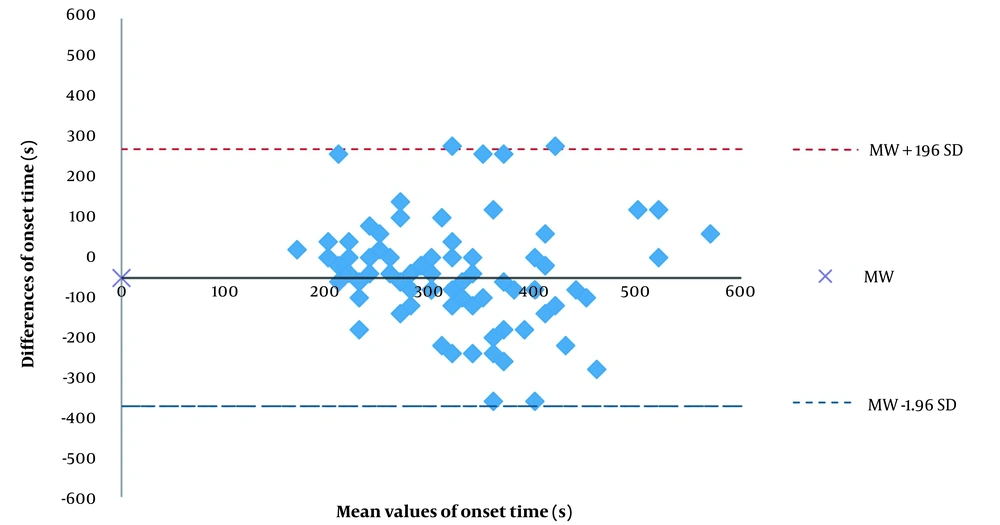
The present study shows little correspondence between the cisatracurium onset times measured on the hand and the foot. In the Bland-Altman analysis, the onset time was, on average, 50 s shorter on the hand than on the foot. The differences between the hand and the foot in onset time were highly scattered. We found no statistically significant difference between the ulnar and tibial nerves for onset time. Figure 2 shows a scatter diagram for onset time (until TOF = 0) on the hand and the foot. Pearson correlation coefficient, r, was 0,112 (Figure 2). The Bland-Altman analysis results show that the onset time was 296 ± 99 s on the hand and 346 ± 146 s on the foot, with a mean difference of -50 ± 164 s. Moreover, 95% of the measured values on the hand were up to 372 s shorter and up to 273 s longer than the measured values on the foot (Figure 3).
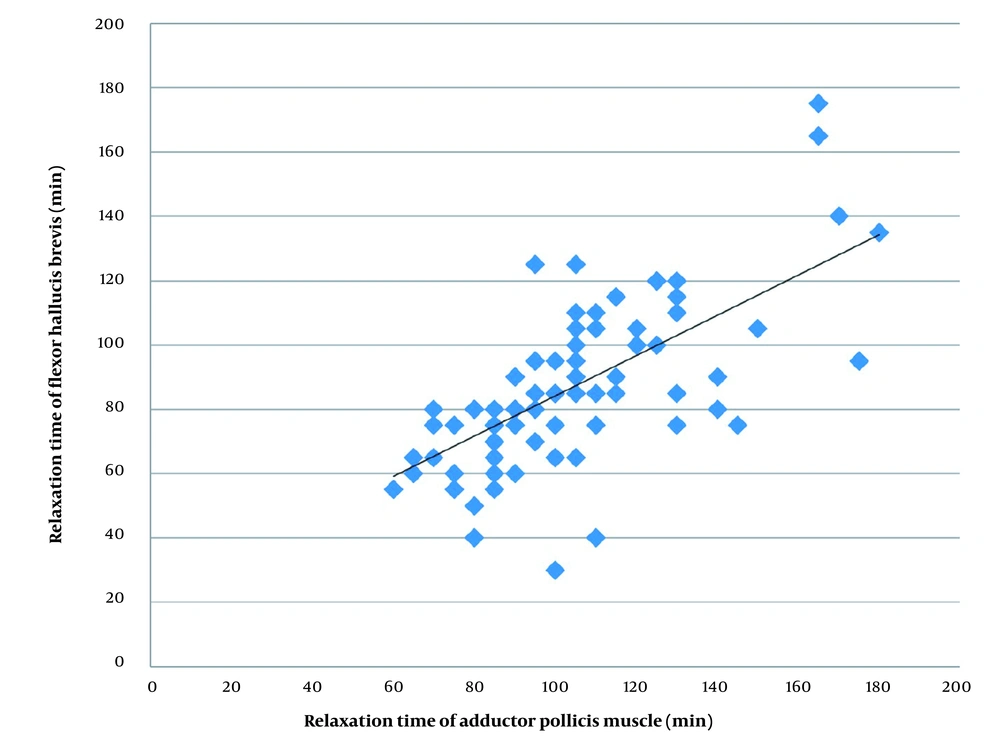
The relaxation time was 18 min shorter on the hand than on the foot; this difference was not statistically significant. The differences between the hand and the foot were scattered. There were large 95% limits of agreement and a low correlation between the time required for both nerves to reach TOF = 0.0. There were large 95% limits of agreement and a high correlation between the time required for both nerves to reach TOF = 0.9. Figure 4 shows a scatter diagram for relaxation time (TOF = 0.9) on the hand and the foot (Figure 4). Pearson correlation coefficient, r, was 0.712. The relaxation time was 105 ± 26 min on the hand and 87 ± 25 min on the foot, with a mean difference of 18 ± 20 min. Moreover, 95% of the measured values on the hand were up to 372 s shorter and up to 273 s longer than the measured values on the foot (Figure 5).
5. Discussion
Monitoring the extent of the neuromuscular block during general anesthesia is an indispensable component of anesthetic management. The gold standard for neuromuscular monitoring is mechanomyography at the adductor pollicis muscle, which has been widely used in scientific research (13). Nevertheless, mechanomyography devices are no longer produced and are not available for scientific purposes. In the present study, electromyography was employed as the primary modality for monitoring neuromuscular function, as it has been demonstrated to exhibit a strong correlation with mechanomyography during the initiation and reversal of neuromuscular block (10).
In this study, we compared performance in the neuromuscular monitoring of the posterior tibial nerve with the standard procedure for the ulnar nerve using electromyography. A comparison of the onset time and relaxation time on the hand and the foot is, therefore, of great clinical relevance. The findings of this investigation confirm the wide range of variation in the onset time of cisatracurium. The onset time measured at the adductor pollicis ranged from 140 s to 600 s and from 80 s to 1200 s at the flexor hallucis brevis. These findings indicate that the time proposed in the literature are only mean values from which many patients remarkably deviate.
Various studies comparing relaxometry on the hand and on the foot came to different and sometimes contradictory, findings (14, 15, 17-26). Different neuromuscular blocking agents, stimulation patterns, and action time were examined. To date, no study has examined cisatracurium, a very commonly known skeletal-neuromuscular blocking agent. Only a few clinically controlled studies on patients have investigated whether the relaxometry of the posterior tibial nerve using electromyography achieves results comparable to those of the standard procedure on the ulnar nerve (22, 23, 26). Compared to previous clinical studies on significantly smaller study participants (n = 10 - 60), the present study included 101 subjects. The findings of our study are novel regarding the use of cisatracurium. Other neuromuscular blocking agents such as d-tubocurarine, atracurium, vecuronium, mivacurium, or rocuronium have been used in many studies.
Previous studies compared the relaxometry of the hand and the foot using electromyography; however, they did not use the Bland-Altman method. To facilitate comparison with prior studies, the correlation and mean value comparison (t-test) were also analyzed and presented in this study.
To the best of our knowledge, no research has compared the onset time of cisatracurium on the hand and on the foot. In our study, the onset time of cisatracurium was shorter on the hand than on the foot; however, the difference was not statistically significant. On the other hand, most studies have indicated that the onset time of atracurium (23, 25), vecuronium (15, 18), mivacurium (19), and rocuronium (17) is significantly shorter on the hand than on the foot. In Sugi et al.’s study (24), the onset time of vecuronium was also shorter on the hand than on the foot; however, no statistical significance was observed. In contrast, in Kitajima et al.’s study (20) on children aged 2 - 10 months, the onset time was longer on the hand than on the foot. The shorter onset time of non-depolarizing neuromuscular blocking agents on the hand can be the result of pharmacokinetic differences. Heier and Hetland (18) and Kern et al. (19) discussed that a higher blood flow in the muscle groups of the hand and the shorter distance between the heart and the hand explain why the neuromuscular blocking agents reach their target area on the hand faster. However, Kitajima et al. (14) and Suzuki et al. (15) assumed that differences in the structures of the muscle fibers are responsible for these findings.
The relaxation of the larynx muscles is relevant to intubating conditions. Several studies have suggested that the onset time of succinylcholine, vecuronium, mivacurium, and rocuronium is shorter on the laryngeal muscles than on the adductor pollicis muscle (27-29). However, this issue has not yet been addressed for cisatracurium. Since the onset time of neuromuscular blocking agents is shorter on the laryngeal muscles than on the hand, ideal intubation conditions can be expected if no further response to stimuli is measured on the hand. The stimulus responses disappear on the foot about 50 s later. The values measured by electromyography on the foot in our study could be useful; however, the anesthesiologist using this site must be aware that ideal intubation conditions is achieved almost a minute before.
This study aimed to examine the ideal time and conditions for extubation, and the findings documented that the ideal was when the TOF value was ≥ 0.9. The time between the injection of the neuromuscular blocking agent and reaching TOF = 0.9 was measured, which is defined as the muscle relaxation time. According to the findings, the relaxation time of cisatracurium on the hand and on the foot are not compliant. In the Bland-Altman analysis, the relaxation time on the hand was 18 min longer than on the foot on average. The differences between the hand and the foot in relaxation time were less scattered than differences in onset time. We found no statistically significant difference in relaxation time between the ulnar and posterior tibial nerves. The non-significance of the difference of 18 min does not conclude that the measurements on the hand and foot have a high degree of comparability. The mean value of comparison using the t-test is not suitable to determine the degree of correspondence between the two measurement methods (30). No study has compared the relaxation time of cisatracurium on the hand and the foot. There is only one study (24) comparing the recovery of a neuromuscular blocking agent by TOF = 0.9 on the hand and the foot. In this study, recovery from the relaxation time of vecuronium on the foot was not significantly shorter than on the hand by TOF = 0.9. These findings were confirmed in the present study.
Several other studies compared many neuromuscular blocking agents and various recovery parameters. In studies by Theroux et al. (23), Suzuki et al. (15), Kern et al. (19), Heier and Hetland (18), recovery period up to TOF = 0.75 was significantly shorter on the foot than on the hand. Sopher et al. (22), Kitajima et al. (20), and Deladriere et al. (17) showed no statistically significant relevance or difference in recovery time. In our study and many other studies, muscle relaxation occurs faster in the foot than in the hand, which can be caused by differences in the structures and sizes of the hallucis brevis muscles. It should be noted that type 2 muscle fibers are more resistant to non-depolarizing neuromuscular blocking agents (19).
Many studies have indicated that the best extubation time is when TOF = 0.9 for the hand. However, the same TOF values are obtained sooner on the foot than on the hand. After reaching TOF = 0.9 on the foot, it is recommended to wait an average of 18 min to safely extubate a patient. The values on the foot were not considered clinically helpful.
The application of electrodes to the foot, in conjunction with the utilization of posterior tibial nerve relaxometry via electromyography, proved to be a facile method for obtaining electromyographic measurements of the foot, being both easily performed and user-friendly. However, in 12% of the patients, incorrect measurements occurred on the foot. In this study, an error in measurement was observed in 3% of patients at the onset of the study, with 9% of patients exhibiting such errors towards the end of the testing period, which would not have been detectable using conventional methods.
Moreover, there is little agreement between the electromyography relaxometry of the foot and the hand. The onset time and relaxation time measured on the foot do not match the values obtained on the hand and do not allow the prediction of the optimal time of intubation and extubation.
There were some limitations in this investigation. First, the measurement method on the foot using electromyography was not possible in patients with compensated heart failure and peripheral edema. Second, five patients had a constant measurement of TOF = 0 on the foot, the cause of which is unknown. Third, children and patients aged above 75 years were not included in the study. Patients with ASA IV and those presenting with neuromuscular diseases and obesity were also excluded.
5.1. Conclusions
In conclusion, no statistically significant difference was noticed between the ulnar and posterior tibial nerves during the onset and recovery of neuromuscular block using electromyography. The time from cisatracurium administration to the TOF values of 0 and 0.9 showed large limits of agreement during neuromuscular recovery. In 12% of patients, measurements on the foot revealed false values, which was of great clinical significance. Our findings showed that further studies are required to detect whether electromyography at the posterior tibial nerve provides an accurate assessment of neuromuscular function in general anesthesia.
