1. Background
Pressure support ventilation (PSV) was originally invented as a weaning tool for patients under intensive care. Contrary to unsynchronized modes of ventilation such as mandatory volume controlled ventilation, the ventilator detects patient’s own breathing initiative. When the patient inhales, the ventilator exerts a positive pressure to facilitate his or her inspiration. Compared to unassisted spontaneous breathing (SB), PSV improves the efficiency of spontaneous breathing (1, 2) and has been recommended for spontaneously breathing patients under general anesthesia (3). On the downside, PSV is a mode of positive pressure ventilation (PPV), which causes a redistribution of ventilation towards the ventral regions of the lung, with the potential of ventilation induced lung injury secondary to atelectasis formation and alveolar overdistension (4-7). Additionally, during anesthesia and PPV, the diaphragm is displaced cranially, predominantly in the dorsal regions (8), contributing to the ventral redistribution of ventilation and dorsal atelectasis formation. Hypothetically, these effects should be diminished if PPV is avoided and when the physiological function of the diaphragm is preserved.
In a previous study (9), we compared SB, pressure control ventilation (PCV) and PSV for their effect on the redistribution of ventilation using electrical empedance tomography (EIT). EIT is a noninvasive tool allowing real-time imaging of the distribution of ventilation by measuring the electrical impedances in a cross section of the thorax (10). Since an increase in air content during inspiration causes an increase in the impedance, the EIT device can detect relative changes in the air content in a matrix of typically 32 × 32 pixels across the thoracic diameter with good accuracy (11-13).
In the previous study, we detected a significant redistribution of ventilation during both PSV and PCV, but we did not find any difference between PCV and PSV. During PSV, patient’s inspiratory effort is detected by either pressure or flow. The sensitivity of the trigger determines how much effort the patient has to exert before his inspiration is augmented by the ventilator. Based on the idea that a less sensitive trigger would cause the patient to breathe more actively instead of just being passively ventilated by the ventilator, we expected to assess whether a higher amount of spontaneous breathing would attenuate the ventilation redistribution caused by PPV. We suspected that the very sensitive trigger setting in our previous study (2 L/minute) might have masked the influence of patient´s own inspiratory efforts on distribution of ventilation.
2. Objectives
To quantify the effect of PSV-trigger setting on redistribution of ventilation in the lung, we designed a clinical trial using electrical impedance tomography (EIT) to assess the distribution of ventilation during general anesthesia. We hypothesized that a less sensitive trigger setting would reduce the extent of redistribution of ventilation during PSV.
3. Patients and Methods
This study was a one-armed, observational, randomized, cross-over, single-site clinical trial. It was conducted by the orthopedic anesthesia department at the university hospital in Dresden, Germany, in February 2011. The study was approved by the local ethics committee (Ethikkommission der Medizinischen Fakultät Carl Gustav Carus, University Dresden) as an amendment to study EK375122009.
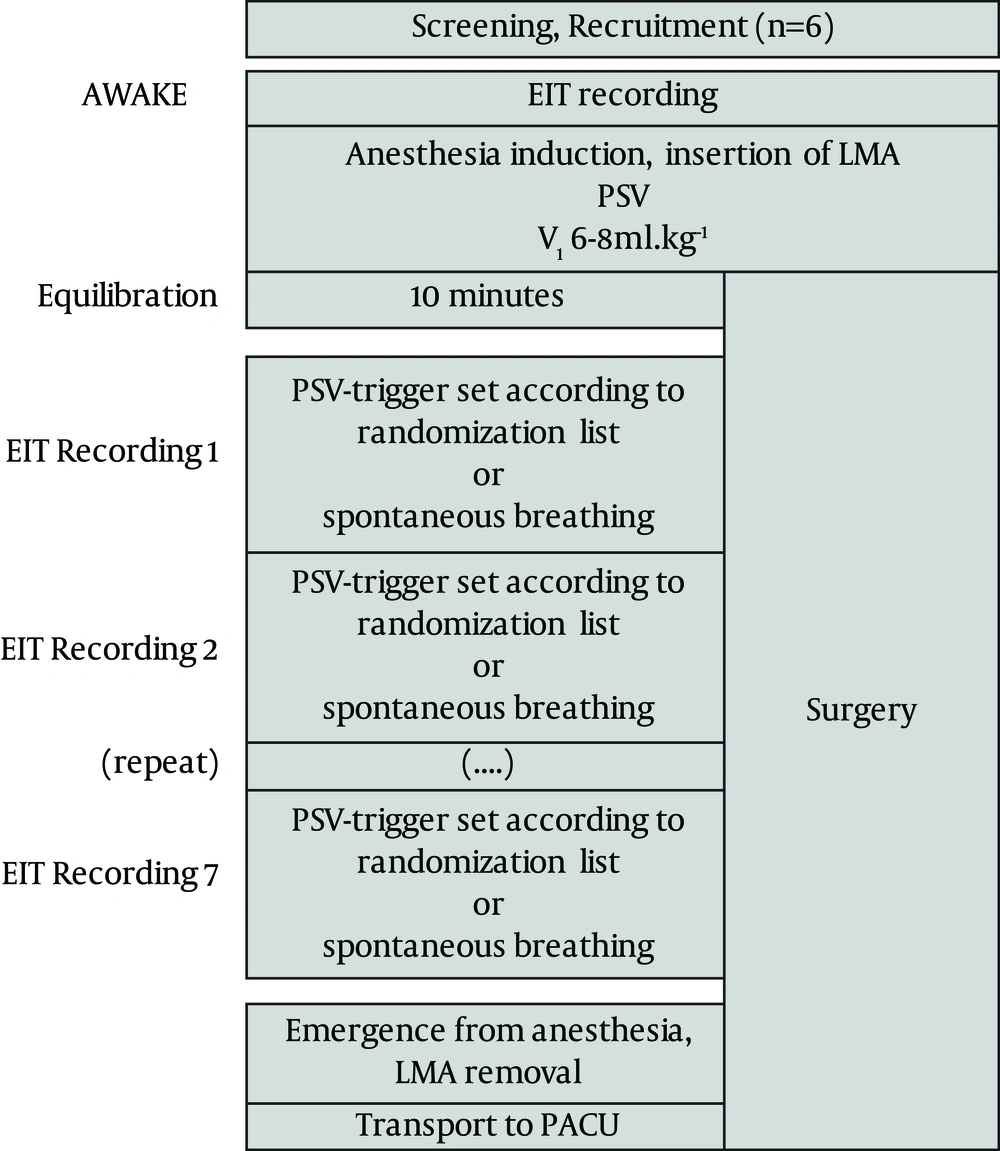
Six patients scheduled for elective leg surgery under general anesthesia were enrolled in the study after successful screening by the anesthesia team and after obtaining a written informed consent. The exclusion criteria were contraindications to the drugs used for anesthesia, pregnancy or breastfeeding, severe cardiac or pulmonary comorbidities (defined as the American Society of Anesthesiologists physical status III or greater), and contraindications to a laryngeal mask airway (LMA) or EIT. A flowchart of the study protocol is represented in Figure 1.
After arrival in the operating room, the electrode belt of the EIT device (EIT Evaluation Kit 2, Drager Medical, Lubeck, Germany) was placed around the patient’s chest at the level of sixth intercostal space. The patients were connected to a monitoring system (Philips MP70, Philips Deutschland GmbH, Hamburg, Germany) for monitoring according to clinical standards (heart rate, noninvasive blood pressure and oxygen saturation). Baseline values were recorded while the patient was in supine, leveled position, breathing spontaneously without supplemental oxygen administration (time point AWAKE). For consistency, data of consecutive time points were recorded in leveled, supine position.
The anesthetic regimen was identical to the one we used in the previous study (9). Prior to anesthesia induction, each patient received 2 mg midazolam. After anesthesia induction with sufentanil (0.1 µg/kg) and propofol (1 - 2 mg/kg), a LMA was placed and the cuff minimally inflated to achieve a seal up to 20 mbar. The patients were connected to a ventilator (ZEUS, Drager Medical). Ventilation data (respiratory rate, tidal volume, end-tidal carbon dioxide, volatile anesthetics, oxygen concentration, airway pressures and pressure curves) were recorded from the ZEUS ventilator using its MEDIBUS interface (MedLink, Nortis Ingenieurbüro, Lübeck, Germany).
All patients were ventilated in pressure support mode. The inspiratory pressure was adjusted to achieve a tidal volume of 6 - 8 mL/kg with no mandatory respiratory rate. Inspired fraction of oxygen (FiO2) was set to 0.8, no PEEP was used. Anesthesia was maintained with 0.7 MAC sevoflurane and repeated boluses of 0.1 µg/kg sufentanil according to the patients' clinical needs (defined as: respiratory rate > 10/minute, BIS > 60, tachycardia/hypertension or patient movement). Nitrous oxide was not used.
After an equilibration period of 10 minutes after insertion of LMA, the PSV-trigger was adjusted in a randomized sequence (computer generated randomization list for each individual patient) of the following settings: 2, 4, 6, 8, 10 and 15 L/minute (time points PSV 2 through PSV 15) or spontaneous breathing with no pressure support (time point SB). Each setting was maintained for at least three minutes while recording EIT data. We had previously observed that in patients with healthy lungs, changes in the mode of ventilation cause a redistribution of ventilation within only 2 - 4 breaths. We therefore concluded that an equilibration period of three minutes would be sufficient to achieve stable conditions for EIT measurements.
For each setting, we analyzed a sample of 5 - 6 consecutive breaths from the last minute. Software developed by the authors analyzed the distribution of ventilation-induced impedance changes and calculated the mean center of ventilation (COV). The center of ventilation (COV) is a single number with good reproducibility (12), designed to simplify compare EIT recordings. A value of 50 indicates that the ventilation is equally distributed between the ventral and dorsal halves of the thorax. Higher numbers indicate a shift towards the ventral region and lower numbers indicate a shift towards the dorsum. Thus, the COV is a robust parameter which can be analyzed by statistical methods. The algorithms used for the analysis were identical to the ones used in the previous study (9).
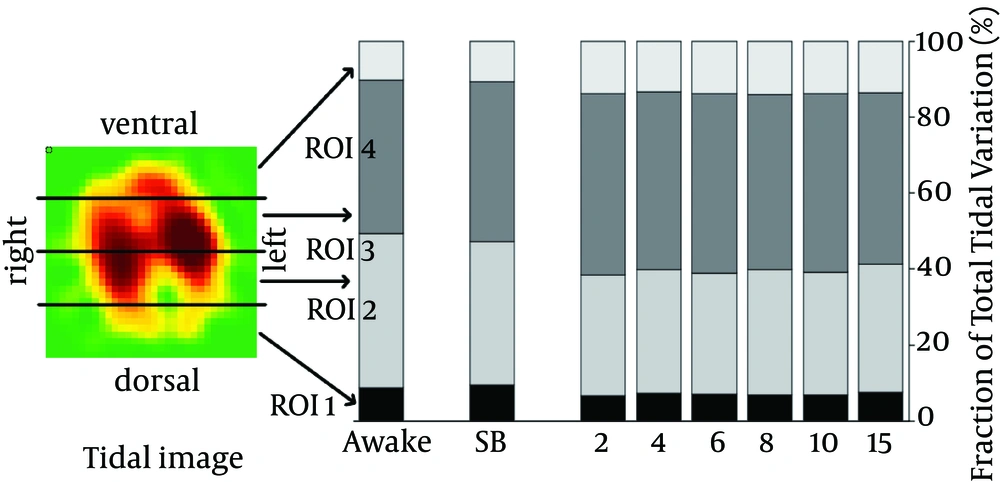
To analyze the distribution of ventilation by region of interest (ROI), the functional EIT image was divided into four stacked regions, each covering 25% of the ventrodorsal diameter, a common way of analyzing EIT images (Figure 2). We added the impedance changes of all EIT pixels per ROI and divided the sum by the total sum of impedance changes in the entire functional EIT image, resulting in the fraction of the total tidal variation per ROI (given in %). An increase in the fractional tidal variation per ROI indicates a redistribution of ventilation towards this ROI.
The stacked bars illustrate changes in the ventilation distribution across the four regions of interest (ROI; the EIT image similar to a CT slice, as if viewing it from the patient’s feet looking into the direction of the patient’s head). The ventilation is similarly configured during Awake and SB. During PSV, we observed a ventral shift in the ventilation, indicated by an increase in ventilation in ROI 3 and 4 and a decrease in ROI 2 (P < 0.05; MANCOVA with a Sidak adjustment). There was no difference between various trigger sensitivity settings.
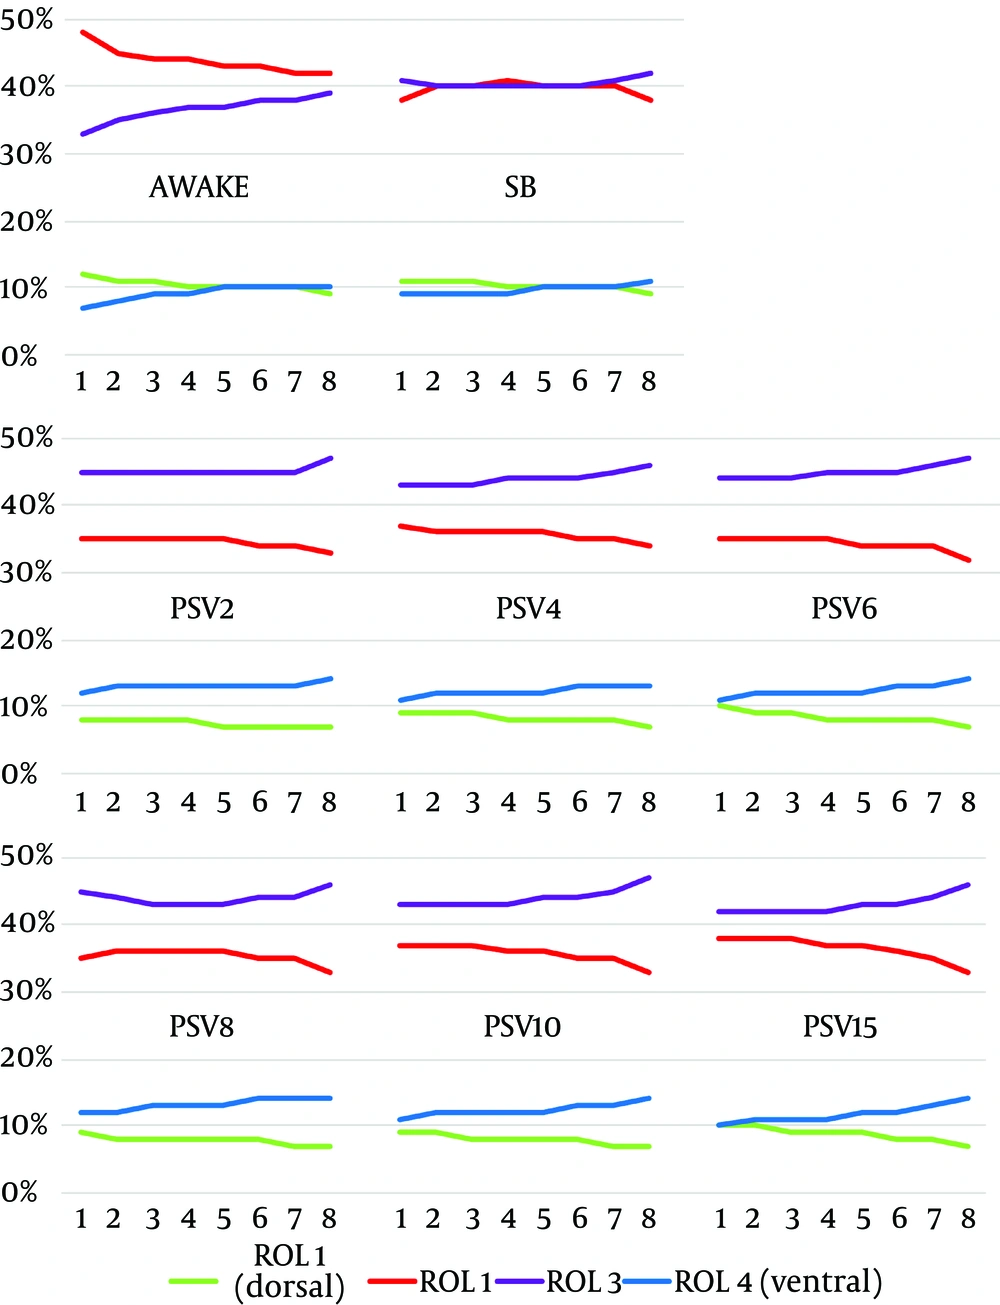
To further elucidate changes in distribution of ventilation occurring during inspiration, we calculated the regional intratidal gas distribution (ITV-Analysis) based on a method published by Lowhagen et al. (14). The inspiration was divided into eight parts of equal impedance change, and for each of these eight parts, the relative proportion of impedance change in each of the four ROIs was calculated.
3.1. Statistics
The primary outcome in this study was increase in COV during PSV at different trigger levels. In our previous study, we found an effect size of 1.82 for the difference in COV comparing SB and PSV. Based on this finding, we calculated a sample size of six patients to achieve a power of 90% with an α-error of 5% (G * Power 3.1.2 by F. Faul (15)).
Data was analyzed by multivariate analyses of variance with Sidak alpha adjustments, using the baseline values as a covariate (multivariate analysis of covariance (MANCOVA); PASW statistics release 17.0.2, SPSS Inc., Chicago, IL). This software was also used to generate the randomization list.
4. Results
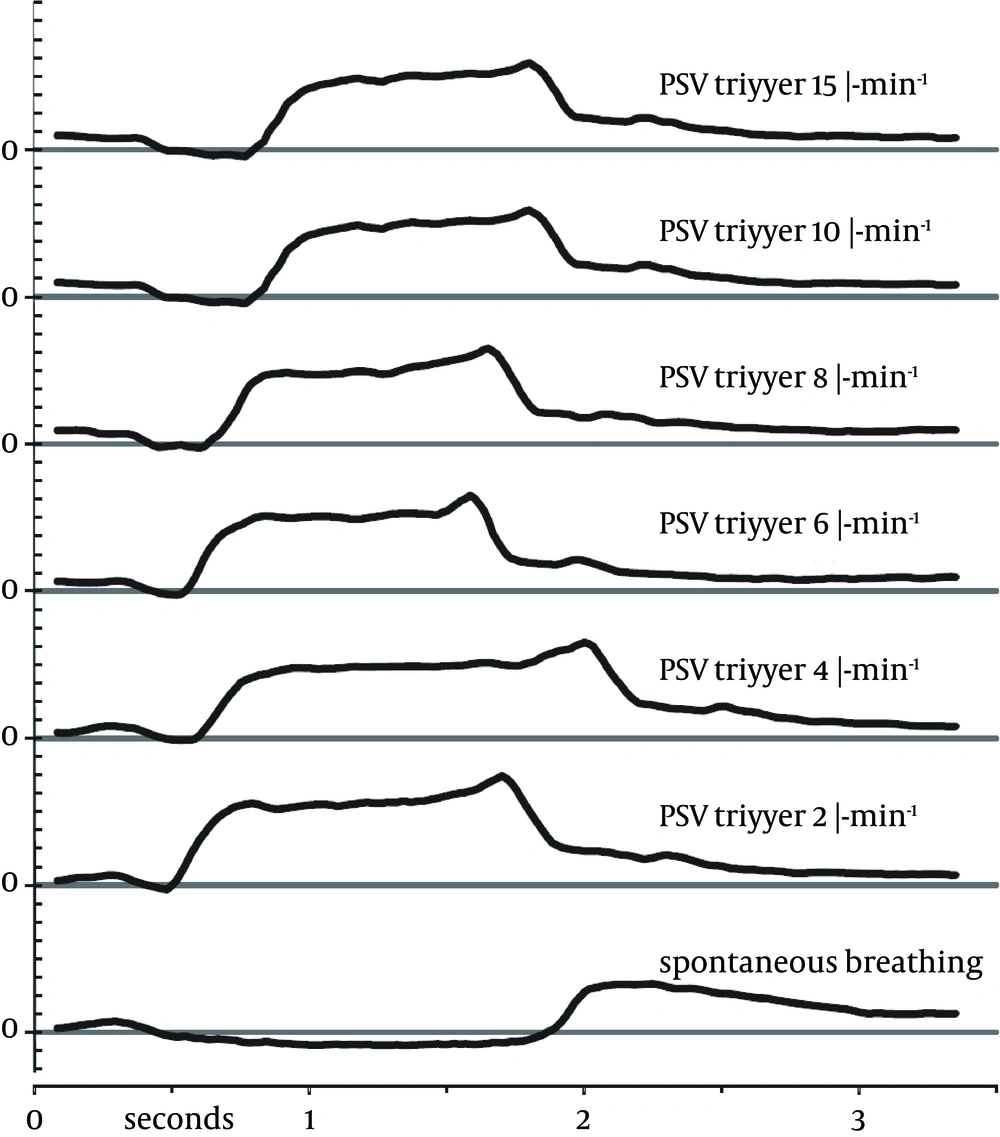
We approached six consecutive patients who fit inclusion and exclusion criteria. All agreed to participate in the study. Measurements for all six patients (Table 1) could be completed successfully without any deviations to the study protocol. The ventilation through the LMA was unproblematic with all trigger settings and no adverse events were noted. Sample pressure curves of one patient’s breaths during different trigger settings are illustrated in Figure 3.
| Patient No | Height, cm | Weight, kg | Gender b | BMI kg/m² | Type of Surgery |
|---|---|---|---|---|---|
| 1 | 170 | 77 | F | 27 | Knee arthroscopy |
| 2 | 170 | 91 | F | 31 | Tibia osteotomy |
| 3 | 173 | 76 | F | 25 | Biopsy from the tibial bone |
| 4 | 183 | 81 | M | 24 | Knee arthroscopy |
| 5 | 189 | 116 | M | 32 | Metal removal tibia |
| 6 | 166 | 60 | F | 22 | Knee arthroscopy |
a Demographic data of all patients included in our study.
bAbbreviations: F, Female; M, Male; BMI. Body Mass Index.
4.1. Ventilation
Compared to spontaneous breathing, PSV increased the tidal volume by 22% - 48%. The difference between SB and PSV was statistically significant for all trigger settings except for a trigger of 8 and 10 mL/minute, respectively. Peak pressure during PSV was 9 - 10 mbar with all trigger settings.
End-tidal CO2 was 6.3 ± 0.8 kPa during spontaneous breathing (P < 0.05). During PSV, end-tidal CO2 was slightly lower, but the difference was not statistically significant (P = 0.75). Respiratory rate was 9 - 11 mL/minute during both spontaneous breathing and PSV. Only with a trigger setting of 6 mL/minute, the respiratory rate was significantly lower (8 ± 1.4/minute).
4.2. COV and ROI Analysis
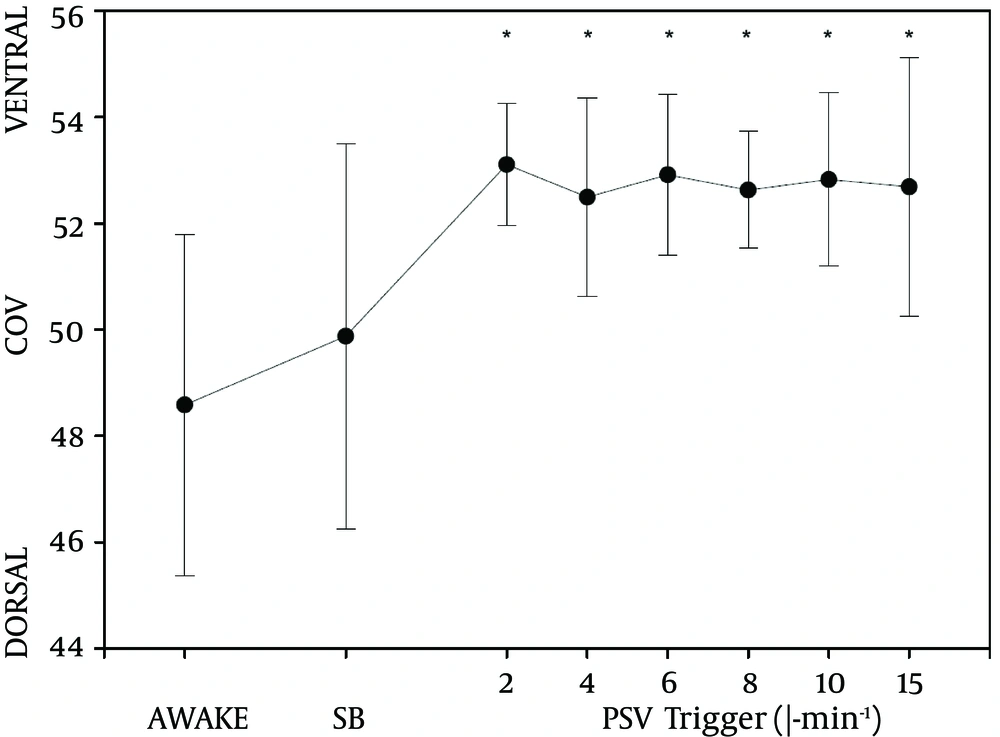
The center of ventilation before the induction of anesthesia (time point AWAKE) was 48.6 ± 1.3. During PSV, the COV moved ventrally by approximately 9% (Figure 4). This change was statistically significant (P < 0.05). We did not find a difference between various trigger settings. When PSV was turned off and patients were breathing spontaneously through the LMA during anesthesia, the COV was not different from the awake state.
An analysis of the four regions of interest (Figure 2) illustrates redistribution of ventilation. There was no difference between time points AWAKE and SB; but during PSV, ROI 3 and 4 increased, while ROI 1 and 2 decreased (P < 0.05). There was no difference in distribution of ventilation at various trigger settings.
4.3. Regional Intratidal Gas Distribution
ITV-values revealed distinct changes occurring after the induction of anesthesia and the commencement of PPV (Figure 5). During the awake state, most of the ventilation occurs in the mid-dorsal segment (ROI 2). After induction of anesthesia, ventilation in ROI 2 is reduced, while ventilation in ROI 3 increased.
During PSV, we observed a pronounced increase in the ventilation of ROI 3 and ROI 4, while ventilation in ROI 2 was further reduced. When trigger sensitivity was gradually decreased (PSV2 through PSV15), this redistribution was less pronounced at the beginning of the inspiration (e.g. 1 - 4). Regarding the distribution at the end of inspiration (e.g. 5 - 8), we did not find changes related to the trigger sensitivity.
5. Discussion
During this study on the effects of PSV-trigger sensitivity, we found a ventral shift of the center of ventilation during PSV. Detailed analysis of the inspiration revealed that the trigger settings cause subtle changes at the beginning of inspiration, but do not influence the final portion of the inspiration.
COV values before induction of anesthesia in our sample of patients were slightly dorsal from 50, a finding which corresponds well with data we obtained during the previous study. During PSV, COV moved significantly to the ventral lung regions in all patients (Figure 4). This is easily explained by the effects of positive pressure ventilation, which is known to cause increased inflation in the ventral lung regions (4). Changes we observed in the COV agree with the redistribution of ventilation as indicated by the changes in the tidal variation per ROI. Figure 2 illustrates how ventilation is redistributed from the dorsal to the ventral regions during PSV, while the ventilation distribution during SB resembles the distribution at baseline (time point AWAKE).
Regarding the effect of trigger sensitivity on the COV, we expected to see less ventral redistribution with higher trigger settings. A sensitive trigger setting results in a very short interval between the start of patients’ own inhalation effort and the beginning of positive-pressure support provided by the respirator. The pressure curves in Figure 3 illustrate this relationship: the less sensitive the trigger, the more pronounced the initial pressure drop caused by the patient’s inspirational activity. To our surprise, we did not find any difference as a result of changes in the trigger sensitivity. COV remained unchanged (Figure 4), just as the distribution of ventilation as illustrated by the ROI (Figure 2). When the pressure support was turned off (time point SB), both the COV and ROI returned to baseline values (recorded at time point AWAKE).
To further elucidate the dynamic changes of ventilation during the inspiration, we calculated ITV-values for eight subdivisions of the inspiratory course. While the COV only compares the steady state at the moment of maximum inspiration, the ITV-values reveal changes in ventilation that dynamically occur during the whole inspiration phase. This is valuable in a study like ours, where we analyzed the interaction between two different modes of ventilation; spontaneous breathing efforts at the beginning of inspiration and subsequent positive pressure support towards the end of inspiration.
The ITV-analysis does in fact reveal subtle changes during the early inspiration. During the awake state, most of the early inspiration happens in the mid-dorsal ROI 2. When comparing the awake state with anesthetized spontaneous breathing, we found that this early emphasis of ROI 2 was reduced, and throughout the whole inspiration the ventilation was distributed evenly between dorsal and ventral halves of the lung.
During PSV, however, the ventral ROIs 3 and 4 received more ventilation than the corresponding dorsal ROIs, as confirmed by the COV. COV did not detect the change in the redistribution during the early inspiration when the PSV-trigger was gradually increased. A less sensitive trigger gives the action of diaphragm more weight versus the positive pressure of the ventilator. This is apparently illustrated in the pressure-time-curves in Figure 3 and is also visible in the graphs for PSV 2 - PSV 15 in Figure 5. Regarding the late-inspiratory values, especially at data point 8, there is hardly any difference visible. Since the COV measures only this very state at the end of inspiration, it is not surprising that the COV did not show any differences between the six trigger sensitivity settings.
The tidal volume was significantly higher during PSV than SB, which is not surprising since we provided the tidal volume by choosing the settings on the ventilator. The difference was not statistically significant at trigger settings of 8 and 10 mL/minute, respectively. Lack of statistical significance comparing the tidal volume at SB vs. PSV 8 and PSV 10 is most probably due to the large standard deviations at these time points (Table 2). Our study was not powered to detect changes in this parameter; and since the mean tidal volumes are similar without any trend throughout different trigger settings, we assume that these findings are merely coincidental.
| Parameters | SB | PSV 2 | PSV 4 | PSV 6 | PSV 8 | PSV 10 | PSV 15 |
|---|---|---|---|---|---|---|---|
| End-tidal CO2, kPa | 6.3 ± 0.8 | 5.8 ± 0.7 | 5.7 ± 0.9 | 5.9 ± 0.9 | 5.8 ± 0.6 | 5.8 ± 0.6 | 5.6 ± 0.9 |
| Tidal volume, mL | 407 ± 80 | 497 ± 100 e | 582 ± 129 e | 531 ± 60 e | 543 ± 149 | 604 ± 349 | 533 ± 99 e |
| Minute volume, L•min-1 | 4.2 ± 0.5 | 4.4 ± 0.3 | 5.3 ± 0.8 | 4.4 ± 0.2 | 5.0 ± 0.6 | 5.4 ± 0.8 | 5.5 ± 0.7 |
| Respiratory rate, min-1 | 10 ± 2.6 | 9 ± 2.4 | 9 ± 2.5 | 8 ± 1.4 e | 9 ± 2.3 | 10 ± 1.4 | 11 ± 3.8 |
| Peak pressure, mbar | 3 ± 0 | 10 ± 2.9 e | 10 ± 3.2 e | 10 ± 3.4 e | 10 ± 3.3 e | 9 ± 3.5 e | 10 ± 3.1 e |
a Averaged ventilation data by trigger setting.
b The data are presented as the Mean ± Standard Deviation.
c SB, spontaneous breathing; PSV x, pressure support ventilation and the number indicates trigger setting as x mL/minute.
d There are no differences between the values at various PSV settings.
e P < 0.05 vs. SB (MANOVA).
The end-tidal CO2-values were not significantly lower during PSV than unassisted spontaneous breathing, even though the tidal volumes during PSV were significantly higher by 22% - 48% (Table 1). The minute volumes, however, were not significantly higher during PSV. Since the respiratory rate during PSV is determined by patients’ own respiratory drive, which in turn depends on his or her CO2 responsiveness, it is conceivable that patients would adjust their breathing pattern to achieve the same CO2-levels during both PSV and SB. Another indication of this mechanism is the fact that respiratory rate in our patients had a tendency to be lower during PSV, although only at one trigger setting this difference was actually significant at the 5% level.
5.1. Limitations
Our study was powered to detect changes in the COV. Our more detailed analysis by ITV-values creates a large number of additional data points, therefore a detailed statistical analysis of all changes in the eight segments in all trigger settings would require such a massive correction for multiple testing, in which we cannot expect any significance in statistical testing with the number of patients included in the study. This is also illustrated by the inconsistency in the results for time point PSV 8, which does not seem to be in line with gradual changes observed during PSV 2 - PSV 15. Nevertheless, changes in the ITV-values appear to correlate with changes in the PSV-trigger settings, which are in compliance with the physiology of respiration. Based on the findings of this study, we plan future studies to further elucidate the influence of intraoperative ventilator settings on redistribution of ventilation in the lungs.
Another important aspect would be application of PEEP to all of the ventilation modes. High PEEP settings (> 10 mmHg) have been shown to reduce dorsal atelectasis formation (16). However, for the present study, we were interested comparing PSV with awake spontaneous breathing, and the use of PEEP would introduce an additional confounder. The influence of PEEP on redistribution of ventilation during general anesthesia needs to be addressed in future studies.
During general anesthesia with an LMA, PSV induces a ventral redistribution of ventilation. The sensitivity of the PSV-trigger seems to influence redistribution in early inspiratory phase, but not in the late phase of inspiration. These findings suggest that a less sensitive trigger setting could be beneficial to attenuate the effects of PPV when unsupported spontaneous breathing is not feasible during general anesthesia.
