1. Background
One of the main challenges in anesthesiology is difficult intubation. Many clinical criteria have been introduced with regard to evaluation of the patient’s airway before induction of anesthesia, including Mallampati classification, mouth-opening size, thyromental distance, neck extension, jaw protrusion, and the upper-lip bite test (1).
A method that can rather reliably predict difficult intubation is the Cormack-Lehane classification, which is done with direct laryngoscopy. However, laryngoscopy is an invasive procedure that is almost impossible to perform in an awake patient, and it cannot be used to predict difficult tracheal intubations in patients undergoing general anesthesia for the first time (2, 3).
On the other hand, ultrasonography is a non-invasive, safe, and painless modality for evaluating the soft tissues. Different sonographic techniques for airway evaluations have been used in prior studies (4-6). Using 24 healthy volunteers, Singh et al. performed systematic sonographic examinations of the upper airway from the floor of the mouth to the suprasternal notch, and concluded that this technique was capable of providing detailed anatomic information, with numerous potential clinical applications (6).
In a study by Gupta et al. on 72 patients scheduled for tracheal intubation under general anesthesia, the following measurements were obtained on oblique-transverse ultrasound views of the airway: (a) the distance from the epiglottis to the midpoint of the distance between the vocal folds, (b) the depth of the pre-epiglottic space (PE), and (c) the total time taken by the operator to achieve the final ultrasonic image. These data were compared with the Cormack-Lehane classification obtained during direct laryngoscopy in the operating room. It was found that Cormack-Lehane (CL) grade can be adequately (with 67% - 68% sensitivity) predicted by the ratio of PE and E-VC distances (PE/E-VC) {0 < [PE/E-VC] < 1 ≈ CL grade 1; 1 < [PE/E-VC] < 2 ≈ CL grade 2; and 2 < [PE/E-VC] < 3 ≈ CL grade 3} (7).
2. Objectives
The primary endpoint of our study was to compare and correlate the ultrasound view of the larynx before anesthesia with Cormack-Lehane classification during direct laryngoscopy under general anesthesia. The secondary endpoint was to compare and correlate the ultrasound view of the larynx with Mallampati classification, evaluated before anesthesia induction.
3. Methods
This cross-sectional descriptive-analytic study was performed in 2015 at Dr. Shariati hospital of Tehran University of Medical Sciences. The study included 53 ASA class I–III patients aged 18 - 70 years, who were scheduled for elective surgery under general anesthesia with direct laryngoscopy and endotracheal intubation.
The exclusion criteria were edentulousness, anatomical abnormalities of the craniocervical region, a mouth opening of < 4 cm, inability to hyperextend the neck, body mass index of ≥ 40, and fractures of the maxillofacial or cervical bones.
After obtaining informed oral consent from each patient, pre-anesthetic assessment of the airway was documented based on Mallampati classifications as follows:
Class 1: Full visibility of tonsils, uvula, and soft palate.
Class 2: Visibility of hard and soft palate, upper portion of tonsils, and uvula.
Class 3: Visibility of soft and hard palate and base of the uvula.
Class 4: Only hard palate visible.
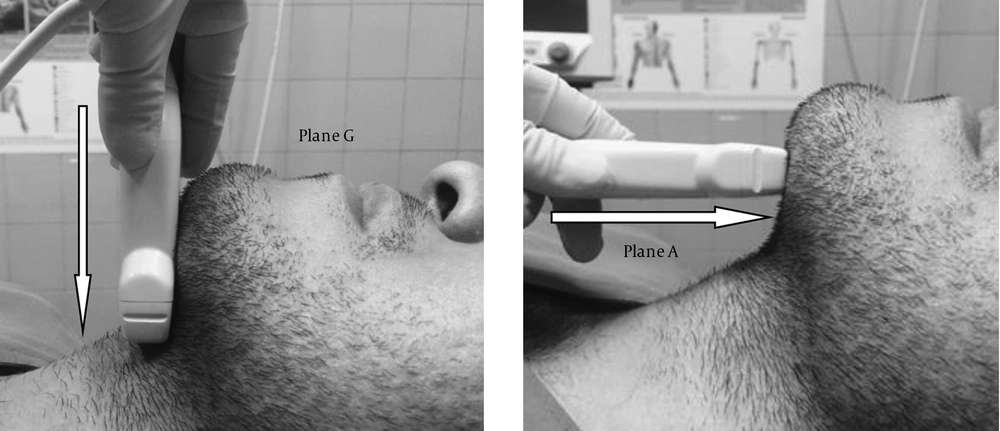
Next, ultrasound views of the airway were obtained by an anesthesiology resident under the supervision of the attending anesthesiologist, using a high-frequency linear probe (Medison L5-12EC). Each patient was placed in the supine position with active maximal head-tilt and chin-lift, and the probe was placed in the midline aspect of the submandibular region. The position of the probe was kept unchanged, only rotating from cephalad (plane A, a coronal plane to see the mouth opening) to caudal (plane G, an oblique transverse plane bisecting the epiglottis and posterior-most part of the vocal folds with arytenoids) in a single two-dimensional view. Further rotation of the ultrasound probe was stopped upon visualization of plane G (Figure 1).
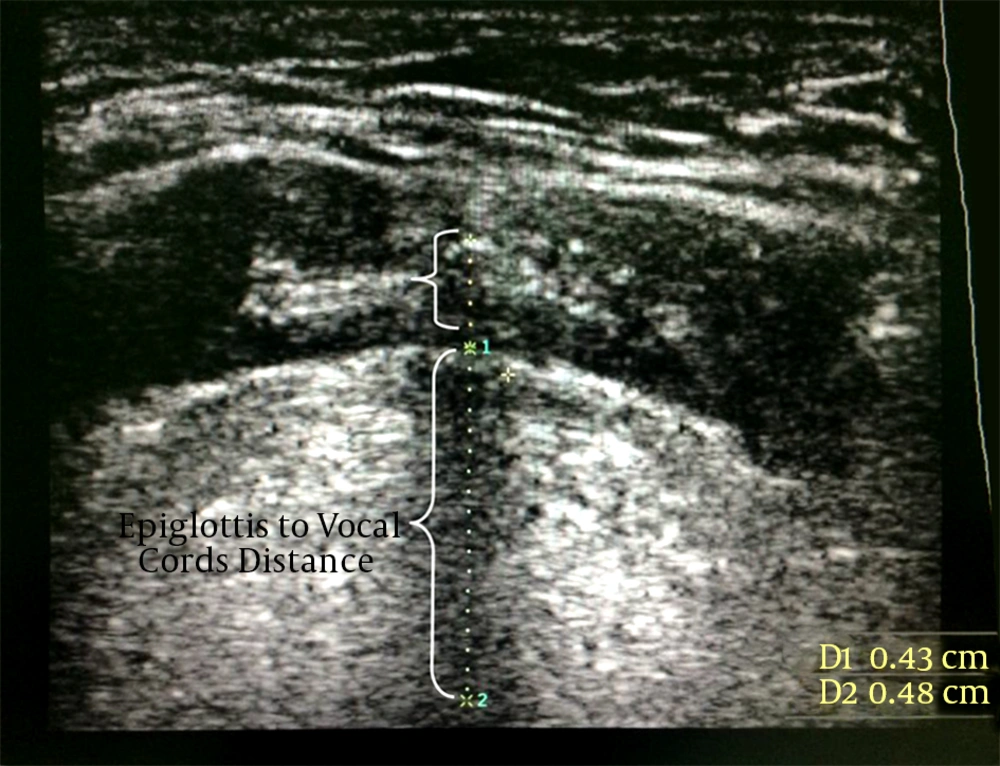
Plane G was used for sonographic measurements, including (I) the distance from the epiglottis to the midpoint distance between the vocal folds and (II) the PE depth (Figure 2). The total time taken to obtain plane G was also recorded.
Subsequently, the patient was taken to the operating room, where standard general anesthesia procedures were performed by the anesthesiologist. The anesthesiologist was asked to document the Cormack-Lehane grade of the vocal-cord view by direct laryngoscopy performed intra-operatively, as follows:
Grade I: Visualization of the entire laryngeal aperture.
Grade II: Visualization of parts of the laryngeal aperture of the arytenoids.
Grade III: Visualization of only the epiglottis.
Grade IV: Visualization of only the soft palate.
Correlations between pre-operative Mallampati classifications and Cormack-Lehane grades were assessed. The regression coefficients for correlating the ultrasound measurements and Cormack-Lehane grade were then determined, and a P value of < 0.05 was considered significant.
3.1. Statistical Analysis
Statistical analysis was performed using SPSS (version 22, SPSS, Chicago, IL, USA). The correlation between nominal and qualitative variables was assessed using the Chi-square test. The correlation between independent quantitative and qualitative variables was assessed with the t-test. Correlation coefficient and regression analyses were used for quantitative variables. Receiver operating characteristic (ROC) was used for calculation of sensitivity and specificity.
4. Results
Of the 53 consecutive patients who were enrolled in this study, three were excluded due to regional anesthesia and another three were excluded because the related technical data collection was incompletely recorded. A total of 47 patients were finally analyzed.
The demographic data of the patients are presented in Tables 1 and 2. We had no cases of Cormack-Lehane grade IV in our patients. The average time of laryngeal sonography was 27 ± 1.14 seconds.
The correlation between PE and Cormack-Lehane grade I was weak, with a regression coefficient of -0.261 (95% CI, -0.77 to 1.484; P = 0.076). The correlation between the distance from the epiglottis to the vocal cords (E-VC) and Cormack-Lehane grade I was weak, with a regression coefficient of 0.029 (95% CI -1.744 to -2.114; P = 0.847). The correlation between PE and Cormack-Lehane grade II was weak, with a regression coefficient of -0.354 (95% CI 1.759 to 0.204; P = 0.051). The correlation between the distance from the epiglottis to the vocal cords (E-VC) and Cormack-Lehane grade II was weak, with a regression coefficient of -0.074 (95% CI -1.489 to -2.469; P = 0.62). The correlation between PE and Cormack-Lehane grade III was weak, with a regression coefficient of 0.125 (95% CI -0.698 to 1.705; P = 0. 403). The correlation between the distance from the epiglottis to the vocal cords (E-VC) and Cormack-Lehane grade III was weak, with a regression coefficient of 0.151(95% CI -1.402 to 4.313; P = 0.310).
| Variable | Valuesa |
|---|---|
| Male/female | 34/13 |
| Age, y | 39.1 ± 11.3 |
| Weight, kg | 71.9 ± 1.1 |
| Height, cm | 165.2 ± 9.1 |
| BMI, kg/m2 | 26.4 ± 4.7 |
| ASA Class I/II/III | 15/30/2 |
Demographic Data of the Study Patient Population
| Cormack-Lehane Grade | Number of Patients |
|---|---|
| I | 23 |
| II | 18 |
| III | 6 |
| IV | 0 |
Frequency of Cormack-Lehane Grades in the Study Population
The correlation between the PE/E-VC ratio and Cormack-Lehane grade I was weak, with a regression coefficient of 0.131 (95% CI -0.052 to 0.133; P = 0.310). The correlation between the PE/E-VC ratio and Cormack-Lehane grade II was weak, with a regression coefficient of -0.110 (95% CI -0.130 to 0.060; P = 0.461). The correlation between the PE/E-VC ratio with Cormack-Lehane grade III was weak, with a regression coefficient of -0.035 (95% CI -0.156 to 0.133; P = 0.813).
The PE/E-VC ratio for the correlation between the sonographic view and laryngoscopy showed 87.5% sensitivity and 30% specificity. There was no correlation between Mallampati class and the PE/E-VC ratio (P > 0.05).
5. Discussion
Evaluation of the patient’s airway and prediction of difficult intubation before induction of anesthesia is performed using a constellation of criteria, including Mallampati classification, mouth-opening size, thyromental distance, neck extension, jaw protrusion, and upper-lip bite test. These criteria are not applicable in emergency settings or in patients with decreased consciousness and who are uncooperative. Furthermore, the Cormack-Lehane grade does not always correlate with the abovementioned criteria. Therefore, the use of another non-invasive and more accurate method is necessary (1-3).
In prior studies, sonography has been proven to be a non-invasive and reliable method for evaluation of the airway (5, 8 and 9). In a study by Adhikari et al. in 2011, performed on 51 patients undergoing elective surgery under general anesthesia, airway evaluation tests were done before anesthesia. Afterward, the anteroposterior diameters of the geniohyoid muscle and soft tissues of the anterior neck were measured at the level of the hyoid bone, then correlated with Cormack-Lehane grade during anesthesia with direct laryngoscopy. The results showed that sonographic measurements could predict difficult intubation. This was different from our results, which could be partly due to the different sonographic measurement criteria used in our study. On the other hand, the previous study revealed no correlation between Mallampati classification and sonographic measurements, which was in accordance with our study (10).
In a study by Gupta et al. in 2012 on 72 patients undergoing general anesthesia, significant correlations were found between Cormack-Lehane grade and sonographic measurements, PE, and the distance from the epiglottis to the vocal cords (PE/E-VC). They showed that the higher the PE/E-VC ratio, the stronger the possibility of a higher Cormack-Lehane grade on direct laryngoscopy and of difficult intubation. Although the sensitivity of our study was higher than that of Gupta et al. (87% versus 68%), no significant correlation was found between PE/E-VC and Cormack-Lehane grade in our study (7). The reason for this difference could be explained by the different airway anatomies in patients of different races, the smaller sample size in our study, and different levels of experience in performing airway sonography. We also found no correlation between Mallampati class and PE/E-VC ratio, which was not evaluated in Gupta et al.’s study.
Our study revealed a weak correlation between PE/E-VC and Cormack-Lehane grade, with 87% sensitivity and 30% specificity. Therefore, we concluded that sonographic measurement criteria are not accurate for evaluation of the airway before anesthesia.
5.1. Limitations
Forty-seven patients with a maximum age of 50 years were included in our study, which may explain the absence of patients with Cormack-Lehane grade IV. Therefore, it is recommended that the study be repeated with larger sample sizes.

