


1. Background
Hypertension (HTN) is the most prevalent cardiovascular disease. The prevalence rate varies with respect to age, race, education, and many other factors. Long-term increased arterial blood pressure (BP) will result in heart and renal failures, coronary artery diseases and cerebrovascular accident. It has been declared that by effective treatment, the rate of mortality and morbidity would considerably decrease. Even mild rise of BP by more than or equal to 140/90 mmHg in youth or middle-aged adults would increase the risk of injury to the vital organ. HTN is usually multifactorial; epidemiologic studies have mentioned genetic predisposition, mental distresses, dietary and environmental factors such as increased salt consumption and decreased dietary potassium as the probable causes of HTN. Coronary artery bypass grafting (CABG) is a surgery that aims to correct the blood flow to the heart. This procedure is used to treat patients with severe coronary artery diseases. CABG is a therapeutic surgery in which healthy an artery or vein is grafted and the blocked coronary arteries are bypassed (1). Angiotensin converting enzyme inhibitors (ACEI) are used increasingly as the first therapeutic choice for HTN. They are useful in inhibiting vasoconstrictor (angiotensin) and preventing inactivation of vasodilator (bradykinin). They change prostaglandin production and can balance the action of adrenergic nervous system. ACEI are used especially for renal HTN in patients with diabetic and in malignant accelerated HTN. Nowadays, it is proved that the activation of the rennin-angiotensin-aldosterone system is responsible for harmful effects on cardiovascular and renal systems. In fact, ACEIs considerably reduce the mortality rate, myocardial infarction (MI), and heart attack in high-risk patients (2).
2. Objectives
Regarding the abovementioned explanations, the objective of this research was to study the effects of ACEIs on hemodynamic changes and vasoactive drugs requirement before, during, and after CABG.
3. Patients and Methods
After achieving approval from the Ethics Board of Jundishapur University of Medical Sciences, Ahvaz City, Iran, 54 patients who were candidate for CABG surgery by pump-off method were randomly selected through hospitalized patients in the cardiac surgery ward of Ahvaz Golestan Hospital during 2013. Subjects were allocated to two groups, namely, experimental and control. The inclusion criteria were positive history of ischemic heart disease with the involvement of the coronary arteries, the blockage of two to three major vessels, history of MI, HTN, hyperlipidemia, and American Society of Anesthesiologists (ASA) class III irrespective of ACEI consumption to control HTN. The exclusion criteria were the history of renal and hepatic failure, pregnancy, allergy to ACEI, angioedema, and operation with pump-on method.
Control group included 27 people who did not take ACEI to control HTN; in this group, 25-mg metoral four times a day was prescribed in order to control BP. Experimental group included 27 patients who received 25-mg captopril, an ACEI, twice a day for at least seven days before the surgery. Flow chart of inclusion and exclusion and CONSORT chart are presented in Figures 1 and 2, respectively.
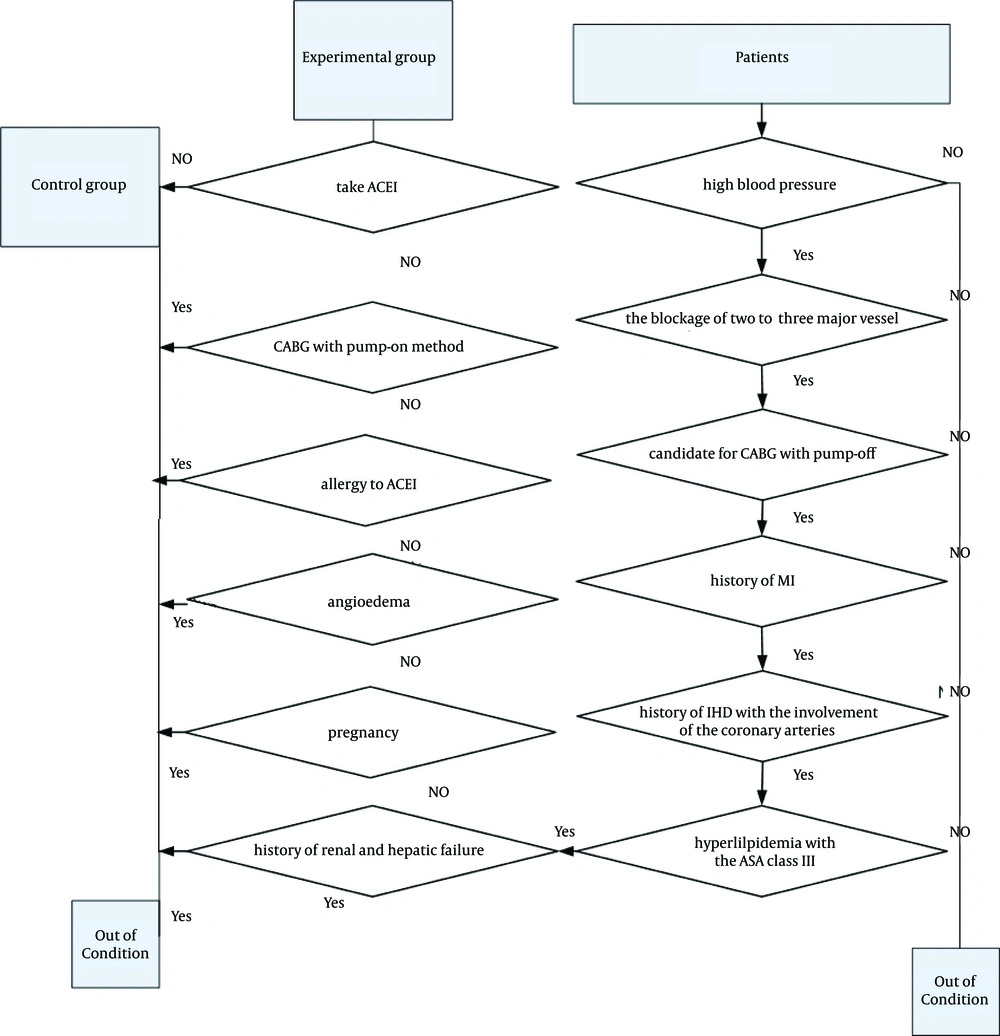
Figure 1.
Flow Chart of Inclusion and Exclusion of Participants
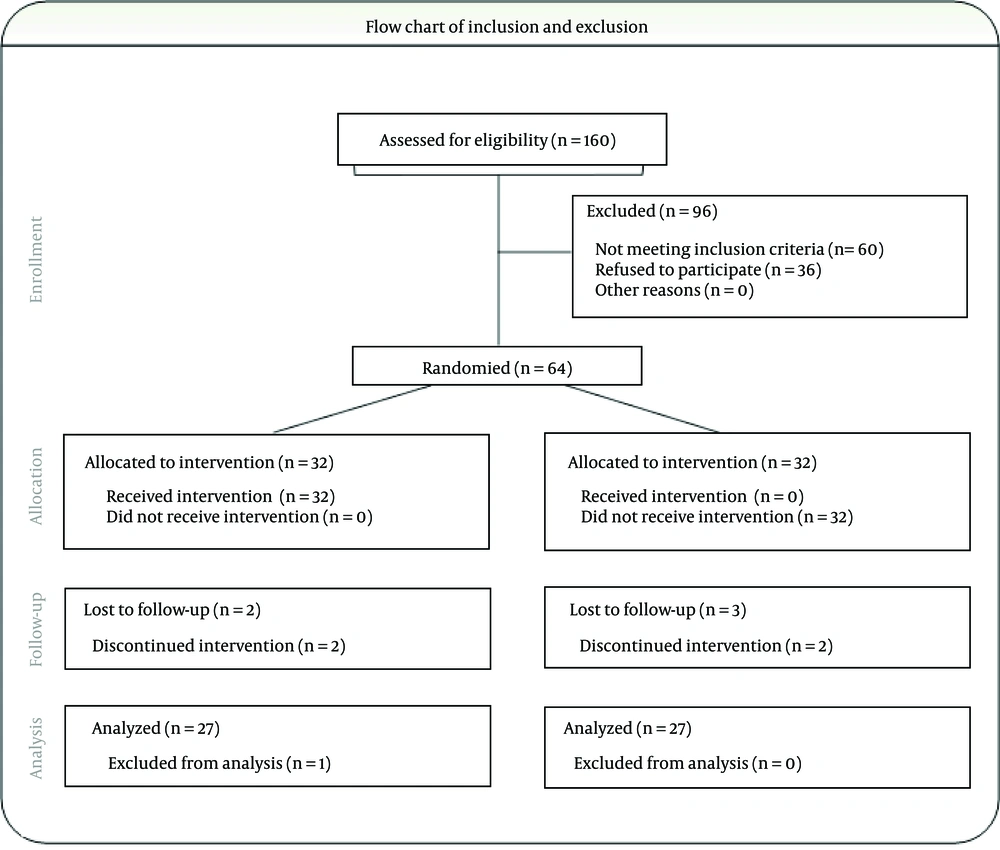
Figure 2.
CONSORT Chart
Subjects were selected according to the patients’ flow chart. All the participants had indwelling urethral (Foley) catheter, artery catheter, central venous line to measure the central venous pressure (CVP) and pulse oximeter. In operating room, patients were observed by invasive and non-invasive BP methods as well as cardiac monitoring. Patients received ringer serum (6 mL/kg), midazolam (0.1 mg/kg), fentanyl (5-8 µg/kg), sodium thiopental (STP; 3-5 mg/kg), and atracurium (0.5 mg/kg). General anesthesia was induced. Vital signs such as BP, pulse rate (PR), and oxygen saturation (SO2) were recorded. If systolic BP decreased to 90 mm Hg or lower, 2 to 5 µg/kg/minute of dobutamine would be infused as a vasopressin.
Repeated measures, Mauchly’s method, epsilon correction coefficient, and least significance test (LSD) were used to analyze by the achieved evidences based on the data structure. P value > 0.05 was considered as statistically significant.
4. Results
A total of 54 patients were enrolled in this study and 27 were allocated to the experimental and 27 to the control groups. The age, weight, and P value of the experimental and control groups are presented in Table 1.
Table 1. Comparison of Age and Weight Between Groupsa
| Experimental Group | Control Group | P Value | |
|---|---|---|---|
| Age, y | 59.2 ± 9.2 | 55.5 ± 1.5 | 0.06 |
| Weight, kg | 59.4 ± 9.0 | 69.9 ± 1.5 | 0.08 |
aData are presented as mean ± SD.
Based on the results of the Table 1 and according to the results of LSD test, there was no significant difference with regard to the age and weight between study groups. Comparison of the means of diastolic and systolic BP, SO2, and PR in two groups before, during, and after CABG is shown in Table 2.
| Time Sections | Experimental Group, Mean | Control Group, Mean | P Value |
|---|---|---|---|
| Diastolic BP | |||
| Before CABG | 87.9 | 77.9 | 0 |
| During CABG | 50.0 | 56.9 | 0.001 |
| After CABG | 61.0 | 62.8 | 0.009 |
| Systolic BP | |||
| Before CABG | 134.7 | 130.2 | 0.001 |
| During CABG | 93.1 | 110.0 | 0 |
| After CABG | 111.9 | 119.7 | 0.007 |
| SO2 | |||
| Before CABG | 99.2 | 99.2 | 0.15 b |
| During CABG | 98.2 | 99.2 | 0.08 b |
| After CABG | 99.1 | 99.3 | 0.53 b |
| PR | |||
| Before CABG | 88.4 | 89.3 | 0.09 b |
| During CABG | 85.0 | 88.3 | 0.25 b |
| After CABG | 86.1 | 90.3 | 0.15 b |
aAbbreviations: BP, blood pressure; CABG, coronary artery bypass grafting; SO2, oxygen saturation; and PR, pulse rate.
bP Value > 0.05
Based on the results of the Table 2, diastolic and systolic BP at all time points (before, during, and after CABG) were significantly different between two groups. According to the results of LSD test, SO2 and PR before, during, and after surgery had no difference between study groups.
| Mean Dose of Dobutamine, µg/kg/min | Hypotension During CABG, % | P Value | |
|---|---|---|---|
| Experimental Group | 4.5 ± 0.5 | 70 | |
| Control Group | 1.6 ± 0.4 | 30 |
aAbbreviations: CABG, coronary artery bypass grafting.
bP Value > 0.05
The frequency of hypotension during CABG between the two groups and the dose of dobutamine as a vasoactive are shown in Table 3. The mean dose of dobutamine during CABG was significantly different between the study groups. The results of the statistical analysis for systolic BPs, PR, and SO2 are shown in.
5. Discussion
ACEI are used widely in treatment of patients with cardiac failure and HTN after MI. These drugs have been shown to decrease mortality and adverse cardiovascular events and improve quality of life (3, 4).
There are many patients under treatment with ACEI who present for cardiac surgery and anesthesia. There are several reports of adverse events in the preoperational period including hypotension on induction of anesthesia (5, 6) and increased requirement for vasoconstrictors during and after separation from cardiopulmonary bypass (7, 8). Although normal preoperational practice is to advise patients to take their regular cardiovascular medications up to and including the day of surgery, some authors suggested that omitting ACEI before surgery would improve hemodynamic control during anesthesia (9, 10).
Pigott et al. studied the effect of ACEI elimination on hemodynamic changes during CABG surgery. It was declared that patients who discontinued ACEI had higher mean arterial pressure in the postsurgical period and needed less vasopressor during CABG surgery; these patients would need more vasodilator for controlling BP after using ACEI and during the postoperative period. The results showed that discontinuing ACEI before surgery did not have any priority to the previous method (11).
In addition, in a study conducted by Lausevic-vuk et al., the hemodynamic effect of ACEI on the heart failure in patients during CABG surgery was evaluated. The systolic BP and the pulmonary vein resistance decreased in comparison with the control group. There was no significant difference between the experimental and control groups with regard to systemic venous resistance, arterial SO2, PR, and systolic BP; however, ACEI had significantly reduced the mortality rate. In their research, best effect on hemodynamic changes was achieved by cardiopulmonary bypass and by managing the use of ACEIs (12).
In another study conducted by Lee et al. the effects of preoperative ACEI treatment on hemodynamic status and vasoconstrictor requirements during off-pump coronary artery bypass surgery (OPCAB) were evaluated. No significant differences in the hemodynamic parameters were detected between the two groups except for cardiac output that was significantly greater in the control group. They concluded that preoperative treatment with ACEIs would significantly increase the amount of vasoconstrictor needed to maintain the target SAP during anastomosis of obtuse marginal branch of the left circumflex artery as well as during OPCAB (13).
Shahzamani et al. studied the effect of the ACEIs on the hemodynamic changes in patients undergoing CABG surgery and showed that the rate of hemodynamic inconstancy including hypotension in patients treated with ACEIs was higher than the usual. Nevertheless, analyzing the experiments of the CABG surgery showed that using high doses of ACEI will cause hypotension attack and the patients who received the ACEI needed 30% more doses of sympathetic agonist than control group; however, hemodynamic changes in the intensive care unit were not significant (14).
The study conducted by Drenger et al. suggested that withdrawal of ACEI treatment after CABG surgery is associated with nonfatal in-hospital ischemic events. Furthermore, continuation of ACEI or de novo ACEI therapy early after cardiac surgery is associated with improved in-hospital outcomes (15).
ACEIs are very prevalent and reduce mortality and morbidity (3, 12); however, they can cause more hypotension during the CABG. Analyzing the experiments of the CABG surgery showed that using high-dose ACEI will cause hypotension attack. Preoperative treatment with ACEIs will significantly increase both the quantity of vasoconstrictor consumption and hypotension probability during CABG. We conclude that consumption of ACEI before CABG would cause hypotension and increase use of dobutamine during surgery as the previous studies had suggested.
