1. Background
Many lower limb and lower abdominal surgeries are performed under spinal anesthesia. Subarachnoid access may be difficult to perform for inexperienced practitioners, or when patients have either an unusually large or small body habitus. Prior knowledge of how far the needle needs to be inserted to reach the intrathecal space may reduce the potential complications of spinal anesthesia (1). Multiple attempts to place the needle into the subarachnoid space not only cause discomfort and dissatisfaction for the patient, they can also increase the likelihood of post-punctural headaches (2), neurological damage, (3), and epidural hematoma (4).
2. Objectives
Through this study, we would like to design a practical measure for estimating the depth of needle insertion, to attain successful spinal anesthesia based on the patient’s anthropometric characteristics.
3. Patients and Methods
After approval by the ethics committee of the university, and the obtaining of written informed consent from all subjects 385 patients with ASA class I – II, aged 18 - 65 and undergoing elective surgery on their lower abdomen and limbs under spinal anesthesia, who were admitted to Shahid Beheshti hospital of Kashan University of Medical Sciences (KAUMS) during 2012, were enrolled in this cross-sectional study. Before surgery, height, weight, gender, body mass index (BMI), waist circumference (WC), the line that passes across the upper iliac crest’s edge in a sitting position, and the arm circumference (exactly 10 cm above the cubital fossa) were measured. In addition, the spinal anesthesia method was explained to the patients, and their consent was obtained for performing the block. Pregnant women were excluded from the study. In the operating room, the anesthesiologist (who had experience of at least 500 cases of spinal block), after preparing the patient, performed the spinal anesthesia using a 25 G cutting (Qinke) needle through the midline at L4 - 5 and L5 - S1 level (using Tuffier’s line) in the sitting position. After the medication was injected, the insertion point was marked on the needle, which was then removed. The depth to which the needle had entered the patient’s body was then carefully measured with a caliper and recorded. Patients with a skin infection at the site of the block, who were unable to maintain sitting position without assistance, who exhibited kyphosis, lordosis, or scoliosis, or who had a failed block were excluded from the study. The main statistical tests used were linear regression and t-student test. A Pearson correlation coefficient of r > 0.7 indicated a strong relationship between dependent and independent parameters; the significant level was set at P < 0.05. SPSS software, version 13.0 (SPSS Inc., Chicago, Illinois, USA) was used for data analysis.
4. Results
Demographic details of the 385 patients who participated in the study are presented in Table 1. Based on the regression analysis between the needle depth and study variables, the following results were obtained:
| Demographic/Procedural Data | Values |
|---|---|
| Age, y | 37.25 ± 13.37 |
| Gender | |
| Male | 297 |
| Female | 88 |
| Type of surgery | |
| Lower abdominal | 105 |
| Urology | 79 |
| Gynecology | 46 |
| Orthopedic | 155 |
| Weight, kg | 72.7 ± 12.1 (37.0 - 107) |
| Height, cm | 170.7 ± 7.4 (152.0 - 190) |
| BMI, kg/m² | 24.9 ± 3.9 (15.4 - 40.1) |
| Arm circumference, cm | 27.9 ± 4.9 ( 15.0 - 87.0) |
| Waist circumference, cm | 84.7 ± 12.4 (28.0 - 133.0) |
| Spinal needle Depth ,cm | 3.3 - 7.8 |
| Spinal needle Insertion Space, No. (%) | |
| L4/L5 | 331 (86) |
| L5/S1 | 54 (14) |
Abbreviation: BMI, body mass index.
4.1. Depth of Needle Insertion and Weight Correlation
The linear correlation between depth of needle insertion and weight was significant; 0.66% variation in depth of needle insertion will be interpretable by this model. Pearson correlation coefficient (r) = 0.817; P < 0.001.
4.2. Depth of Needle Insertion and Height Correlation
The correlation between depth of needle insertion variables and patients’ height was inverse and insignificant. This model can only explain about 9% of depth of needle insertion variables (P = 0.091, r = 0.107).
4.3. Depth of Needle Insertion and Body Mass Index Correlation
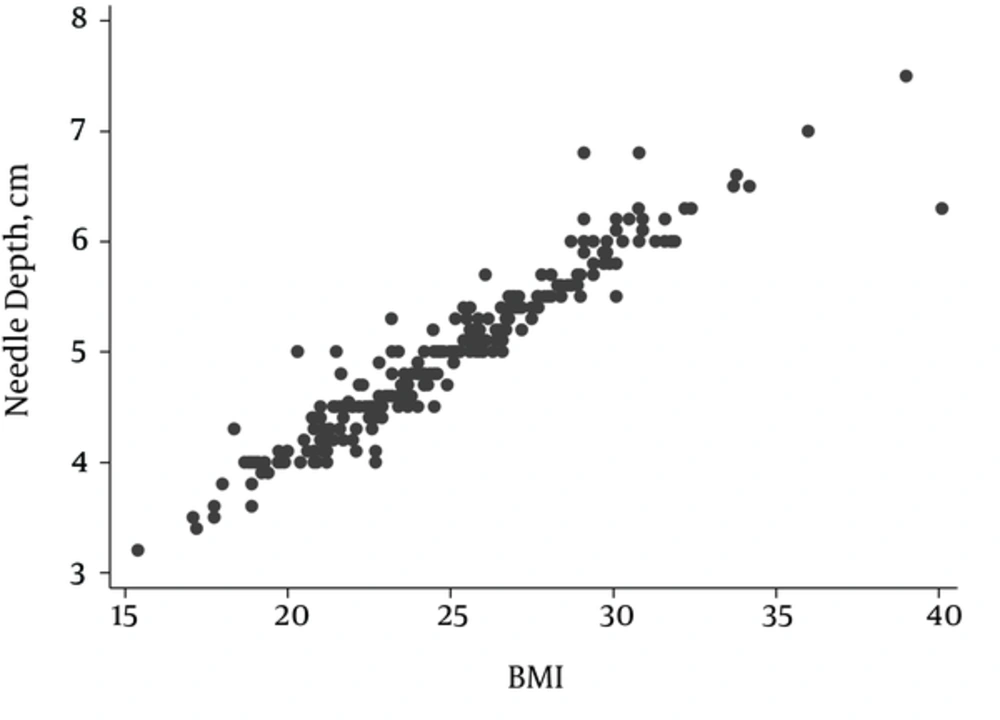
There was a significant correlation between depth of needle insertion and BMI. Based on the R2 calculation in the regression model, nearly 90% of depth of needle insertion variables can be interpreted by this model. As shown in Figure 1, this correlation was very strong and significant (P < 0.001, r = 0.95).
4.4. Arm Circumference and Depth of Needle Insertion Correlation
The correlation between these parameters was significant but weak, and only 40% of depth of needle insertion variables were predictable using this model (P < 0.001, r = 0.630).
4.5. The Waist Circumferenc (WC) and Depth of Needle Insertion Correlation
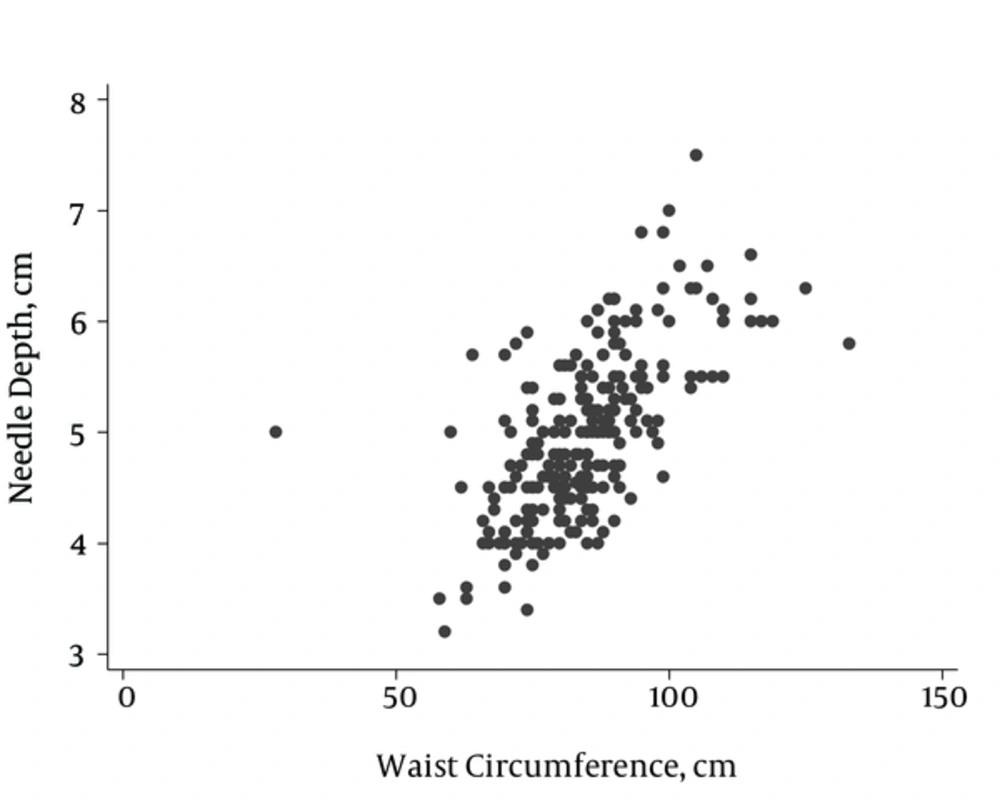
The correlation between the WC and depth of needle insertion was significant; however, according to the regression model, only 43% of depth of needle insertion variables were predictable using this model (P < 0.001, r = 0.657) (Figure 2).
4.6. Correlation Between age and Depth of Needle Insertion
In this study, age was considered as an independent parameter when determining the depth of needle insertion. There was no significant correlation between age and depth of needle insertion (r = 0.12, P = 0.6). Considering that most of the patients were adults over 20 years of age, a significant change in the depth of needle insertion is not expected in this age group.
4.7. Correlation Between Weight/Height Ratio and Depth of Needle Insertion
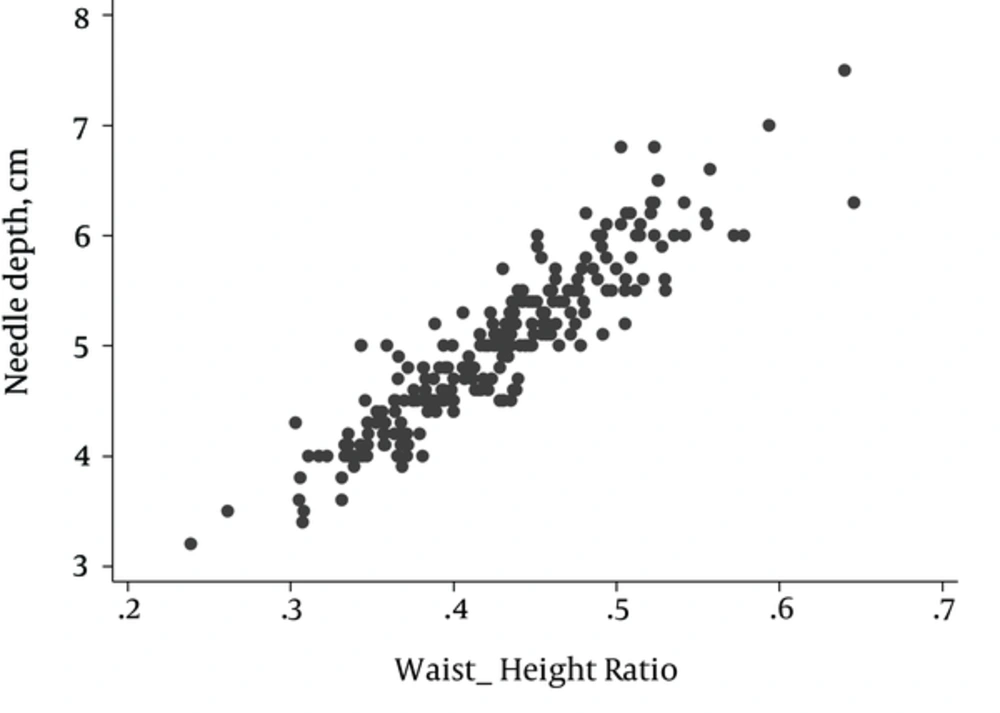
The weight/height ratio is an index used to predict depth of needle insertion. In this model, the Pearson correlation coefficient between these parameters is significant (r = 0.917, P < 0.001). 84% of needle changes are predictable using this model (Figure 3). The best model for predicting depth of needle insertion, according to the weight/height ratio with the least residual, is:
Needle depth = 0.69 + (10.1 × W/H)
4.8. Needle Depth Correlation With Gender and Study Variables
In terms of sex (male and female), there was no significant correlation between depth of needle insertion and arm circumference (P = 0.187), weight (P = 0.665), height (P = 0.11), BMI (P = 0.54), and weight/height ratio (P = 0.874). The WC in women had a higher correlation with depth of needle insertion, and the difference between males and females was significant (P = 0.046) (Table 2). The best statistical model for predicting the spinal depth of needle insertion was in the form of the two equations for the depth of needle insertion correlations with weight/height ratio (graph A) and BMI (graph B):
A: Needle depth = 0.69 + (10.1 × W/H)
B: Needle depth = 0.56 + (0.18 × BMI)
| Parameter | Male | Female | Total | P Value | ||||||
|---|---|---|---|---|---|---|---|---|---|---|
| r | P Value | R2 | r | P Value | R2 | r | P Value | R2 | ||
| Weight | 0.82 | < 0.001 | 0.67 | 0.801 | < 0.001 | 0.64 | 0.817 | < 0.001 | 0.66 | 0.67 |
| Height | 0.058 | 0.422 | 0.003 | 0.227 | 0.037 | 0.08 | 0.107 | 0.09 | 0.01 | 0.11 |
| BMI | 0.948 | < 0.001 | 0.9 | 0.963 | < 0.001 | 0.93 | 0.952 | < 0.001 | 0.9 | 0.55 |
| AC | 0.668 | < 0.001 | 0.44 | 0.48 | < 0.001 | 0.23 | 0.63 | < 0.001 | 0.4 | 0.19 |
| WC | 0.654 | < 0.001 | 0.42 | 0.68 | < 0.001 | 0.46 | 0.657 | < 0.001 | 0.43 | 0.04 |
| Age | 0.099 | 0.171 | 0.01 | 0.188 | 0.162 | 0.03 | 0.12 | 0.057 | 0.01 | 0.13 |
| W/H | 0.915 | < 0.001 | 0.84 | 0.919 | < 0.001 | 0.84 | 0.917 | < 0.001 | 0.84 | 0.87 |
Abbreviations: AC, arm circumference; BMI, body mass index; WC, waist circumference; W/H, weight/height.
5. Discussion
Although spinal anesthesia is usually straightforward, it can be technically challenging with patients who are of unusually large or small body habitus. In addition, less experienced practitioners have more difficulty performing it. A formula that can predict the depth of needle insertion in overly large or small patients would increase accuracy in the performance of spinal block, especially for clinicians with less experience; it would also enhance patients’ comfort and satisfaction, as well as expediting their procedure time. In a study by Craig et al. (5) on patients aged 0.01 - 16 years, conducted to predict the lumber puncture (LP) depth of needle insertion, the relationship between depth of needle insertion and the height, weight, and age of the patients was analyzed. A linear relationship was found between the child’s height and the depth of needle insertion; as a result, the mean depth of insertion could be determined by 0.03 × height (cm). In the present study, conducted on patients aged 18 - 65 years, the depth of needle insertion had an inverse relationship with height, which was not strongly significant. In Craig et al. the regression constant was ignored, which meant that other influential factors in the study were not considered. In addition, the age groups in the two studies are not compatible. The present study was conducted on patients that had completed their development in terms of height, while the study group investigated by Craig et al. consisted of children in their formative years. Growth at this age depends on several factors such as nutrition, as well as hugely diverse natural characteristics, which can adversely affect the results and their generalization. In another study by Chong et al. (6) on 279 Chinese patients aged six months to 15 years, multiple regression tests showed a strong relationship between the lumbar puncture depth of needle insertion and the weight/height ratio. By using a predictive regression model, the ideal depth of needle insertion (cm) was determined as 10 [weight (kg)/height (cm)] + 0.93, with a regression coefficient of r = 0.77. In the present study, the depth of needle insertion’s relationship with the weight/height ratio was defined by the equation 0.69 + (10.1 × weight/height). The difference in the coefficient of the weight/height ratio between these two studies could be due to ethnic differences, as well as the different age groups, which affects the anthropometric characteristics of patients. Chong et al’s study was conducted on Chinese patients, who are known to be of generally smaller stature. In addition, the study group included children who were still in their formative years and not yet fully developed, compared to adults whose height stays almost constant after puberty. In a study by Arzola et al. (7), the relationship between patients’ anthropometric parameters and the skin to lumbar dural sac distance was investigated; it was shown that this distance had a significant correlation with patients’ weight and BMI, which is in agreement with the results of the present study. In Arzola et al’s study, a formula was not provided for predicting depth of needle insertion, but in the current study, the relationship between depth of needle insertion and BMI was expressed as depth of needle insertion = 0.56 + (0.18 × BMI), providing a means of prediction of the needle length. According to the regression model, in our study, the relationship between weight and BMI with the depth of needle insertion is stronger than that presented in Arzola et al’s study. This may be due to the group they were investigating , which consisted of pregnant women who were delivering under epidural block (7). During pregnancy, the mother’s weight and her lumbar lordosis undergo major changes, which could affect the accuracy of study results and generalization to other patients (8, 9). In addition, weight gain in pregnancy is not constant or equal in all women, as it differs by 7 - 14 kg (9). In a cohort study by Abe et al. (10) on 175 patients aged 25 days to 80 years, in patients undergoing CT scan for a variety of reasons, the LP depth in CT was measured and a formula for calculating LP needle depth was presented in the form of LP depth = 1 + (17 × W/H). This study showed that the Abe formula was a more reliable predictor for estimating the required LP needle depth, in comparison with other published formulas (R2 = 0.81) (10). Abe et al’s study was in almost constant agreement with our paper in terms of the significant correlation between the LP needle depth and weight/height ratio. However, in the above mentioned study, the age range was very diverse, and due to the difference in speed of height and weight development in various age groups, the weight/height ratio may also have been affected. It seems that separate determination of this ratio for each age group could achieve a result closer to reality. Additionally, as stated by the authors, the weight/height ratio was derived from the patients’ records, and may not necessarily have been reliable. In the present study, other anthropometric characteristics of patients were also measured (WC, biceps), and their correlation with the depth of needle insertion was analyzed and found to be not significant.


