1. Background
Arterial blood gas (ABG) analysis is used to assess oxygenation, ventilation, and acid-base status (1-3). ABG measurement is the most frequently ordered test in intensive care units. Therefore, taking an appropriate approach to this clinical test is important for the optimal care of the patients (4). The history of using and expanding arterial blood gases analysis is attributed to Severinghaus and Astrup (5, 6). Arterial blood gas analysis is a standard method for the assessment of oxygenation, ventilation, and the status of acids and bases in the body. The blood sample is usually taken through puncturing the arteries or through the implanted arterial catheter, which is accompanied by some complications such as hematoma, aneurysm formation, thrombosis, embolism, and the possibility of needle stick injury (7, 8).
When it is difficult or technically impossible, an alternative method is venous blood gas measurement. With both methods, we can obtain pH, oxygen pressure, carbon dioxide pressure, oxygen saturation, and the level of HCO3. Venous blood sampling is done easily while doing routine blood tests painlessly and without complications of arterial blood sampling. Various studies have been conducted regarding the relationship between arterial and venous blood values. Undoubtedly, determining the average of the difference in PCO2, HCO3, and pH of arterial and venous blood can be useful for managing the patients undergoing mechanical ventilation and for their weaning (9, 10).
A study in 2012 showed venous pH and HCO3 values had an excellent correlation with the values of arterial samples (11). On the other hand, a systematic review in 2014 showed that the peripheral venous and arterial PCO2 were not comparable (12).
We assume that the central venous blood has a close relationship with arterial blood. The purpose of this study was to examine this relationship in the patients who were candidates for open-heart surgery. In this study, data gathering did not impose any extra procedure because in patients under open-heart surgery, central venous and arterial catheter preparations are necessary for monitoring.
2. Methods
This study was conducted with the approval of the scientific and ethical review boards of Urmia University of Medical Sciences. 80 patients, who were admitted to the intensive care unit after cardiac surgery, were enrolled in our prospective analytic study. All patients were ASA (American society of anesthesiologists) physical status II - III according to the ASA’s classification system. Patients with ASA IV or more, with fever, with unstable hemodynamics, pneumothorax, hemothorax, respiratory, and heart failure were excluded from the study. In all patients, to check blood gases, samples were taken from arterial and central venous lines that were prepared in the operation room. Arterial samples were taken with 2 cc syringes, containing 0.1 cc heparin as an anticoagulant. First, air bubbles were removed and then were analyzed in 5 minutes. Simultaneously, central venous blood samples were taken and analyzed by using Nova biomedical model phox plus. All gathered data were statistically analyzed via chi-square and independent t-tests, or Fisher’s exact and Mann-Whitney U tests where needed by using SPSS version 20 software (Chicago, IL).
3. Results
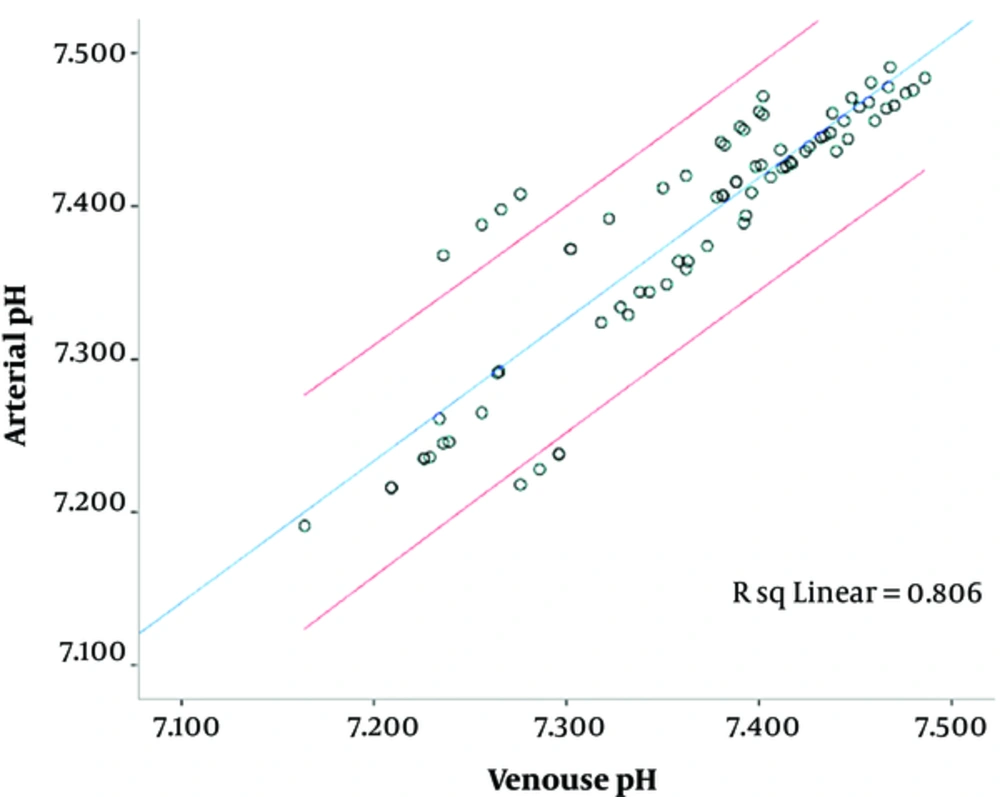
In this prospective analytic study, 80 ASA II - III patients, who were transferred to the cardiac ICU to receive mechanical ventilation, were enrolled. Their arterial and central venous blood samples were analyzed. The mean age was 62.18 ± 11.57 years; 56 (70%) patients were male and 24 (30%) were female. The mean arterial and central venous blood pH values were 7.38 ± 0.03 and 7.36 ± 0.08, respectively, that were significantly correlated with each other (P = 0.0001 and R = 0.898). The mean difference between central venous and arterial blood pH was 0.021 ± 0.037 and 95% CI (Confidence Interval) regarding the difference in pH was 0.013 to 0.029. This indicates that the arterial pH was about 0.013 to 0.029 unit higher than the central venous pH (Figure 1 and Table 1).
| Analysis | Arterial Blood | Venous Blood | Difference | CI 95% | R |
|---|---|---|---|---|---|
| pH | 7.38 ± 0..8 | 7.36 ± 0.08 | 0.021 ± 0.037 | 0.29 to 0.013 | 0.898 |
| PCO2, mmHg | 36.3 ± 8.7 | 39.8 ± 8.9 | -2.44 ± 2.6 | 1.84 to 3.03 | 0.940 |
| HCO3, mEq.L | 22.1 ± 2.8 | 22.1 ± 2.4 | -0.06 ± 1.5 | -0.4 to 0.2 | 0.840 |
| Sao2, % | 95.9 ± 4.7 | 89.4 ± 9.3 | 6.55 ± 7.76 | 4.8 to 8.2 | 0.567 |
aValues are expressed as mean ± SD.
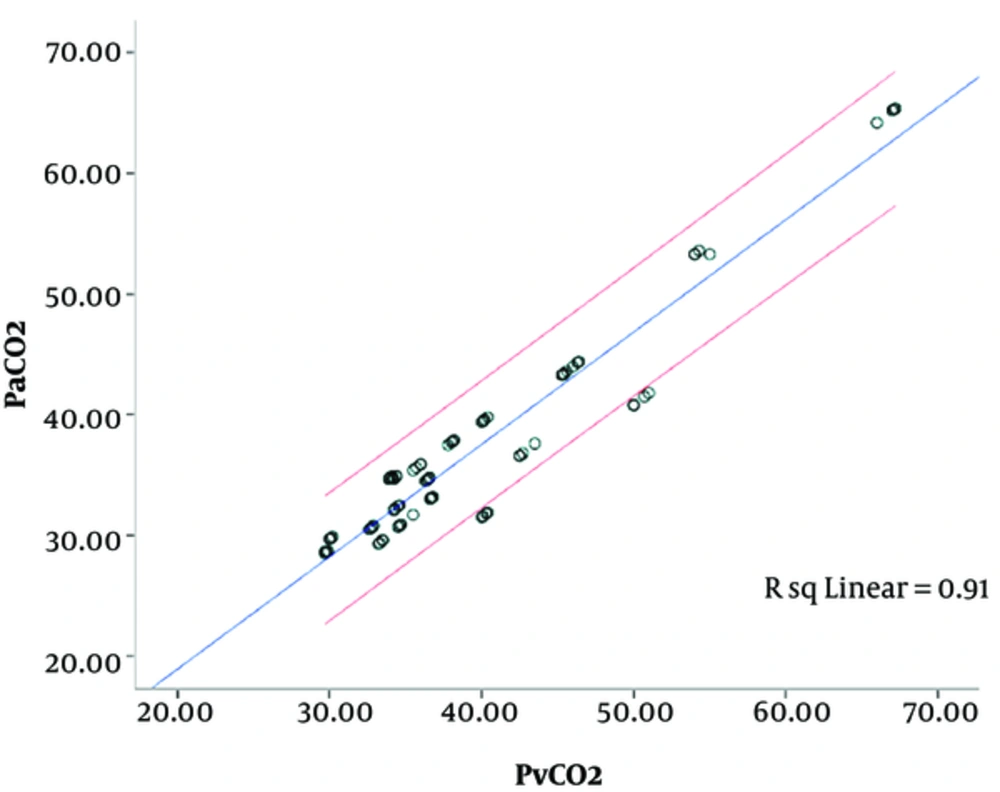
Mean arterial and central venous PCO2 were 36.3 ± 8.7 mmHg and 39.8 ± 8.9 mmHg, respectively, which were significantly correlated with each other (P = 0.0001, R = 0.954). The mean difference between arterial and central venous PCO2 was -2.44 ± 2.6 mmHg and 95% CI regarding PCO2 difference was 1.84 to 3.03 mmHg. Thus, arterial PCO2 was approximately 1.84 to 3.03 mmHg less than the central venous PCO2 (Figure 2 and Table 1).
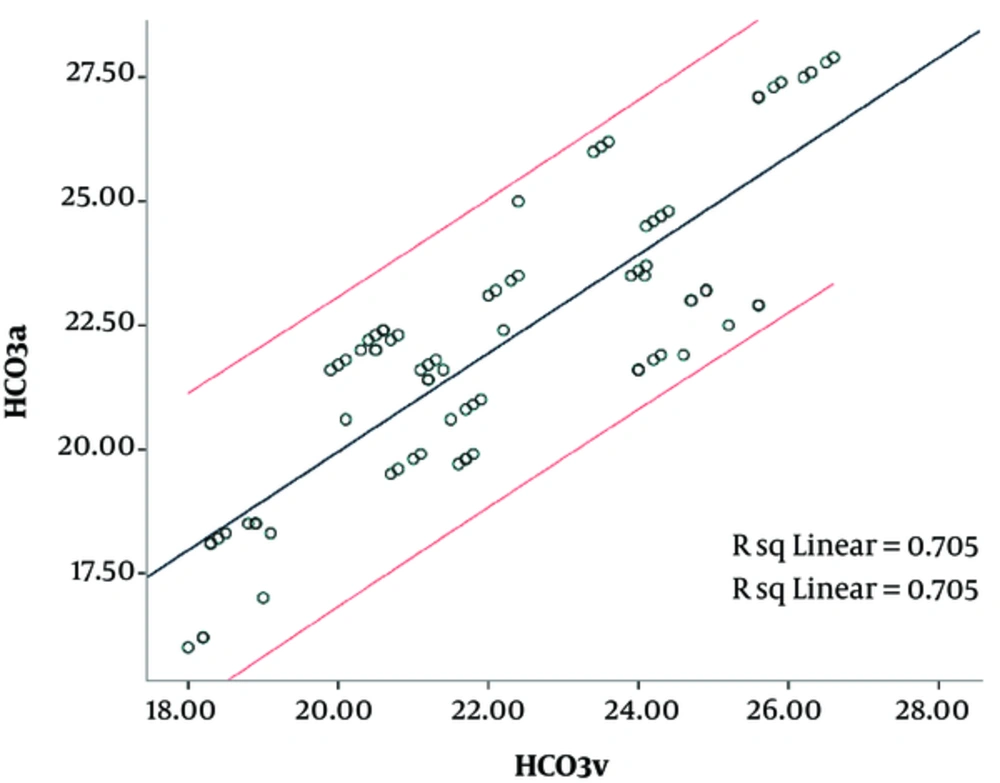
Mean arterial and venous HCO3 was 22.1 ± 2.8 and 22.1 ± 2.4 mEq per liter, respectively. Arterial and central venous HCO3 were significantly correlated with each other (P = 0.0001, R = 0.840). The mean difference between arterial and central venous HCO3 was -0.06 ± 1.5 mEq per liter and 95% CI was -0.4 to 0.2 mEq/L in this regard (Figure 3 and Table 1).
When FiO2 was approximately 50%, the mean arterial and central venous blood oxygen saturation (Scvo2) were 95.9 ± 4.7 and 89.4 ± 9.3, respectively. In this regard, the relationship between these amounts was very poor (R = 0.567) (Table 1).
4. Discussion
ABG analysis is a standard method for determining acid and basis status and adjusting mechanical ventilation based on oxygen pressure, arterial blood carbon dioxide, and pH. Arterial blood sampling as previously mentioned may be followed by some complications and even may lead to contaminated needles in the hands of staff and those who care patients during blood sampling (1, 7, 8). Patients who were candidates for open-heart surgery had a central venous line and an arterial line. Our goal was to study the relationship between pH, PO2, PCO2, and HCO3 between central venous and arterial blood in these patients. We hope if desired results are achieved, central venous blood sampling will be used instead of arterial blood sampling for arterial blood gas analysis. In this study, arterial and central venous blood samples were correlated regarding PCO2, pH, and HCO3 and 95% Confidence Intervals were very close and could be easily used in the results of ABG and central VBG.
In 1961, Gombino compared capillary blood and brachial arterial blood of patients who had referred for pulmonary tests and reported that there was no significant difference between them (13). Kim et al. in 2012 in Korea determined peripheral venous and arterial blood gas correlation in ICU patients and reported that peripheral venous pH, PCO2, and HCO3 may be used as alternatives to their arterial equivalents in many clinical contexts encountered in the ICU (14). Our study results do not correlate with their studies. The difference of our study is that the blood sample was taken from the central vein and, as their studies showed, they could be taken from the central VBG in cases where ABG is not available. Nevertheless, we had a weak correlation between the mean oxygen saturation of the arterial and central venous blood. The monitoring of the mixed venous oxygen saturation (SMVO2) has been used for delivery and consumption of oxygen in critically ill patients. Most critically ill patients have a central venous catheter and the central venous oxygen saturation (SCVO2) has been used as an alternative to the SMVO2. A few studies were conducted for hemodynamic monitoring with SCVO2, but their results in various situations were different (2, 15, 16). Based on these data, the surviving sepsis campaign has recommended achieving a SMVO2 level of 65% or a SCVO2 level of 70% in septic shock patients.
Various studies have been done to evaluate patients under different conditions. For example, Kelly et al. (17) studied the correlation between arterial and venous HCO3- in patients in emergency wards who had respiratory or metabolic disorders and announced that measuring venous blood bicarbonate could be a good alternative for estimating arterial HCO3. On the other hand, the correlation between arterial and venous blood gases was studied in patients with acute exacerbations of chronic obstructive pulmonary disease (COPD), patients poisoned by tricyclic antidepressants, patients with acute respiratory failure undergoing mechanical ventilation, trauma patients undergoing mechanical ventilation, and children. Based on the results, there is a correlation between arterial and venous blood gases, and VBG can be used to evaluate and estimate their values in ABG (18-21). None of the above studies, except Maliaoski et al. (22) study, used central venous blood and none of them was done after open-heart surgery.
In the present study, the correlation between arterial and central venous blood oxygen saturation was poor. In the study of Yildizdas et al. (19), a similar correlation in this regard was reported. The results of this study help us in different situations by adding or subtracting the amounts of central venous blood gases, and their values can be estimated in arterial blood. Nevertheless, it is not recommended for estimating Pvo2 or Sat O2 of venous blood. In conclusion, our results showed a significant correlation between PO2, pH, and PCO2 of arterial and central venous blood in patients undergoing open-heart surgery. Further study was done on these patients because both arterial and central venous lines are required for the process of anesthesia for cardiac surgery and no more procedures were imposed on patients. In addition, patients were not punctured for taking arterial and venous blood and thus, the results of this study can be used in similar cases. In this study, the correlation between Sat O2 of arterial and central venous blood (SCVO2) was poor. Perhaps it could be better to use some devices such as pulse oximetry for the evaluation of these indices and regarding other blood gases, the analysis of venous blood gases can be applied. In conclusion, it seems that other similar studies can be done in patients who have hemodynamic instability or long-term hypotension or even in patients undergoing cardiopulmonary resuscitation in order to examine the correlation rate in this regard.


