1. Background
Anesthesia induction and maintenance with propofol can be guided by target-controlled infusion (TCI) systems that incorporate a pharmacokinetic (Pk) model into a computer-controlled pump, allowing for intravenous anesthetics titration and targeting plasma and effect-site drug concentrations (1, 2). However, propofol pharmacokinetics can be influenced by changes in physiological variables, such as cardiac output (CO), as propofol is a high-clearance drug. In addition, an increase in the propofol plasma concentration could also result in hemodynamic (HD) changes (3-7). These HD variations can modify the TCI modeling ability to predict propofol concentrations (8) such that up to a 60% precision error can occur as the greatest bias after induction in the early maintenance phase (9).
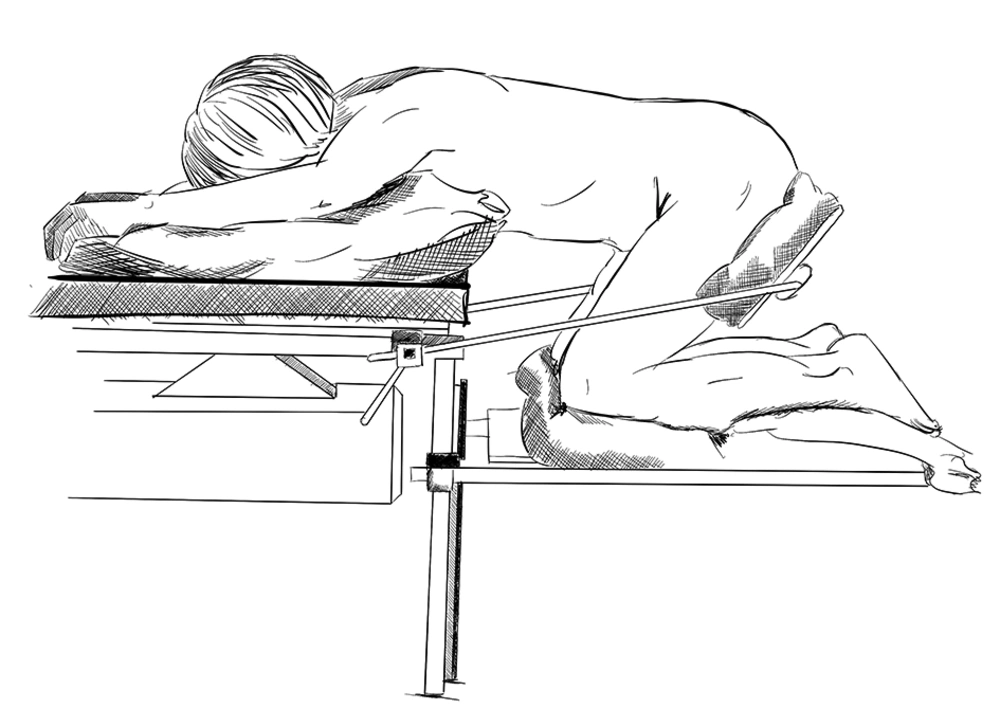
Patients’ positioning in the knee-chest (KC) position (Figure 1) following anesthesia induction further reduces venous return and CO (10, 11). Physiological changes and complications associated with surgical positions, such as the prone and KC positions, have been studied extensively (12, 13).
Researchers previously observed that patients in the prone position required less propofol than those in the supine position. In the present study, it was hypothesized that predicted propofol effect-site (Ce) and predicted plasma concentrations (Cp) would not be accurate when these HD changes occur, especially after KC positioning (4, 5, 14). It was also hypothesized that applying two different TCI anesthesia protocol reductions in propofol infusion, one performed after induction and the other one before positioning, would reduce the prediction error and attenuate the CO changes.
2. Objectives
The aim of this study was to quantify the variations in propofol plasma concentrations (Cm), both after induction and after KC positioning, and correlate them with Cp by the Schnider Pk model. CO was continuously measured with a minimally invasive CO monitor, LiDCO rapid® (15-17) (LiDCO Ltd., Cambridge, UK).
3. Methods
After obtaining the REB approval and written informed consent, we recruited consecutive neurosurgical patients scheduled for lumbar spinal surgery in the KC position. A two-phase prospective observational study was conducted. In the first set of patients (phase I), propofol plasma concentrations were measured and compared with concentrations predicted by the Schnider Pk model and the changes in CO following induction and KC positioning were quantified. In the second set of patients (phase II), based on the data from the first set of patients, two propofol target concentration reductions were planned immediately after anesthesia induction and before positioning.
Propofol plasma concentrations were also measured and compared with predicted and the changes in CO following induction and KC positioning were also quantified, as done in phase I. The exclusion criteria included patients with severe ischemic heart disease, congestive heart failure, atrial fibrillation or flutter, body mass index (BMI) > 35 kg.m-2, dementia, history of drug abuse or addiction, and preoperative midazolam. A careful physical examination was performed on each patient to exclude potentially difficult airway and ischemic peripheral arterial disease.
3.1. Anesthesia Protocol
A crystalloid intravenous infusion at 400 mL.h-1 was initiated once patients arrived in the operating room, which continued until the end of anesthesia induction and maintained at 200 mL.h-1 throughout the surgery. Patients received American Society of Anesthesiologists (ASA) standard monitoring, including depth of anesthesia monitoring with bispectral indexTM (BISTM brain monitoring, Medtronic, USA) and neuromuscular block monitoring with the train of four stimulations on the right hand. Before induction, a left radial artery catheter was placed with local anesthesia to measure invasive blood pressure and LiDCO rapid® was connected to collect CO and other hemodynamic parameters every second. This device used the same algorithm as the LIDCO plus® system, but it required neither lithium dilution nor calibration, as it used nomograms based on patients biometric parameters to estimate cardiac output and stroke volume. In a separate computer, RugLoopII© software (DEMED website, Temse, Belgium) was used to drive remifentanil and propofol pumps (AlarisTM Asena, BD, UK) and to collect data every five seconds while connected to the patient monitor (Aisys®, GE Healthcare, USA). At this moment, the first blood sample, called “Baseline”, which was free of drugs, was collected and all pharmacological and HD parameters were recorded. Anesthesia induction commenced with remifentanil (20 μg.mL-1) by the TCI mode to achieve a predicted effect-site target concentration (Ce) of 2.5 ng.mL-1 (Minto pharmacokinetic model). Propofol (1%) was then started at 200 mL.h-1 in the TCI view until the loss of consciousness (LOC). The LOC was considered when the patient failed to open the eyes following name-calling and tapping on the forehead. At the moment of LOC, propofol predicted effect-site concentration (Ce) was noted from RugLoopII© software. The propofol protocol in patients from P1 and P2 was different, as explained in detail in the following.
3.2. Experimental Protocol
3.2.1. Phase I (P1)
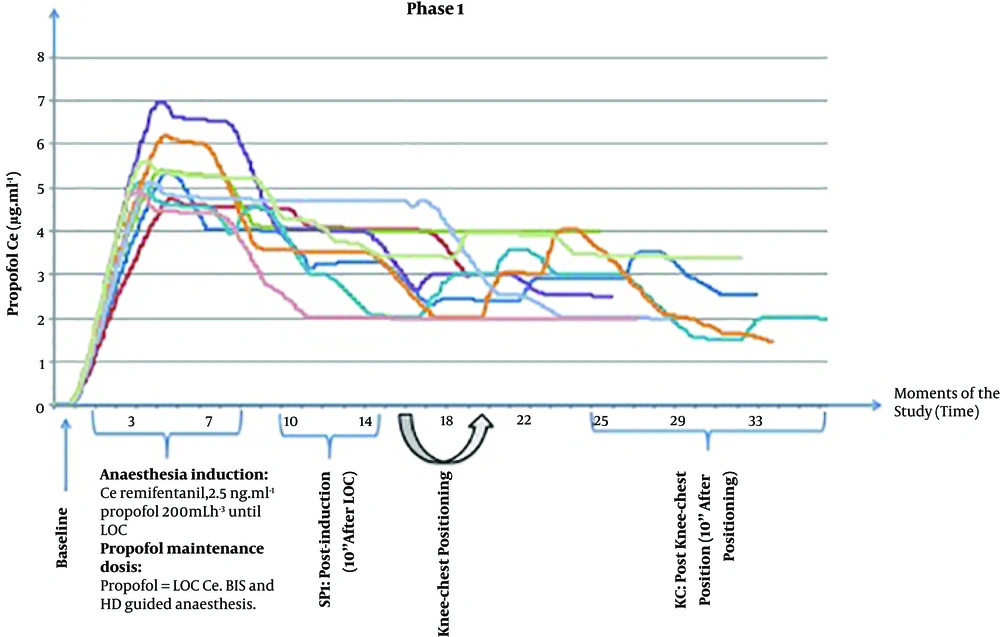
After LOC, the propofol concentration was switched from the TCI view to the TCI mode with Schnider Pk model at a target concentration equal to the Ce at LOC. Tracheal intubation was accomplished following neuromuscular blocking drug administration (rocuronium 0.6 mg.kg-1) and patients’ lungs were mechanically ventilated with O2 and air mixture to achieve SpO2 of > 98%, tidal volume of 8 mL.kg-1, and the respiratory rate adjusted to normocapnia. Remifentanil Ce was reduced to 1 ng.mL-1 until surgical incision. Anesthesia maintenance was guided by BISTM (40-60) and HD parameters by the anesthesiologist. The second blood sample was collected 10 min after LOC and then patients were positioned in the KC position carefully and using a ProneView® platform for the head. The third blood sample was collected and parameters were registered 10 minutes after performing the KC position before incision (Figure 2). At this point, phase I of the study was completed.
3.2.2. Phase II (P2)
After LOC, the propofol concentration was switched from the TCI view to the TCI mode at a Ce target lower than Ce at LOC, calculated using a formula described in detail in supplementary file Appendix 1, which relates the Ce of LOC with the Ce that results in maintaining BIS between 40 and 60.
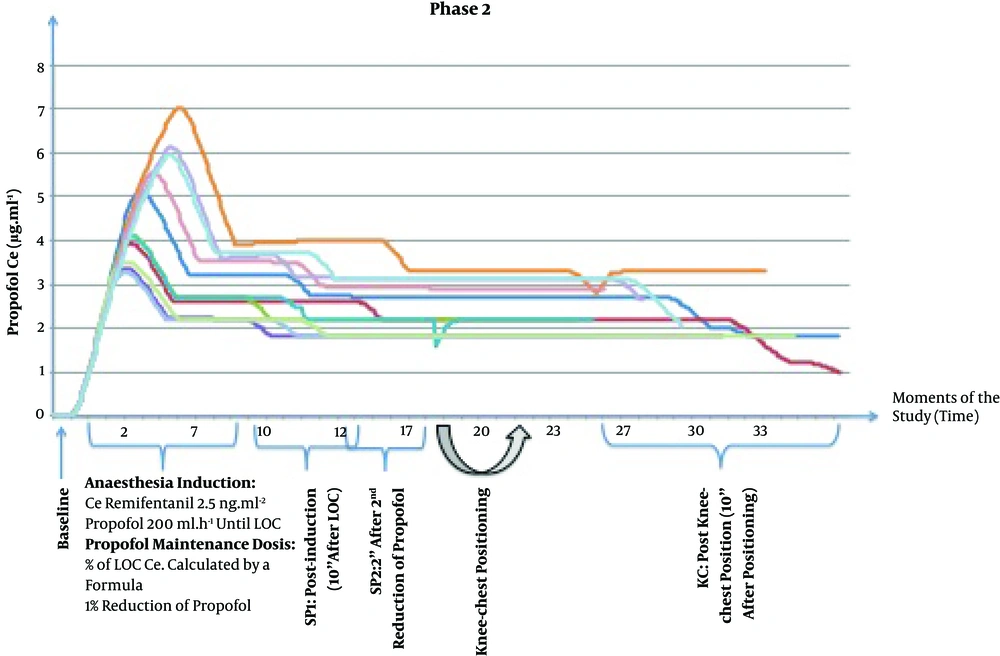
Tracheal intubation and ventilation settings were similar to phase I. Remifentanil Ce was changed to 1 ng.mL-1 until surgical incision. The second blood sample was collected 10 minutes after LOC. A second reduction of propofol Ce was performed with the same magnitude as the CO variation observed in phase I patients and 2 minutes later, the third blood sample was collected. Afterward, patients were placed in the KC position as described in phase I. Ten minutes after KC positioning and before incision, the fourth blood sample was collected (Figure 3). At this point, phase II of the study was completed.
3.3. Plasma Propofol Sampling
During the study period, 3 mL arterial blood samples were collected from the left radial artery into heparin containing tubes for propofol and propofol metabolites quantification in the plasma according to the protocol. The propofol plasma concentration and its free metabolites were determined by gas chromatography mass-spectrometry with some adjustments (18, 19).
The accuracy and bias of model predictions were calculated from differences between propofol Cm and Cp for each individual patient expressed as the prediction error (PE) (3), median prediction error (MDPE), and median absolute performance error (MDAPE). An acceptable performance was characterized by MDPE of less than 20% (-20 to 20%) and MDAPE of 20% - 40%. A model is most accurate when the values of MDPE and MDAPE are close to zero. In TCI, the typical accepted values are 10% to 20% for bias and around 30% for accuracy (20).
3.4. Data Analysis
Data were collected using LiDCO rapid® and RugLoopII© software that gathered data independently and with different sampling frequencies; therefore, synchronization between data was mandatory for this study. Dedicated software was developed in Matlab® for the interface. For data analysis, one-minute duration windows were considered around each of the above-defined study moments and the average of the observed values was computed for each window. The statistical analysis was considered as a full factorial model in a two-way mixed ANOVA analysis used to compare the mean differences of the measured variables, considering the main effect “Moment” (within-subjects: same individual at different moments), the main effect “Phase” (between-subjects: different individuals, a group compared to another) and their interactions “Moment × Phase”. A P value of < 0.05 was considered statistically significant. Further post hoc testing (ANOVA and t-test with Bonferroni correction) was conducted to compare “Moments” and “Phases”. The results were expressed as mean ± standard deviation (SD). All statistical analyses were conducted in SPSS® software V. 25 (IBM, New York, USA).
4. Results
Twenty patients (9 in phase I and 11 in phase II) were included in this study. Patients’ demographic data are presented in Table 1.
| Characteristics | Phase I | Phase II |
|---|---|---|
| Age, y | 49.3 ± 8.7 | 59.7 ± 13.5 |
| Sex (f/m) | 6/3 | 6/5 |
| Height, cm | 161.6 ± 9.0 | 167.8 ± 12.4 |
| Weight, kg | 70.9 ± 13.9 | 77.3 ± 11.6 |
| Body Mass Index, kg.m-2 | 27.0 ± 3.5 | 27.4 ± 3.0 |
| ASA classification I/II | 3/6 | 2/9 |
| Cardiac output (baseline), L.min-1 | 7.4 ± 1.8 | 7.2 ± 2.3 |
| Propofol Ce at LOC, μg.mL-1 | 5.03 ± 0.75 | 4.34 ± 1.52 |
| Time to LOC, min | 3.76 ± 0.80 | 3.05 ± 1.22 |
Abbreviations: ASA, American Society of Anesthesiologists; LOC, loss of consciousness; Propofol Ce, propofol effect-site concentration.
aValues are expressed as No. or mean ± SD.
Data concerning the drugs used, HD parameters, and BIS values are reported in Table 2. In phase I, there were no protocolled propofol target reductions; thus, propofol Ce target concentrations were manually modified by the anesthesiologist, guided by BIS and HD parameters (Figure 2). Propofol Ce and Cp were statistically different between all moments (P < 0.001) but measured propofol did not show any differences (Table 2).
| Drugs Data and Variables (Units) | Phase I (N = 9) | Phase II (N = 11) | Two-Way ANOVA (P Value) | |||||||
|---|---|---|---|---|---|---|---|---|---|---|
| Baseline | SP1 | KC | Baseline | SP1 | SP2 | KC | Moment | Phase | Moment × Phase | |
| Propofol (μg.mL-1) | ||||||||||
| Ce | 5.03 ± 0.75 (LOC) | 3.84 ± 0.63c | 2.53 ± 0.79e | 4.34 ± 1.52 (LOC) | 2.92 ± 0.64c | 2.47 ± 0.57 | 2.20 ± 0.51e | < 0.001* | 0.054 | 0.352 |
| Cp | - | 3.83 ± 0.74 | 2.48 ± 0.86e | - | 2.97 ± 0.68 | 2.46 ± 0.58 | 2.24 ± 0.58e | < 0.001* | 0.06 | 0.083 |
| Cm | - | 3.61 ± 1.14 | 3.31 ± 2.11 | - | 2.96 ± 0.81 | 2.68 ± 0.72 | 3.90 ± 1.90f | 0.455 | 0.961 | 0.162 |
| Remifentanil (ng.mL-1) | ||||||||||
| Ce | - | 2.36 ± 0.42 | 1.11 ± 0.35e | - | 1.85 ± 0.66 | 1.12 ± 0.20 | 1.15 ± 0.48e | < 0.001* | 0.132 | 0.107 |
| Propofol Inf. volume (mL) | 12.46 ± 2.44 (LOC) | 22.53 ± 4.09c | 37.09 ± 8.07d,e | 9.63 ± 4.09 (LOC) | 15.86 ± 6.10c | 19.36 ± 6.71 | 27.15 ± 8.63d, e, f | < 0.001* | 0.014* | 0.034* |
| BIS | 94.0 ± 2.2 | 61.8 ± 15.2c | 42.3 ± 15.1e | 95.3 ± 2.6 | 49.9 ± 9.8c | 46.5 ± 7.5 | 37.7 ± 8.7d, e | < 0.001* | 0.056 | 0.165 |
| Cardiac output (L.min-1) | 7.4 ± 1.8 | 5.4 ± 1.3c | 4.4 ± 1.2d | 7.2 ± 2.3 | 5.6 ± 1.6c | 5.6 ± 1.7 | 3.9 ± 1.9d, e | < 0.001* | 0.867 | 0.514 |
Abbreviations: Ce, effect-site concentration; Cm, measured plasmatic concentration; Cp, predicted plasmatic concentration; Inf., Infused; LOC, loss of consciousness; KC, knee-chest; SP1, supine; SP2, supine after the second reduction in propofol infusion.
aValues are expressed as mean ± SD.
bThe superscripts c, d, e, and f indicate significant differences (5% level) on repeated measures ANOVA post hoc pairwise testing with Bonferroni correction (*).
cSignificant differences between Baseline and SP1.
dSignificant differences between Baseline and KC;
eSignificant differences between SP1 and KC;
fSignificant differences between SP2 and KC.
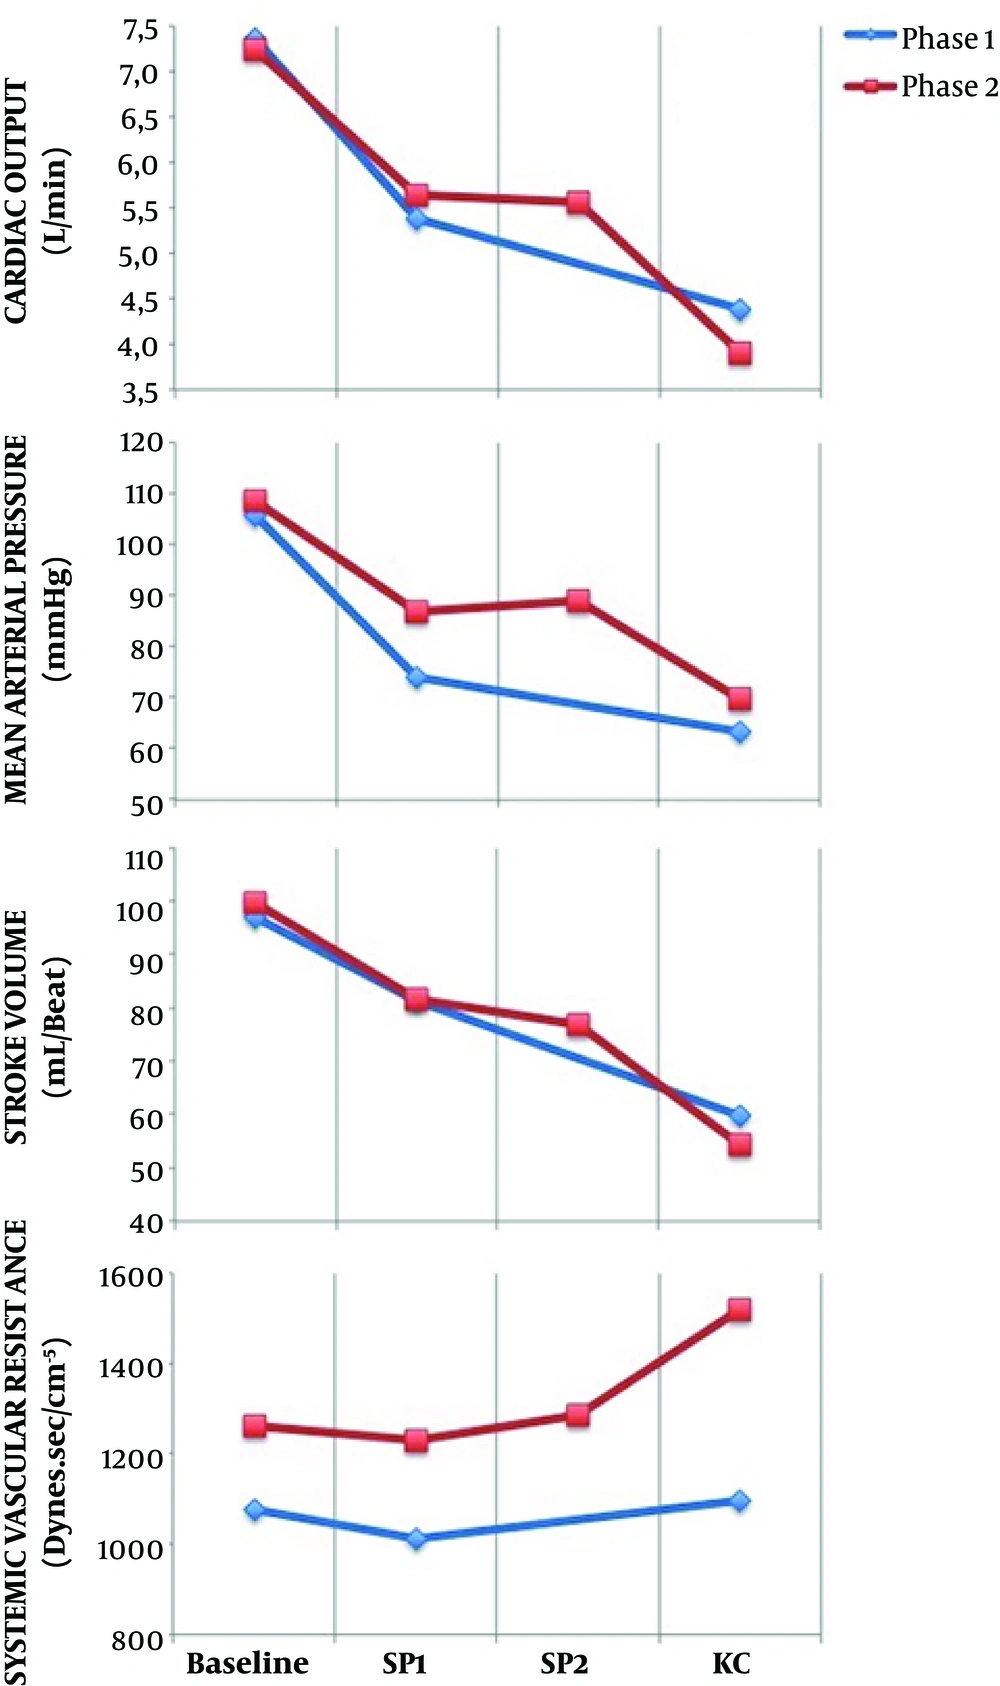
There were significant HD changes after anesthesia induction and after KC positioning with respect to the baseline in both phases (Figure 4). In phase I, CO fell by 25.6% after induction and 38.4% after KC position, compared to the baseline.
In phase II, after induction, propofol target Ce was set at a value below the Ce at LOC, based on the formula presented earlier in methods. The average decrease in propofol Ce following LOC was 27.5%, with a maximum of 43% (prop Ce LOC = 7.0 μg.mL-1) and a minimum of 19% (prop Ce LOC = 2.7 μg.mL-1). The second reduction in propofol was performed in all patients that was equal to the CO reduction measured in patients from the phase I following KC positioning (17.2%) (Figure 3). Propofol Ce and Cp were statistically different between all moments, except between SP2 and KC moment (Table 2). Measured propofol showed a statistical difference between SP2 and KC moment (P = 0.013).
In phase II, despite propofol Ce reductions, CO reduced significantly from baseline 46.9%, after induction 19.8% and after KC position 31% (Figure 4). From moment SP1 to moment SP2, HD parameters did not vary.
In both phases, there was no statistical association between CO changes and age, weight, gender, baseline CO, and propofol Ce at LOC (P > 0.05). A correlation was found between baseline CO and propofol requirements for LOC (propofol infused volume until LOC), with statistical significance in phase II (r = 0.76; P = 0.006). Between phases, there were significant differences in propofol Ce (P = 0.005) and propofol Cp (P = 0.015) at the SP1 moment. Propofol infused volume was statistically different between all moments and between phases, except for LOC.
A total of 71 arterial blood samples were obtained, propofol concentrations were measured, and the predicted error was calculated for each patient, as shown in Table 3.
| Moments | Propofol Pk Model Performance (%) | |
|---|---|---|
| MDPE | MDAPE | |
| Phase I | ||
| SP1 | -6% (-49 to 20) | 15% (1 to 49) |
| KC | 28% (-35 to 114) | 35% (6 to 114) |
| Phase II | ||
| SP1 | 13% (-43 to 45) | 20% (4 to 45) |
| SP2 | 18% (-45 to 56) | 32% (0 to 56) |
| KC | 48% (-44 to 270) | 48% (6 to 270) |
Abbreviations: KC, knee-chest; SP1, supine; SP2, supine after the second reduction in propofol infusion.
At the SP1 moment, there were no differences between Cp and Cm (P = 0.559) and there was a statistical correlation between them (r = 0.640; P = 0.002). At the KC moment, there was an underestimation of propofol plasma concentrations from the Pk model in both phases (34% in phase I and 74% in phase II) (Figure 5). Cp and Cm were statistically different (P = 0.005) and there was no statistical correlation between them (r = 0.374; P = 0.104). In both phases, BIS values did not differ between phases (P = 0.165) (Table 2). There were no cases of patient awareness. Linear regression analysis revealed no statistically significant relationship between BIS values and propofol Cm or BIS values and cardiac output at any moment.
5. Discussion
In the present study, a propofol TCI system with Schnider Pk model was used to drive a propofol pump that showed a marked underestimation of plasma propofol levels in patients placed in the KC position. The study also showed that the KC position was associated with significant hemodynamic changes, as a reduction in CO from baseline was observed (Figure 4). After induction, the Schnider Pk model showed a good performance in Cp prediction (Table 3). Also, there was a statistical correlation between Cp and Cm. In the KC position, when the greatest CO reduction occurred, Schnider Pk model performance was not accurate, as propofol Cp was not correlated with Cm and it was markedly underestimated by 34% in phase I and 74% in phase II. Also, in the KC position, the MDPE and MDAPE values calculated at this moment did not show a good performance.
In phase II, between moment SP2 and moment KC, when propofol Cp and propofol Ce concentrations were unchanged and the only intervention performed on patients was KC positioning, it was observed an increase in the measured propofol concentrations (P = 0.013) and a decrease in BIS values (P = 0.004) (Figure 5).
The influence of CO on the pharmacokinetic models to predict propofol plasma concentrations during TCI had already been discussed by some authors (6). It can be speculated that the difference between the predicted and measured propofol concentrations in patients with lower CO is most likely related to a decrease in total propofol clearance, but further data are still needed to correlate CO or liver blood flow and plasma clearance of propofol. Upton et al. (14) reported an inverse relationship between CO and propofol concentrations after a short propofol infusion in an ovine model. Myburgh et al. (8) observed the same relationship during longer propofol infusions in a high-CO state induced by catecholamine infusion in the ovine. Kurita et al. (5) confirmed, in a swine model, that Cp was inversely correlated with changes in CO during constant infusion. We also plotted the relationship between measured Cp and the inverse of CO, but we did not observe any statistical association. It must be highlighted that most of the published studies were performed in animal models, with no studies in humans. Recently, Keyl et al. (4) found that Schnider Pk model markedly underestimated Cp in patients with impaired left ventricular function.
In phase II of our study, we found a statistical correlation between propofol infused volume until LOC and baseline CO, showing that CO is a determinant to infer the initial concentrations of propofol for anesthesia induction (14).
In the present study, we expected a correlation between propofol infused volume and CO fall. Comparing both phases, propofol consumption (propofol infused volume) was much lower in phase II than in phase I (P = 0.034) (Table 2). Also, patients in both phases did not show differences in BIS values and other parameters; thus we can conclude that patients in the KC position need lower propofol concentrations. Nevertheless, propofol targeted reductions did not attenuate the CO fall when placing patients in the KC position, as the authors previously hypothesized. The results suggest that planned decrements in propofol target Ce did not correspond to a decrease in Cm (Figure 5), as in phase II, after two reductions, the underestimation increased at the KC moment.
Furthermore, hemodynamic changes should be avoided in high-risk patients, even for short periods, as they are associated with poor outcomes (21-23). The present study also showed an important finding that even in ASA 1 and 2 patients, significant HD changes may occur after the KC position.
5.1. Limitations
The present study has several limitations. ANOVA was quite comprehensive, with three measures compared in each individual and between the two groups. However, regarding propofol concentrations, the sample size may be considered small. The definition of the moments of data analysis was a challenge. We defined a 10-minute period stabilization following induction and KC positioning according to the literature (10, 24). The fact that this was a non-randomized study may be considered a limitation. However, we needed data from the first phase to determine the intervention in the second phase.
5.2. Conclusions
Our study showed that the measured propofol concentrations, after hemodynamic changes associated with the KC position, were much higher than the values predicted by Schnider Pk model. Planned propofol reductions did not attenuate the underestimation error from the Pk model. When placing patients in the KC position, BIS values decreased and the measured propofol concentrations increased. Our results suggest that the CO variation was responsible for the pharmacokinetic phenomenon described above. In high-risk patients placed in the KC position, anesthesiologists must be aware of these pharmacokinetic changes and, in addition to standard monitoring, the use of depth of anesthesia and cardiac output monitors may be considered. Further work is planned in an educational area with a simulation program to prepare surgical teams to a structured and careful approach for these patients.


