1. Background
Spinal anesthesia is used as a common anesthetic technique in many routine and outpatient surgeries. Today, given that spinal anesthesia reduces maternal mortality with no general complications on the mother and newborns, it has become the most common anesthetic technique in cesarean surgery. Studies have shown that maternal mortality in the cesarean section under spinal anesthesia is 16 times less than general anesthesia (1, 2). Spinal anesthesia causes denervation of the sympathetic, sensory, and motor nervous system. Also, injection of spinal anesthesia solution into the subarachnoid space can interrupt the conduction in small and non-myelinated strands (sympathetic) prior to dissection of the myelinated and large fibers (sensory and motor) (3).
However, hypotension is more likely due to the sympathetic block and also the effects of uterine compression on the aorta and vena cava. Prevention of hypotension is important to maintain maternal and fetal health. Without preventive measures, such as fluid therapy, left uterine displacement and Trendelenburg position, hypotension following spinal anesthesia has reported in 80 to 95% of the patients (4, 5), which may cause nausea, vomiting, dizziness, decreased level of consciousness, uterine perfusion, oxygenation of fetus, the increased in risk of aspiration in the mother, and fetal acidosis. In most cases, despite preservative measures, a vasopressor, such as phenylephrine or ephedrine is necessary (6, 7). Recent studies have shown that by administering phenylephrine, a pure alpha-adrenergic agonist, the mother’s blood pressure is controlled better, nausea, and vomiting are less occurred, and the risk of fetal acidosis will be lower (8-10).
2. Objectives
Given the high prevalence of hypotension in spinal anesthesia during cesarean delivery on the one hand, and the anesthesiologists’ disagreement on the type of prescribed drug on the other, this clinical trial was designed and conducted to investigate the effect of infusion of prophylactic phenylephrine on blood pressure, heart rate, arterial pressure, SPO2, nausea and pregnant mothers’ vomiting during cesarean section under spinal anesthesia. Also, we aimed at determining the effect of phenylephrine on the PH of the umbilical cord, PCO2, HCO3, base excess, and Apgar score of 1 and 5.
3. Methods
3.1. Study Design and Participants
This double-blind randomized controlled trial (RCT) was conducted on 116 pregnant women candidate for elective cesarean section under spinal anesthesia in the Shahid Akbarabadi Hospital, Tehran in 2019. Inclusion criteria included pregnant women aged 18 - 45 years, being a candidate for cesarean section under spinal anesthesia, ASA 1 and 2 patients, and elective cesarean section. Also, exclusion criteria included a history of allergy to phenylephrine, body mass index (BMI) > 30 kg/m2, hypertension (> 140/90 mmHg), contraindication for spinal anesthesia, severe cardiovascular disease, prematurity, emergency cesarean section, and inadequate analgesia after spinal anesthesia.
3.2. Data Collection
In the present study, data were collected using a checklist, including the demographic and clinical characteristics, such as age, height, weight, BMI, gravid, gestational age, Apgar score of 1 and 5, systolic blood pressure, diastolic blood pressure, heart rate, arterial pressure, SPO2, PH of the umbilical cord, PCO2, HCO3, base excess, and nausea and vomiting, based on the collected and recorded interviews with patients and clinical examinations.
3.3. Intervention
Prior to the study, the research objectives were explained to the pregnant subjects and the informed consent was obtained. Then, the eligible women were divided into the intervention and control groups (n = 58 per group) using a random number table. In this double-blind study, the patients and researchers were blind to group allocation. The syringe and injection volume were similar in the placebo.
To perform the intervention, patients were lying in the supine position with little uterine displacement to the left on the bed in the operating room. Then, they were monitored by standard pulse oximetry, non-invasive blood pressure, and electrocardiogram and their blood pressure, heart rate, and SPO2 were measured and recorded. Intravenous administration through a peripheral venous catheter (18G) was considered and 500 mL of the Ringer serum received. Then, the intervention group was administered with 35 µg/min of phenylephrine, whereas the control group was injected with 0.9% normal saline serum. In both groups, spinal anesthesia was performed with 12 mg of Bupivacaine 0.5% in sitting position using the spinal needle (G25) at the L3-L4 or L5-L4 intervertebral space. After anesthesia, to prevent uterine pressure on the aorta and vena cava, the patient was placed in the supine position with a little displacement of the uterus to the left. Blood pressure was measured and recorded every two minutes until the baby was born. Then, blood pressure, heart rate, arterial pressure, and SPO2 were monitored continuously and recorded every two minutes. In the present study, the patients’ nausea and vomiting were divided into 4 degrees: 0 = no, 1 = slight nausea, 2 = nausea requiring treatment, 3 = vomiting. For patients with grade 2 or higher nausea, 10 mg of the metoclopramide was prescribed.
In both groups, for cases with hypotension of greater than 20% from the baseline or blood pressure of less than 90 mmHg, 100 µg of the phenylephrine was injected and this dose was repeated, if needed. Also, atropine 0.01 mg/kg was prescribed for cases that their heart rate fell below 50 beats per minute. In the intervention group, when the blood pressure was increased by more than 20% from baseline, phenylephrine was discontinued, otherwise, it continued until birth. Also, the PH of the umbilical cord and the 1-minute and 5-minute Apgar scores were recorded after birth.
3.4. Statistical Analysis
In the descriptive analysis, mean (SD) and number (%) were used for quantitative and qualitative variables, respectively. In the analytical analysis, the independent-samples t-test (existence of normal distribution), Mann-Whitney U test (lack of normal distribution) and chi-square test were employed to compare the quantitative and qualitative variables in two groups. Finally, the repeated measures ANOVA test was used to compare the means of quantitative variables at different time points in the intervention and control groups. Data were analyzed using SPSS software (version 24.0) and P value < 0.05 was considered as significant.
3.5. Ethical Considerations
The research protocol was in accordance with the principles expressed in the Declaration of Helsinki and approved by the Deputy of Research and Ethics Committee of Iran University of Medical Sciences (ID-number: 97-3-58-12859). Additionally, this clinical trial was registered at the Iranian Registry of Clinical Trials (registration ID: IR.IUMS.REC.1397.868).
4. Results
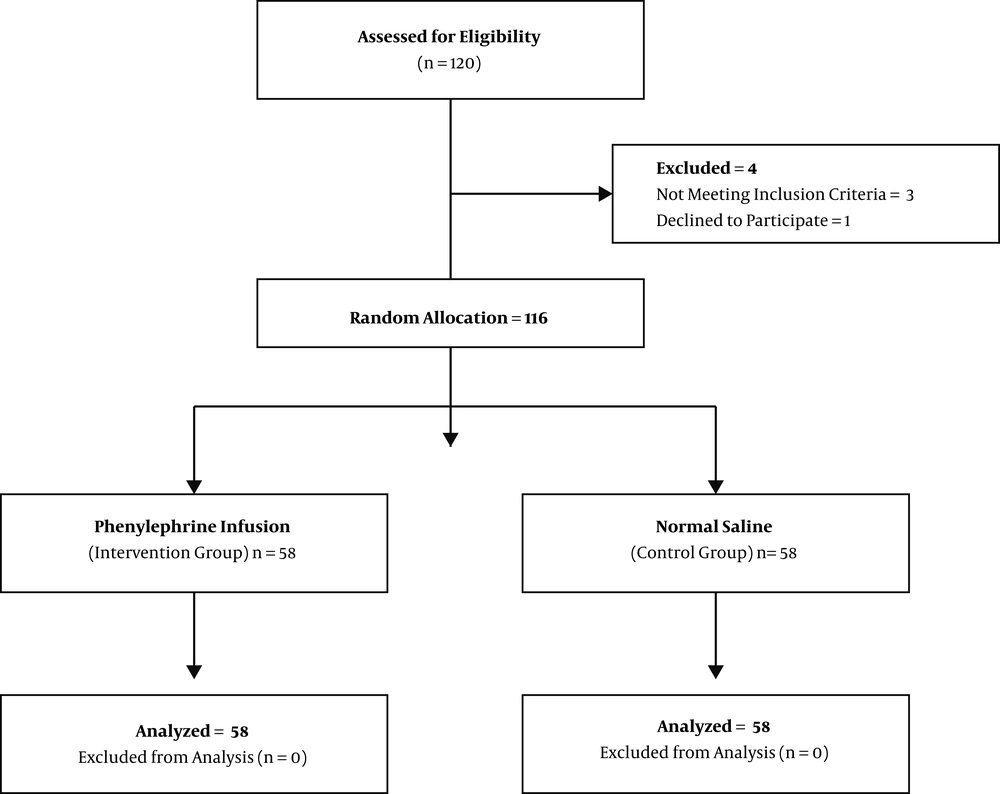
The eligible women were randomly divided into two groups of intervention (n = 58) and control (n = 58) (Figure 1). Table 1 presents the subjects’ characteristics in the intervention and control groups at the baseline. Generally, there was no significant statistical difference between both groups in terms of age, height, weight, BMI, gravid, and gestational age at the baseline (P value > 0.05; Table 1).
| Quantitative Variables | Values | P Value | |
|---|---|---|---|
| Intervention | Control | ||
| Age, yb | 33.65 ± 4.94 | 34.48 ± 5.73 | 0.247 |
| Height, cmc | 162.40 ± 5.40 | 159.26 ± 6.28 | 0.997 |
| Weight, kgb | 79.56 ± 11.98 | 79.17 ± 14.20 | 0.756 |
| Body mass index, kg/m2c | 30.07 ± 4.11 | 31.12 ± 4.59 | 0.203 |
| Gravid, nob | 3.04 ± 0.99 | 3.34 ± 1.40 | 0.433 |
| Gestational age, wkb | 37.99 ± 0.73 | 38.05 ± 0.85 | 0.660 |
aValues are expressed as mean ± SD.
bMann-Whitney U Test.
cIndependent-samples t-test.
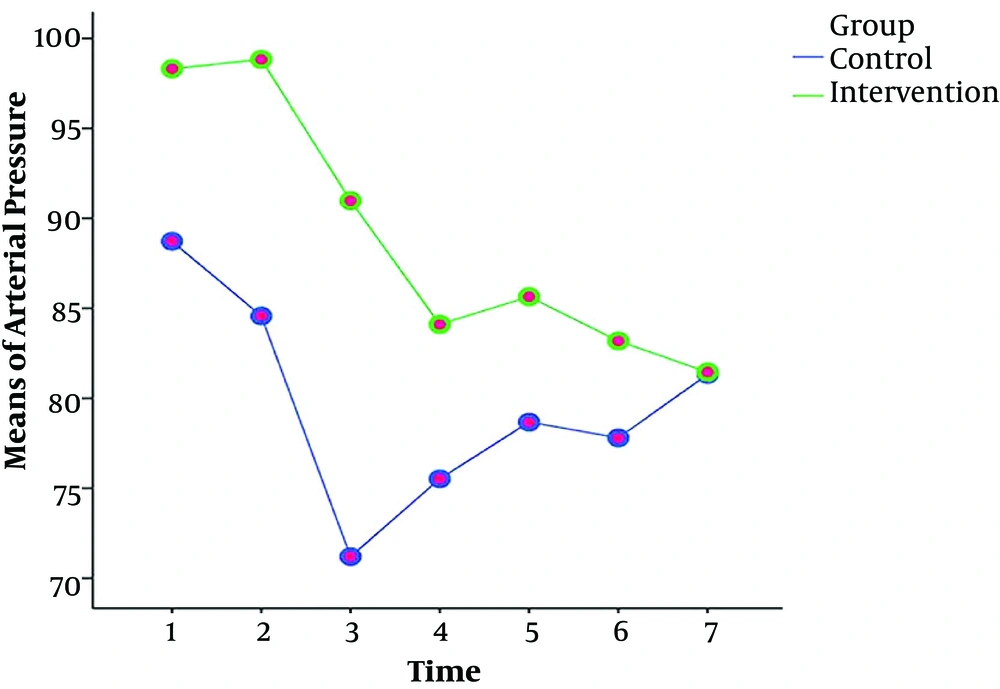
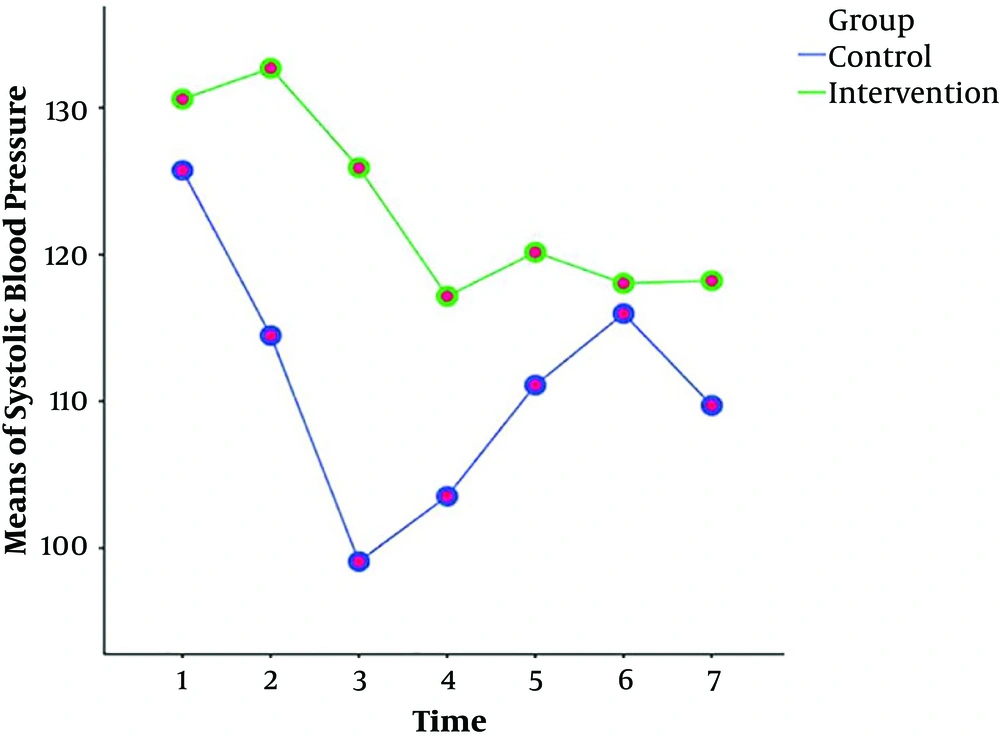
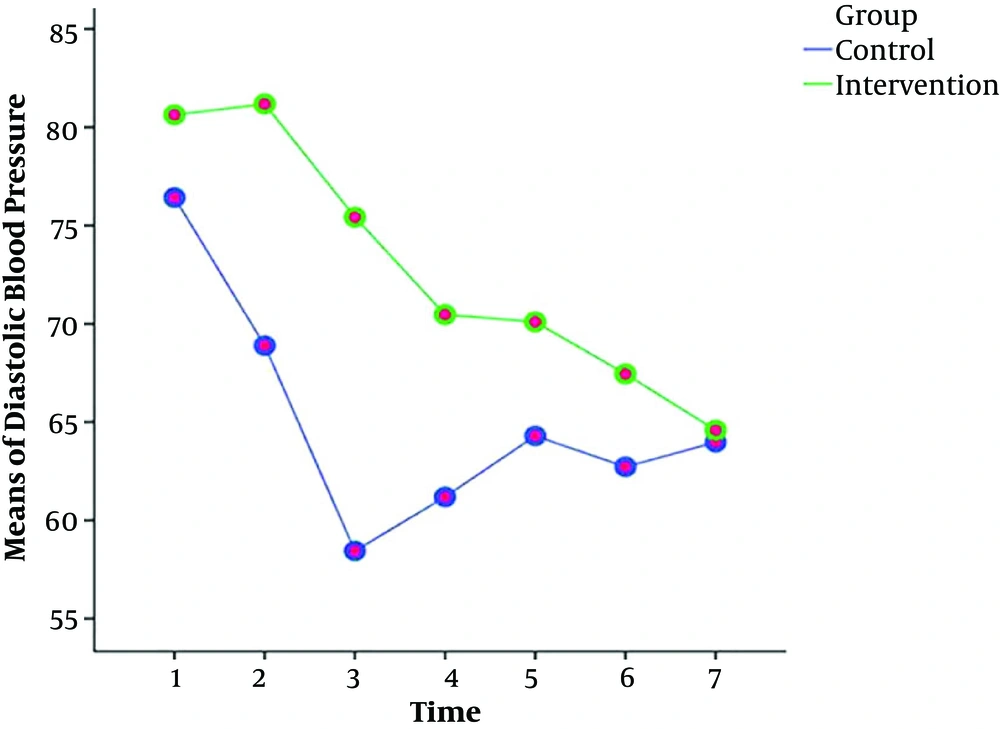
The results of the repeated measures ANOVA test showed that the values and reduction of the arterial pressure, systolic and diastolic blood pressures in the intervention group were less than the control group at different time points (Table 2). However, there was no significant difference between the groups in terms of heart rate and SOP2 at different time periods (Table 2). Also, Figures 2 - 4 show the variations of these variables at different time points.
| Group | P Value | ||
|---|---|---|---|
| Intervention | Control | ||
| Mean arterial pressure | < 0.001b; < 0.001c; < 0.001d | ||
| T1: Before intervention | 98.31 ± 7.65 | 88.72 ± 9.29 | |
| T2: 2 minutes after intervention | 98.83 ± 8.55 | 84.58 ± 13.77 | |
| T3: 4 minutes after intervention | 90.98 ± 14.27 | 71.20 ± 15.02 | |
| T4: 6 minutes after intervention | 84.10 ± 14.11 | 75.52 ± 10.74 | |
| T5: 8 minutes after intervention | 85.65 ± 12.16 | 78.67 ± 12.84 | |
| T6: 10 minutes after intervention | 83.19 ± 12.36 | 77.80 ± 9.85 | |
| T7: 12 minutes after intervention | 81.46 ± 10.79 | 81.33 ± 12.83 | |
| Systolic blood pressureb | < 0.001b; < 0.001c; < 0.001d | ||
| T1: Before intervention | 130.59 ± 8.98 | 125.74 ± 9.91 | |
| T2: 2 minutes after intervention | 132.69 ± 9.83 | 114.49 ± 17.31 | |
| T3: 4 minutes after intervention | 125.92 ± 14.31 | 99.09 ± 15.14 | |
| T4: 6 minutes after intervention | 117.16 ± 17.53 | 103.53 ± 16.17 | |
| T5: 8 minutes after intervention | 120.16 ± 16.47 | 111.11 ± 14.88 | |
| T6: 10 minutes after intervention | 118.04 ± 16.43 | 115.98 ± 18.70 | |
| T7: 12 minutes after intervention | 118.22 ± 11.42 | 109.72 ± 13.80 | |
| Diastolic blood pressureb | < 0.001b; < 0.001c; < 0.001d | ||
| T1: Before intervention | 80.63 ± 9.53 | 76.43 ± 10.28 | |
| T2: 2 minutes after intervention | 81.18 ± 9.15 | 68.89 ± 13.28 | |
| T3: 4 minutes after intervention | 75.43 ± 12.91 | 58.45 ± 13.68 | |
| T4: 6 minutes after intervention | 70.47 ± 13.10 | 61.19 ± 15.52 | |
| T5: 8 minutes after intervention | 70.10 ± 12.44 | 64.30 ± 12.37 | |
| T6: 10 minutes after intervention | 67.45 ± 12.11 | 62.72 ± 9.31 | |
| T7: 12 minutes after intervention | 64.59 ± 12.78 | 63.98 ± 13.51 | |
| Heart rateb | < 0.001b; 0.007c; 0.970d | ||
| T1: Before intervention | 94.33 ± 13.56 | 89.33 ± 12.16 | |
| T2: 2 minutes after intervention | 96.98 ± 13.92 | 90.05 ± 15.93 | |
| T3: 4 minutes after intervention | 93.33 ± 15.48 | 88.51 ± 21.04 | |
| T4: 6 minutes after intervention | 88.50 ± 15.29 | 81.26 ± 14.25 | |
| T5: 8 minutes after intervention | 84.65 ± 19.54 | 77.03 ± 15.92 | |
| T6: 10 minutes after intervention | 82.20 ± 14.35 | 76.64 ± 15.38 | |
| T7: 12 minutes after intervention | 89.09 ± 13.75 | 83.31 ± 13.96 | |
aValues are expressed as mean ± SD.
bP value: significant level for time.
cP value: significant level for group.
dP value: significant level for the interaction between group and time.
In this study, the results of the chi-square test indicated that the number of nausea requiring treatment and vomiting in the intervention group was lower than the control group (P value < 0.05; Table 3). Also, the results of the Mann-Whitney U test showed that the mean PH of the umbilical cord in the intervention group (7.28 ± 0.07) was higher than the control group (7.21 ± 0.22), however, the mean PCO2 in the intervention group (50.26 ± 6.43) was lower than the control group (56.57 ± 10.46; Table 3).
| Group | P Value | ||
|---|---|---|---|
| Intervention | Control | ||
| Qualitative Variables | |||
| Nausea and vomiting, No. (%)a | < 0.001 | ||
| No | 43 (74.10) | 20 (34.5) | |
| Slight nausea | 10 (17.20) | 18 (31.00) | |
| Nausea requiring treatment | 5 (8.60) | 12 (20.70) | |
| Vomiting | 0 (0) | 8 (13.80) | |
| Quantitative Variables | |||
| PH of umbilical cordb | 0.022 | ||
| Mean ± SD | 7.28 ± 0.07 | 7.21 ± 0.22 | |
| Number | 58 | 58 | |
| PCO2b | 0.001 | ||
| Mean ± SD | 50.26 ± 6.43 | 56.57 ± 10.46 | |
| Number | 58 | 58 | |
| Base excessb | 0.537 | ||
| Mean ± SD | -2.60 ± 4.70 | -2.89 ± 2.50 | |
| Number | 58 | 58 | |
| HCO3b | 0.056 | ||
| Mean ± SD | 23.20 ± 4.07 | 23.93 ± 2.20 | |
| Number | 58 | 58 | |
| Apgar 1b | 0.083 | ||
| Mean ± SD | 9.00 ± 0.00 | 8.95 ± 0.22 | |
| Number | 58 | 58 | |
| Apgar 5b | 0.159 | ||
| Mean ± SD | 10.00 ± 0.00 | 9.95 ± 0.29 | |
| Number | 58 | 58 | |
aChi-squared test.
bMann-Whitney U test.
In addition, the results of the chi-square test to compare the used phenylephrine, atropine, and metoclopramide in the intervention and control groups showed that their rates in the intervention group were lower than the control group (P value < 0.05). However, there was no significant statistical difference regarding atropine between both groups.
5. Discussion
The results of this study were consistent with the findings of other relevant studies. For example, the Ngan Kee et al. (11) study on the effect of prophylactic phenylephrine infusion in preventing hypotension during spinal anesthesia for cesarean delivery demonstrated that phenylephrine infusion was more effective in maintaining the baseline blood pressure compared with the phenylephrine infusion of 100 µg/min with bolus. In addition, the infusion group had a reduced incidence of hypotension (23%) compared with the control group (88%). A study by Prakash et al. (12) showed that 100 µg of phenylephrine or 6 mg of ephedrine were both effective in treating hypotension and also the changes of blood pressure were similar in two studied groups. Another study showed that the infusion of phenylephrine (100 µg) alone was more effective than the combination of phenylephrine and ephedrine to control maternal hemodynamics during spinal anesthesia in cesarean section (13). It has suggested that phenylephrine infusion was more beneficial on drug bolus administration in maintaining patients’ blood pressure during spinal anesthesia for cesarean delivery (14).
A review by Habib (10) showed that phenylephrine and ephedrine were both effective in the prevention and treatment of hypertension following spinal anesthesia and finally, concluded that the effectiveness of prophylactic infusion of phenylephrine in reducing the incidence of hypotension than bolus administration. However, phenylephrine infusion due to its high dose was associated with a greater reduction in heart rate and subsequently a decrease in cardiac output (10). das Neves et al. (15) showed that phenylephrine infusion immediately after spinal anesthesia had a greater effect on reducing the incidence of hypertension and adverse effects in patients. Allen et al. (16) demonstrated that the prophylactic phenylephrine infusion did not reduce the need for intervention by a physician to maintain maternal systolic blood pressure; however, it decreased the incidence and severity of hypotension. Finally, they recommended that prophylactic infusion at the doses of 50 and 25 µg/min provided more hemodynamic stability during spinal anesthesia for cesarean delivery. Phenylephrine is an alpha-adrenergic agonist with direct and indirect sympathomimetic effects. Unlike ephedrine, it has no direct inotropic and chronoscopic effects and its administration is associated with reflex bradycardia and decreased cardiac output (17). Studies have shown a dose-dependent reduction in heart rate following phenylephrine infusion (18). The prophylactic phenylephrine infusion is associated with a lower heart rate than treatment with phenylephrine bolus. The incidence of bradycardia in patients receiving phenylephrine was more than those who received ephedrine (13).
In our study, nausea and vomiting during surgery were less reported in the phenylephrine group than the control group, which is consistent with the results of other studies. For example, George et al. (19) showed that intraoperative nausea and vomiting were significantly reduced in the prophylactic phenylephrine infusion group compared with the phenylephrine bolus (46% vs. 75%, respectively; relative risk = 0.61 (95% CI: 0.47 - 0.80)), which was associated with the significantly reduced need for antiemetic drugs in this group. It was lower than the bolus group (26% vs. 42%; relative risk = 0.62 (95% CI 0.40 to 0.97) (19). In a study by Atashkhoie et al. (20) on 90 pregnant women under spinal anesthesia for elective cesarean delivery, nausea and vomiting in the phenylephrine and ephedrine infusion group (intervention group) was significantly lower than the placebo group.
5.1. Conclusions
Phenylephrine is effective in the prevention of some complications, like reducing mean arterial pressure, systolic and diastolic pressures, nausea, and vomiting during spinal anesthesia for cesarean delivery. These effects of Phenylephrine make mothers feel better during the cesarean section and lead to better control of maternal hemodynamics and ease of operation for the surgeon. In addition, they are not associated with adverse neonatal outcomes.


