1. Background
Parkinson's disease (PD) is a chronic and progressive neurodegenerative disease that affects dopamine-containing neurons of substantia nigra (SN) (1). At the beginning of the disease course, pathologic changes in dopaminergic neurons lead to the loss of these neurons in SN, ventral tegmental area (VTA), and basal ganglia. In addition to movement disorders associated with dopamine in PD, there is an increasingly non-dopaminergic deficit in other known brain regions (2-4). Despite researching, diagnosing, and clinically managing PD for decades, inappropriate methods have restricted its diagnosis and prognosis. Because we cannot attain enough information using routine medical imaging techniques, diffusion tensor imaging (DTI) has been used as a kind of advanced medical imaging (ref).
Diffusion tensor imaging is a precise and non-invasive imaging technique to identify microstructural white matter (WM), gray matter abnormalities, and nerve fiber tracts’ changes to detect microstructural damage in PD (5-7). In the brain white matter, due to the presence of the myelin sheath, which serves as a barrier against water release, the water distribution is anisotropic in the nerve fiber bundles, and it is higher in the long axis of the bundles (8). In a situation where the myelin of the axon structure is damaged, for example, by a stroke, brain tumors, or neurodegenerative diseases, like PD, the anisotropy is decreased, and the myelin sheath impermeability is affected by this injury (8). In these cases, it is possible to obtain valuable information from the white matter condition by the data obtained from the distribution of water molecules and processing of these data (9).
2. Objectives
In this research, DTI information was used to distinguish different areas of the brain in PD and normal populations to assess the ability of the DTI method to diagnose PD.
3. Methods
3.1. Study Design
This study is an observational study carried out from January 2019 to October 2019. The code of ethics was obtained from the Ethics Committee of Shahid Beheshti University of Medical Sciences (IR.SBMU.RETECH.REC.1397.1184), and written consent was obtained from subjects.
3.2. Study Population
The study population included all PD patients (ICD-10-CM codes G00-G99 diseases of the nervous system, G20-G26 extrapyramidal and movement disorders, and G20 Parkinson's disease) referring to the Parkinson's disease clinic of a university referral hospital from January 2019 to October 2019, amounting to 20 people. Due to the small size of the population, all of these patients were selected by the census as a sample. Ten people were considered as the control group. Each patient was evaluated and confirmed to be an idiopathic PD patient. The stages of Hoehn & Yahr (Table 1) of the disease were from 2 to 3 in all patients to prevent patient movement during the scan.
| Scale | Description |
|---|---|
| 1 | Unilateral involvement only |
| 1.5 | Unilateral and axial involvement |
| 2 | Bilateral involvement without impairment of balance |
| 2.5 | Mild bilateral disease with recovery on pull test |
| 3 | Mild to moderate bilateral disease, some postural instability, physically independent |
| 4 | Severe disability still able to walk or stand unassisted |
| 5 | Wheelchair-bound or bedridden unless aided |
Modified Hoehn & Yahr Scale
Exclusion criteria included patients with severe shaking, especially in the head, severe cognitive impairments, Alzheimer’s disease, dementia, head injury, and psychiatry disease. Also, 10 normal subjects (four males, six females, average age 57 years) were investigated as healthy controls. Inclusion criteria for normal subjects included no cognitive disease, no head injury, and no psychiatry disease (to make sure, a neurologist examined all normal volunteer subjects before the MRI exam).
3.3. Image Acquisition
In this study, MRI was performed using a 1.5 Tesla MRI device (GE scanner) with a 3D T1-weighted sequence with these parameters: (1) matrix size = 256 × 256, (2) slice thickness = 1.2 mm, (3) flip angle =12°, (4) TR= 7.77 ms, and (5) TE= 2.79 ms. The DT imaging was performed by using a single-shot spinecho EPI sequence with these parameters: Matrix size = 112 × 112, TR = 13000 ms, TE = 103 ms, and voxel size = 2.5 mm isotropic. Diffusion gradient encoding with b value = 1000 sec/mm2 and an additional measurement without diffusion gradient (b = 0 sec/mm2) were performed.
Two common DTI indices are fractional anisotropy (FA) and mean diffusivity (MD) (10). As known, FA is a quantitative unit that measures orientation for representing the amount of diffusion anisotropy. It takes a number between zero and one, which is higher for the intact white matter. Mean diffusivity, which describes the magnitude of water diffusion in brain tissue, measures diffusion in all directions and is lower in the intact white matter (5, 10). Data processing was performed using Explore DTI software. Eddy current correction was used to eliminate distortions and motion artifacts in DTI. Diffusion maps were co-registered to the T1-weighted images for anatomical guidance. All data were examined using manual analysis ROI (11). The ROI was used to calculate the amounts of FA and MD in the intended areas. The MD and FA maps were acquired.
3.4. Data Gathering
Data processing was performed using Explore DTI software. Eddy current correction was used to eliminate distortions and motion artifacts in DTI. Diffusion maps were co-registered to the T1-weighted images for anatomical guidance. All data were examined using manual analysis ROI (12). The ROI was used to calculate the amounts of FA and MD in the intended areas. The MD and FA maps were acquired.
3.5. Statistical Analysis
All statistical analyses were conducted on clinical data using SPSS version 19 and Excel version 2010 (1). We used the Loan test and t-test for comparison of FA and MD values between PD patients and healthy controls. The significance level in all analyses was considered less than 0.05.
4. Results
Twenty patients with idiopathic PD (17 males, three females, average age 61.49 ± 3.31 years) were investigated. Table 2 shows no difference in age (PD = 57 years, HC = 61 years, P value = 0.97), sex (PD, 17 males and three females; HC, seven males and three females), and H&Y stage (2 to 3) between the study groups.
| Characteristics | HC (n = 10) | PD (n = 20) | P Value |
|---|---|---|---|
| Age, mean ± SD | 57 ± 7.16 | 61.49 ± 3.31 | 0.97 |
| Sex, M: F | 7: 3 | 17: 3 | 0.33 |
| Hoehn &Yahr score (2 - 3) | - | 2.63 | - |
Demographic and Clinical Information
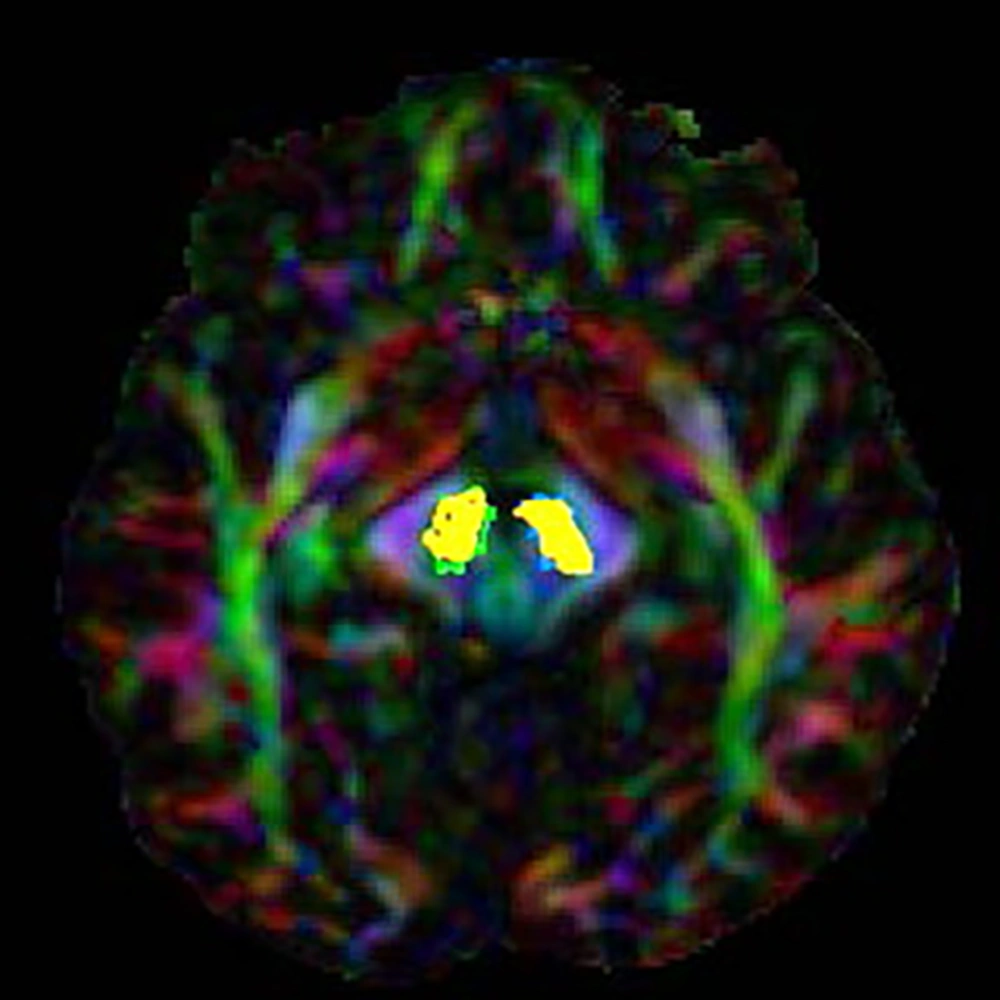
The values of FA and MD related to SN were compared in PD patients with the values of 10 healthy individuals (FA and MD are indices without dimension). The results of this comparison are presented in Table 3. The results showed that FA in L.SN had a significant difference between the patient and normal groups (P value = 0.007). However, on the opposite side, this difference was not significant in the FA parameter (P value = 0.3). Regarding the MD parameter, a significant difference was seen between the control and patient groups on both sides of SN (Figure 1) (P value of MD L.SN = 0.001 and P value of MD R.SN = 0.006).
| Variables | No. | Mean ± SD | t Test | Loan Test | ||
|---|---|---|---|---|---|---|
| P Value | F Value | P Value | F Value | |||
| fa.right.sn | 0.30 | -05.1 | 0.21 | 1.68 | ||
| PD | 20 | 0.09 ± 0.41 | ||||
| HC | 10 | 0.06 ± 0.44 | ||||
| md.right.sn | 0.006 | 2.98 | 0.44 | 0.62 | ||
| PD | 20 | 0.0001 ± 0.009 | ||||
| HC | 10 | 0.00003 ± 0.0008 | ||||
| fa.leftt.sn | 0.007 | -2.91 | 0.53 | 0.41 | ||
| PD | 20 | 0.05 ± 0.39 | ||||
| HC | 10 | 0.01 ± 0.44 | ||||
| md.leftt.sn | 0.001 | 3.70 | 0.31 | 1.09 | ||
| PD | 20 | 0.0001 ± 0.009 | ||||
| HC | 10 | 0.0002 ± 0.007 | ||||
Comparison of Fractional Anisotropic and Mean Diffusivity Values Between Patients and Healthy Controls
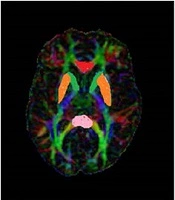
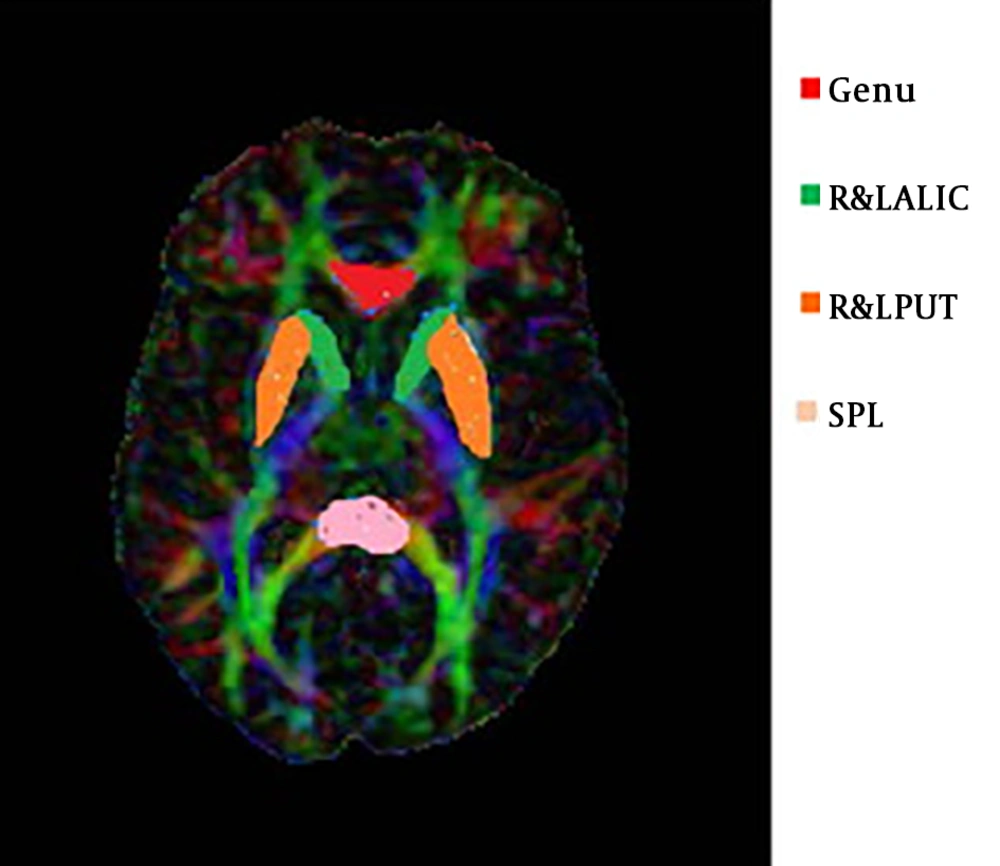
The FA value had a significant difference between PD and HC in SPL, as well as R&L PUT. But, these changes were not significant in the genu and R&L ALIC. Also, there was a significant difference in the MD value between PD and HC groups in the genu, R& L ALIC, and R&L Putamen. These changes were not in the splenium (Table 4). These ROIs are shown in Figure 2.
| Region | FA | MD | ||||
|---|---|---|---|---|---|---|
| HC | PD | P Value | HC | PD | P Value | |
| Genu | 0.72 ± 0.01 | 0.68 ± 0.01 | 0.16 | 0.0007 ± 0.000 | 0.0013 ± 0.0003 | 0.001*** |
| SPL | 0.78 ± 0.01 | 0.71 ± 0.00 | 0.009** | 0.0008 ± 0.000 | 0.0009 ± 0.000 | 0.06 |
| R.ALIC | 0.53 ± 0.02 | 0.50 ± 0.07 | 0.36 | 0.0006 ± 0.000 | 0.0008 ± 0.000 | 0.000*** |
| L.ALIC | 0.48 ± 0.03 | 0.49 ± 0.01 | 0.96 | 0.0006 ± 0.000 | 0.0008 ± 0.000 | 0.000*** |
| R.PUT | 0.19 ± 0.01 | 0.18 ± 0.00 | 0.04* | 0.0007 ± 0.000 | 0.0008 ± 0.000 | 0.000*** |
| L.PUT | 0.20 ± 0.00 | 0.19 ± 0.00 | 0.008** | 0.0007 ± 0.000 | 0.0008 ± 0.000 | 0.000*** |
5. Discussion
In this study, Parkinson’s disease patients without dementia showed a decrease in FA and an increase in MD, in the SN and other regions, and exhibited the anisotropy of diffusion tensor.
The amount of FA indicates the restriction of random movement and diffusion tensor and shows the anisotropy of water diffusion in tissue (12). Indeed, FA demonstrates the integrity degree of the brain's white matter, which is between zero and one. The results showed that FA values in L.SN, SPL, and R& L PUT decreased in PD significantly.
The MD evaluates the total diffusion molecules in the brain in different directions in a voxel (13). The present study indicated that the MD values in R&L SN, R&L PUT, R&L ALIC, and genu were higher in Parkinson's disease patients than in healthy controls. Previous extensive studies have shown a correlation between changes in the white matter structure and the occurrence of motor and cognitive impairment in Parkinson's disease (14). The development of advanced imaging techniques has made it possible to study molecular and structural changes in the brain.
A study by Zhan et al. was conducted in 2012 on 12 Parkinson's disease patients and 20 normal individuals using the DTI technique. Their study showed that the FA parameter in R&L SN, R&L internal capsule, and L.PUT was lower in Parkinson's disease patients than in normal subjects, which confirms the results of the present study (7). Their study also showed that the MD parameter in SN and PUT was higher in PD patients than in the HC group (7).
Hope et al. in 2019 declared that increased MD levels are usually due to the increased extracellular space, the effect of atrophy, demyelination, or loss of structural organization, and their findings indicated an increase in the MD level in areas recognized by PD pathology (4). In a study by Duncan in 2015, cognitive impairments were evaluated using DTI and morphometry. The MD values were not higher in healthy controls than in PD patients. The present study is perfectly consistent with these results, which can be due to the similarity of ROIs (15). The FA values had no difference between the control and patient groups. However, in the present study, the FA value of L.SN showed a meaningful difference between the healthy and patient groups, which could be due to a different statistical population in the study (15).
A study by Schwarz et al. in 2013 found that MD in the SN region was higher in Parkinson's disease patients than in the control group (13). However, in the present study, no decrease in the FA parameter was detected in PD patients. This is in contrast to our result and some studies like Vaillancourt et al. study (16), which showed that FA decreases in Parkinson's disease significantly. Cochrane assessed 21 studies in 2013. Almost all of these studies showed decreasing FA in SN (17). Also, some studies showed decreasing FA in L.PUT, genu, and internal capsule and increasing MD in the genu (17).
5.1. Limitations
Some patients’ head tremors affected the image quality, and we had to remove their results from the study. Therefore, this issue affected the sample size.


