

1. Background
The major factor related to the onset of disease is aging, which has had a growing epidemiologic relevance due to the increase in life expectancy worldwide (1). Aging is not homogenous among individuals. Two persons with the same chronological age may differ in their biological age (2). Nonetheless, the literature is still pursuing a trustable and accessible method to determine the biological age, usually based on blood factors or imaging exams (3). Even more specific genetic data, such as the inverse correlation between telomere extension and age, are not sufficiently precise for daily clinical practice (4).
Recently, Horvath (2013) discovered that the pattern of methylation of 353 human DNA base pairs analyzed from different tissues has a strong correlation with biological age (2). The further discovery that conditions such as obesity and cancer accelerate the modifications of what has been known as Horvath’s epigenetic clock revealed its potential clinical use (5). However, the determination of the biological age by the epigenetic clock is a non-continuous, high cost, and relatively complex method (6). The development of a continuous, non-invasive, and simple method to determine the biological age comparable to the method of epigenetic clock could bring a major advance in routine clinical practice.
The circadian rhythms modify across normal and pathologic aging (6). For example, aging-related neurodegenerative diseases such as Alzheimer’s disease may lead to sleep alterations (6). It is interesting to note that the brain structure mostly involved in aging and the control of circadian rhythms is the hypothalamus, which also controls autonomic functions such as temperature (7-9).
We previously showed that the adult human hypothalamus may participate in brain plasticity through the expression of markers related to the formation of new neurons (7-9). Next, we showed that the possible role of the hypothalamus in brain plasticity could be quantified (10-13). Accordingly, the mean intracranial pressure may be predicted with 24 hours of antecedence in stroke cases by the analysis of the variability of body temperature registered in monitors of intensive care unit (12, 13). Similarly, the ratio between the mean skin temperature during sleep and the preceding wake period correlated with the probability of occurrence of seizure in the following day in epileptic children (10, 11).
These data led to the idea that the biological age could be predicted by monitoring the circadian rhythm of temperature, which is the rationale of this study protocol (14).
1.1. Hypothesis
The hypothesis of this project is that the circadian pattern of the temperature can be expressed objectively as a variable that correlates with the biological age.
1.2. Goals
1.2.1. Primary Goal
The primary goal of this study protocol is to evaluate if the mean skin temperature during sleep and the preceding wake period (Ts/w) correlates inversely with the chronological age of healthy individuals across aging.
1.2.2. Secondary Goals
The secondary goals are: (1) To verify whether Ts/w is lower in obese individuals in comparison to healthy age-matched individuals. (2) To assess whether the environmental temperature could significantly influence Ts/w. (3) To assess whether the ratios between sleep and wake parameters used to measure the activity of the sympathetic and parasympathetic nervous system (electrodermal activity and heart rate variability, respectively) correlate with chronological age in healthy individuals and change with obesity.
2. Methods and Design
2.1. Participants
Sixty individuals will be enrolled and separated into four 15-individual groups according to the following criteria: (a) Healthy individuals with age between 18 – 44 years; (b) Healthy individuals with age between 45 – 72 years (c) Obese individuals with age between 18 – 44 years; (d) Obese individuals with age between 45 – 72 years
2.2. Inclusion Criteria
Individuals will be enrolled as healthy participants if they fulfill at least one of the following criteria: (1) No diagnosis of any disease; (2) Displaying disease that do not need any medical or surgical treatment (for example, minor refractive disorder); (3) Displaying conditions related to aging that do not significantly change the quality of life (for example, mild symptoms of migraine, climacterium, prostatism, vestibulopathy, or sleep disorder)
An individual will be enrolled as obese if presenting body mass index ≥ 30 with no other condition that significantly compromise the quality of life or with obesity-related conditions such as high blood pressure or type 2 diabetes with no target organ alterations (e.g., stroke, myocardial infarction, or chronic renal failure).
2.3. Exclusion Criteria
The subjects who present conditions such as alcoholism, smoking, or other chronic diseases will be excluded from the group of healthy individuals. Because we predict that it will not be feasible to form homogenous groups regarding sedentary lifestyle versus regular sports practice, this information will be recorded and analyzed but will not serve as an inclusion or exclusion criteria in a determined group.
It will be excluded from the group of obese individuals, those with obesity-associated disease and target organ alteration, or those with no obesity-associated disease but with another condition that significantly interferes in quality of life (e.g., epilepsy or cancer).
2.4. Materials
In this study, it will be used three wristbands with vital sign sensors Empatica E4 (Empatica, Cambridge, USA), and three NO.1 F5 smartwatches (DT NO.1, Shenzhen, China).
2.5. Methods
After Institutional Review Board approval of the project, volunteers will receive verbal and written guidance on the project and, if they agree to be enrolled in the project, they will be asked to sign a free consent form. Next, the volunteer will receive an Empatica E4 wristband and a NO.1 F5 smartwatch and instructions on the use of these devices. The enrolled individuals will be submitted to an interview to provide personal and clinical data and oriented to wear the wristband and smartwatch on the same wrist for as much time as possible during three consecutive days. Monitoring data will be conveyed on apps according to manufacturers’ instructions and stored on computer.
The volunteer will be asked to wear the wristband and the smartwatch for three more days if during the first three days of monitoring we do not achieve at least one day with ≥ 75% of time of consecutive sleep and wake periods with satisfactory monitoring of skin temperature, heart rate, and electrodermal activity and at least 4 h of satisfactory monitoring of environmental temperature while the volunteer is awake (Ew) or sleeping (Es).
After the end of the monitoring with the minimal requirements mentioned above, the day of monitoring selected to data analysis will be the one in which the number of hours of monitoring with the wristband plus the number of hours of monitoring with the smartwatch is higher. We will synchronize the time of both devices with the Internet server time.
Using Excel 2016 (Microsoft, Redmond, USA), a spreadsheet containing each individual data and the calculated value of a parameter (mean skin temperature, heart rate variability (here defined as the heart rate standard deviation (12) and mean electrodermal activity) during the sleep and the preceding wake period will be created. Other variables developed based on our previous findings, such as the ratio between the coefficient of variation during night (6:00 P.M. to 5:59 A.M) and the coefficient of variation during the preceding day (6:00 A.M. to 5:59 P.M.) (12) or the same coefficients using sleep and wake periods instead of night and day, will be explored. We also believe that it is worthwhile to analyze the ratio between the mean of the derivatives (or the modulus of these derivatives) calculated from the curve of a given autonomic parameter during sleep and the preceding wake period. The same type of analysis may be carried out using the area under the curve (AUC).
The occasional influence of the environmental temperature on the results will be explored empirically using different formulas with skin and environmental temperature parameters. For example, we intend to compare skin temperature during sleep (Ts) and wakefulness (Tw) according to the proportion in which the mean environmental temperature in a period will be above or below the mean temperature during the whole day. In this case, the formula would be Tf(e) = TsEs / TwEw.
2.6. Statistical Analysis
Variable calculation and statistical analysis (principally by Mann-Whitney test) will be carried out using the MatLab R2014a software (MathWorks, Natick, United States). The groups will be: healthy individuals aged < 45 years old vs. old healthy individuals aged ≥ 45 years; healthy individuals vs. unhealthy individuals.
The analyzed variables will be the ratio of mean autonomic parameter (temperature, electrodermal activity, and heart rate variability) during the sleep and the preceding wake period. A P < 0.05 will be regarded as significant.
Additionally, other statistic tools such as moving average, linear regression, and spectral analysis will be explored.
2.7. Feasibility
The study will be carried out at the Department of Neurology, Clinic Hospital, Faculty of Medicine, University of Sao Paulo, in Sao Paulo, Brazil. Except for the smartwatches, materials are already available at the Department.
2.8. Timetable
Months 1 – 3: material purchase and volunteer enrollment
Months 4 – 8: monitoring of three individuals per week
Months 9 – 12: data analysis and manuscript preparation
3. Discussion
3.1. Expected Results
Ts/w is significantly higher in young individuals.
Ts/w is significantly lower in obese individuals compared to age-matched healthy individuals.
Environmental temperature does not significantly influence Ts/w.
3.2. Example of Case
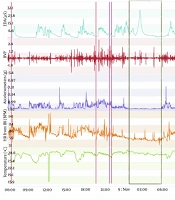
The type of data to be acquired is depicted in Figures 1-3. These figures display data obtained from the same individual who consented to publish this information. This monitoring was carried out as a test to complement another ongoing project that we are developing, aiming at seizure prediction in adult epileptic patients. The volunteer wore an Empatica E4 wristband for one day when he was 46 years old and, when he was 49 years old, for one regular day and one day of sports practice. A qualitative analysis can be performed initially with the screen displayed on the manufacturer webpage. In this manner, we usually analyze first the accelerometer curve together with the time line aiming at determining the sleep period (when the curve is practically flat) and the wake period (when the curve shows fluctuations related to wrist movement during wakefulness). With the determination of these periods, we can carry out a visual analysis of temperature, electrodermal activity, heart rate, and blood volume pressure. Next, recorded data can be conveyed on a computer to carry out quantitative analysis. Importantly, the case shown in Figures 1-3 is merely illustrative and will not be used in this study protocol because environmental temperature was not monitored during vital sign monitoring.
, blood volume pressure from photoplethysmography, 3-axis acceleration from -2g to +2g, heart rate, temperature in degrees Celsius, and time and date. Red lines represent event marker. Black rectangle encompasses the sleep period detected by the analysis of the accelerometer curve, with practically no movement detected (flat line).")
Vital sign monitoring during a sleep-wake cycle in a 46-year-old man. The figure depicts vital sign data obtained from an Empatica E4 wristband. The lines from top to bottom display electrodermal activity in microsiemens (µS), blood volume pressure from photoplethysmography, 3-axis acceleration from -2g to +2g, heart rate, temperature in degrees Celsius, and time and date. Red lines represent event marker. Black rectangle encompasses the sleep period detected by the analysis of the accelerometer curve, with practically no movement detected (flat line).
 to about 33°C (49 years) across a sleep-wake cycle. Note that the electrodermal activity shows lower values (peaks around 30 µS for 46 years of age and 5 µS for 49 years of age). However, the electrodermal activity sensors may lack sensibility after approximately six months of use, according to the manufacturer. Even if the decrease in the electrodermal activity detected after three years with the same sensors occurs due to technical issues, the variables that we propose in this study protocol can overcome this issue because they normalize the parameter in function of data obtained during the same sleep-wake cycle. The major decrease of values observed principally in the temperature curve represents the period during which the device was removed to be recharged.")
Vital sign monitoring during a sleep-wake cycle in a 49-year-old man. Data was obtained from the same individual shown in Figure 1. Curves display the same parameters, and black rectangle delimitates the night sleep period. Note that the temperature varied from about 29°C (46 years) to about 33°C (49 years) across a sleep-wake cycle. Note that the electrodermal activity shows lower values (peaks around 30 µS for 46 years of age and 5 µS for 49 years of age). However, the electrodermal activity sensors may lack sensibility after approximately six months of use, according to the manufacturer. Even if the decrease in the electrodermal activity detected after three years with the same sensors occurs due to technical issues, the variables that we propose in this study protocol can overcome this issue because they normalize the parameter in function of data obtained during the same sleep-wake cycle. The major decrease of values observed principally in the temperature curve represents the period during which the device was removed to be recharged.
. Note the major increase in the electrodermal activity (peak of 127µS immediately after the running). The influence of sports activity in the pattern of oscillation of circadian rhythms, quantified as suggested in this study protocol, remains to be determined.")
Vital sign monitoring during a sleep-wake cycle in a 49-year-old man with sports activity. The figure displays data, lines, and black rectangle as in Figures 1 and 2, except for the red lines, which here delimitate the period during which the individual was running (total of 19km; average of 6min16sec per km). Note the major increase in the electrodermal activity (peak of 127µS immediately after the running). The influence of sports activity in the pattern of oscillation of circadian rhythms, quantified as suggested in this study protocol, remains to be determined.
A caveat in using only Empatica E4 wristband is that environmental temperature is not registered. Indeed, to the best of our knowledge, no device is built with sensors with simultaneous monitoring of environmental and skin temperature.
Moreover, confounding factors such as daily activities must be assessed. The example depicted in Figure 3 shows a major increase in electrodermal activity and heart rate and a decrease in skin temperature during running. It is unknown how this type of activity would influence the behavior of autonomic parameters during the rest of the sleep-wake cycle.
For this reason, we first intend to analyze data from monitoring days without factors that clearly interfere in the autonomic parameters (e.g., sports practice, infection). This pilot study could underpin a further study, with larger number of enrolled individuals, monitored days and daily situations toward the development of a method feasible and useful in routine clinical practice.
3.3. Implications and Relevance
This study may contribute to finding a simple and non-invasive method to determine the biological age and guide prevention and therapies of aging-related diseases. Additionally, this study may serve as a reference for the normal behavior of autonomic parameters across healthy aging in studies aiming at developing methods of prediction of occurrence of paroxysmal signs such as pain in migraine, trigeminal neuralgia, and cluster headache (14).
For now, we have already shown the potential clinical application of the analysis of circadian oscillation of temperature to predict seizure in epileptic patients and intracranial hypertension in severe stroke with one day of antecedence.
