


1. Background
Chronic non-specific low back pain (CNSLBP) is a complex heterogeneous biopsychosocial disorder with multiple manifestations (1, 2). Some studies had made attempts to classify CNSLBP patients into more homogenous subgroups to enhance treatment efficiency (3). Interests have recently increased in the underlying neurophysiological mechanisms of CNSLBP as well as the treatment of patients (4). A Delphi-survey T classification was the basis of the most recent classification system, which focused on setting clinical criteria. These criteria were derived from the subjective and physical examinations that had classified the CNSLBP according to the pain mechanisms. These mechanisms can generally be classified into input, processing, and output mechanisms that take place at the same time; however, one mechanism might be clinically dominated over the others (5).
As mentioned, previous studies of CNSLBP patients concentrated on input and processing mechanisms and somehow ignored the output mechanisms. Neuroimaging research had illustrated that chronic musculoskeletal pain was the cause of structural and functional cortical reorganization. These, in turn, seemed to be responsible for the activity alteration of the lumbopelvic area muscles with the shifts in the motor cortical representation of these muscles in CNSLBP patients (6). Consequently, this might lead to the evolution and the preservation of chronic pain (7); so, the potential value of abnormal cortical processing of the CNS in patients with the CNSLBP has attracted some researchers (8). Accordingly, different studies had come up with the conclusion that the corollary of pain and avoidance behaviors (pain-related fear) could shift the different patterns of muscle activation such as flexion relaxation phenomena (FRP) (9, 10).
As we know, the trunk forward flexion movement is one of the most important movements that might affect the lumbopelvic rhythm. It is well accepted that this movement involves all physical and functional activities of daily living and could be related to expected pain and\fear of pain as a contributing factor to the motor control disorder (11). Electromyography recordings, by coherence measurement, had been mostly used for the assessment of corticospinal synchrony or intramuscular synchrony in this context (12). The intermuscular coherence (IMC) was suggested as a helpful tool to study motor control and a better perception of the CNS strategies during the execution of motor tasks (13). The IMC was characterized as a coherence analysis between the surface electromyography (sEMG) signals from the synergistic muscles (13) and could also define the common oscillatory drive to a pair of muscles (intermuscular coherence) (14). Besides, it might detect the existence of shared inputs of the neural presynaptic from the higher structures of the brain and specifically from the motor cortex (15), and the common spinal interneurons contributions (16). It exclusively aimed to define these neural mechanisms, by studying peripheral information only. Furthermore, it was shown that coherence at specific frequencies had been mediated via specific pathways, including delta “0 - 5 HZ” alpha”5 - 15 HZ” beta”15 - 30 HZ” and gamma”30 - 60 HZ”. Thus, coherence analysis detected at different ranges of frequencies could provide significant information on the function of the nervous system for controlling the activity of muscles during various tasks (17). Accordingly, Beta band Intermuscular Coherence (Bb-IMC) was assumed to form largely from the primary motor cortex and could constitute a potential biomarker of the corticospinal tract function. It was also presumed to show the common corticospinal drive from the primary motor cortex to the muscles. Then, it was suggested that Bb-IMC could be considered a proper tool for the assessment of dynamic tasks as well (17). In other words, other bands were suggested to be related to common inputs from the subcortical structures (18) and reflect the synchronization of multiple muscles during postural tasks (e.g., slow movements, and isometric contraction) (19). Besides, the Bb-IMC tool had shown to have clinical application in spinal cord injury patients to investigate the possible effect (s) of spinal cord injury on the common neural drive adjusting the agonist and antagonist muscles pair's activity (20). Also, another study investigated the spasticity of stroke patients and the possible mechanisms causing the abnormal motor overflow (21). In addition, the Bb-IMC was used to study the impaired motor function accompanied by aging, and the results were important in terms of suggesting some new interventions to reinforce the control of sensorimotor in elderly subjects (22). Bb-IMC is easy to measure and needs only the recording through sEMGs without any adverse effects from the needle recordings. In general, three most commonly used ways of studying coherence are between a couple of muscles (pairwise coherence) (23), across the three muscles together (pool coherence) (24), while the residual coherence was considered the study of coherence after removing components between the couples of muscles (25). Our previous study (in press) showed a moderate to a high level of reliability and agreement for Bb-IMC in CNSLBP patients and healthy subjects during the Flexion-extension task (F-ET). To the best of our knowledge, no investigation had been performed on Bb-IMC through pairwise coherence (PWC) and pool coherence (PC) in LBP patients as a whole and particularly in the CNSLBP patients. Moreover, the previous studies on LBP and, in particular, the CNSLBP had used the criteria of A Delphi-survey classification system to understand the mechanisms of input and processing and had paid no attention to the output mechanisms.
2. Objectives
the current study attempted to study CNSLBP patients according to the criteria of sensorimotor control dysfunction (i.e., T A Delphi-survey classification) during four phases of trunk flexion-extension task (e.g., standing, flexion, relaxation, and extension phases) and compared them with healthy subjects using PWC and PC of Bb-IMC and FRP.
3. Methods
3.1. Participants
Twenty-four men suffering from the CNSLBP and 20 healthy subjects voluntarily (i.e., age 20 -60 years) participated in this study. The research was conducted at the Biomechanics Laboratory, School of Rehabilitation, Tehran University of Medical Sciences. The inclusion criteria for the CNSLBP patients were as follows: A history of a minimum of 3 months of pain based on sensorimotor control dysfunction criteria according to A Delphi-survey (depending on pain mechanisms) (5, 26) and had at least 30 out of 100 in the Numerical Rating Scale (27), eight out of 50 in questionnaire Oswestry (28) and 45 score of 96 in Fear-Avoidance Beliefs questionnaire (29).
If the patients were reluctant to be a part of the study, they were excluded at any stage. Bear in mind that healthy subjects were included in the study if they had no history of LBP or they had not received previous postural training exercises (30). Furthermore, all participants signed an informed consent form according to a protocol approved by the Ethics Committee of Tehran University of Medical Sciences (TUMS) with the assurance number IR.TUMS.VCR.REC.1398.675 and IRCT20090301001722N22.
3.2. Measures/Instruments
The skin overlying the relevant muscles was shaved and cleaned with alcohol wipes, and all sEMG signal recordings were made via the DataLOG, Biometrics Ltd, Gwent, UK.
Then, the bipolar active electrodes with a recording diameter of 10 mm and a 20 mm fixed center to center interelectrode distance were mounted on the relevant muscle, built-in differential amplifier, and the ground electrodes were located on the right wrist. The electrode positions and orientations were according to EMG sensor locations prescribed in SENIAM guidelines (31). Thereafter, sEMG signals were recorded from the right erector spinal muscle of the lumbar region “1”, left erector spinal muscle of the lumbar region “2”, right gluteus maximus muscle “3”, left gluteus maximus muscle “4”, right hamstring muscle “5” and left hamstring muscle “6”. And finally, muscles 1, 4, and 6 as a group (A) and also, muscles 2, 3, and 5 were considered a group (B), respectively.
3.3. Procedure
Participants stood inside a square marked on the floor while their hands were in parallel, aligned their body and the distance between their feet was equal to the widths of the pelvis (32); also, a paper placed on the experiment site to ensure a standardized foot placement for each trial. The participants’ eyes were focused on a visual target placed at 3-meter distance. After that, the participant was asked to perform a F-ET (i.e., verbal commands) while the sEMG signals were recorded for 20 seconds (i.e., 5 sec. at upright standing phase, 5 sec. during flexion phase, 5 sec. at relaxation or full flexion phase, 5 sec. during extension phase). A metronome simultaneously with sEMG recordings as an auditory signal (beep) was monitoring the consequences of each mentioned phase every second during the entire task. The participant also required to bend forward as far as possible with the knees at extension three times. The participant was permitted to rest for two minutes between each test to minimize the chances of a back injury, discomfort, and fatigue (33, 34).
3.4. Beta-Band Intermuscular Coherence Analysis
To highlight the contributions of coherence that were common to unique to each pair of muscles or all synergist muscles, both the pool coherence (PC) (24) across group A (1, 4, 6) and group B (2, 3, 5) and the pairwise coherence (PWC) among each pair of muscles were measured.
Three muscles were estimated using the pool coherence function to find out the common neural coupling between each of two muscle groups (i.e., group A and group B) (35), which is defined as:
Where p denoted all the possible muscles pairs 1, 4, 6 then 2. 3. 5 in our case, namely1.4, 1.6, and 4.6, then 2.3, 2.5 and 3.5, j stood for the j pair, Pxy (f) was the density of power cross-spectral, Pxx (f) and Pyy (f) represented the densities of the auto spectral of the two muscles forming the couple, and Lj was the number of segments that used for the auto spectral and cross-spectrum estimation.
Pxx (f), Pxy (f), and Pyy (f) were estimated with 50% overlap directing to a spectral resolution of 2 Hz according to the signals lasting 500 ms (i.e., window using a Hanning function) (36) and to improve the estimation the doubling the number of available signals was done. Besides, to estimate the contribution of coherence between two muscles, the analysis of pairwise coherence was performed. The following standard coherence formulation was the basis of this analysis:
Where Cxy was the coherence between sEMG signals x and y, the f was the frequency. Pyy and Pxx denoted auto spectra for signal y and x, while Pxy stood for signal x and y cross-spectrum. Following the procedure, xDC (t) time series was used to calculate the coherence of all phases of F-ET. In this case, on 500 ms portions window through Hanning function and with a 50% overlap via Welch's method, the cross-spectral and the auto spectral were calculated.
Coherence was defined as the frequency-domain of Pearson's correlation coefficient extension and expressed the linear correlation degree between the signals at every frequency on a scale ranged from 0 to 1, where 1 represented perfect correlation and 0 represented no correlation (37). The raw EMG signal was detruded Before EMG-EMG coherence calculation to remove the offset.
When intramuscular coherence exceeded a confidence limit (CL) with a probability of 95%, it was distinguished at a specific frequency to be significantly larger than zero. CL was determined as:
where α equaled the desired level of significance (38).
The inverse Fourier transform of the coherence spectrum was defined as the cumulate density function for each part of FRP separately. As a time-domain measure of association between sEMG signals, inverse Fourier transform was calculated.
Cumulate density function and coherence spectra were calculated for all muscle groups and for every phase of F-ET, and the result was a set of 24 coherence spectra per subject. With the goal of increasing the reliability of coherence estimations for each participant from all three trials, sEMG signals were focused on creating a longer single time series. In the following steps, to provide a visual representation of the coherence dependence on frequency. The spectra for a mentioned muscle pair were averaged in all participants within a group.
According to the results, coherence values were calculated between 0 and 350 Hz. Frequency spectrum analysis for each phase of F-ET tasks measured using MATLAB software 7.11 and spectrums of 15 - 30 Hz moved to coherence software too. So, we were able to guess the mean coherence distribution in a specific frequency band across the participants and provide a group summary.
3.5. Flexion Relaxation Phenomena Analysis
To yield linear envelopes, the EMG data that were recorded was rectified and smoothed full-wave with a 50 ms for a time constant (smoothing technique was moving average 50 ms). To normalize the EMG values during the F-ET, the peak magnitude of EMG was used. Meanwhile, to define the beginning and the end of the flexion–relaxation period, 5% for a threshold level of the same magnitude was applied (The above approach was used for normalization and onset – offset of FRP).
In fact, the point at which the magnitude of the EMG signal is below the threshold level was considered to be the onset of the flexion–relaxation phenomenon (EMG-Off), and the point at which EMG signals amplitude exceeded the threshold level during the extension phase was considered to be the endpoint of the phenomenon (EMG-On) (Figure 1) (39). The visual inspection of the rectified EMG signal was used to determine the EMG end and beginning. Then, the EMG data obtained from both sides were averaged.

Typical recordings of EMG activity during F-ET. The linear envelope was used to estimate EMG-O and EMG-On points. The extension phase used for the normalization of the EMG linear envelope was also provided.
3.6. Statistical Analysis
Kolmogorov-Smirnov showed the normal distribution of age, weight, height, and body mass index (BMI) in groups (P > 0.05). SPSS Statistics for Windows, version 25 (SPSS Inc., Chicago, Ill., USA) was used for all analyses. An alpha level of ≤ 0.05 was set for all statistical tests with a Bonferroni adjustment.
The mean pool coherence (mPC) for group A and group B was measured by mixed model ANOVAs for each phase of the four phases of the F-ET after calculating the PWC and PC. Paired t-test was carried out to assess the significant differences in mPC group A muscles (A mPC), mPC group B muscles (B mPC) in three groups as following CNSLBP patients group, healthy subjects group and the third group included all subjects that participated in this study (P < 0.05), whether patients or healthy and it was called the general group. The mean pairwise coherence (mPWC) among each pair of group A and B muscles was measured by mixed model ANOVAs for each phase of the four-phase F-ET as well. A paired t-test was applied to assess the significant differences in mPWC group A muscles (A mPWC), mPC group B muscles (B mPWC) in the four phases of F-ET for CNSLBP patients and healthy subjects group (P < 0.05). For FRP, to test the measurement reliability, the differences T-tests between the means of the CNSLBP patients and healthy subjects were used. It should be mentioned that the mean of the three trials was used.
4. Results
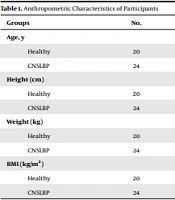
As mentioned above, there were no significant differences between the groups in terms of basic anthropometric characteristics and showed two groups were matched (i.e., age, height, weight, and BMI) (P > 0.05) (Table 1)).
| Groups | No. | Mean | Std. Deviation | P-Value |
|---|---|---|---|---|
| Age, y | 0.564 | |||
| Healthy | 20 | 34.7500 | 10.04136 | |
| CNSLBP | 24 | 41.5833 | 9.13991 | |
| Height (cm) | 0.482 | |||
| Healthy | 20 | 174.8500 | 6.38481 | |
| CNSLBP | 24 | 178.4167 | 9.98598 | |
| Weight (kg) | 0.507 | |||
| Healthy | 20 | 79.6200 | 8.12686 | |
| CNSLBP | 24 | 85.6667 | 13.42544 | |
| BMI (kg/m2) | 0.476 | |||
| Healthy | 20 | 26.0490 | 2.39089 | |
| CNSLBP | 24 | 26.8375 | 3.51591 |
Anthropometric Characteristics of Participants
It was mentioned that all phases of F-ET as standing, flexion, relaxation, and extension phases were recorded by sEMG from the right erector spinal muscle of the lumbar region “1”, left erector spinal muscle of the lumbar region “2”, right gluteus maximus muscle”3”, left gluteus maximus muscle”4”, right hamstring muscle”5” and left hamstring muscle”6”. Accordingly, muscles 1, 4, and 6 were named as a group (A); additionally, muscles 2, 3, and 5 were considered a group (B).
Pool coherence (PC) and pairwise coherence (PWC) were calculated in this study, and then the mean pool coherence (mPC) for group A and the group B for four phases of F-ET was considered using the Bb-IMC in the following three groups: the general group consisted of all subjects (CNSLBP patients and healthy subjects), CNSLBP patients, and healthy subjects. (Table 2). The general group demonstrated the results of the investigation of mPC group A (A mPC), mPC group B (B mPC) in the four phases of F-ET for three groups.
| Phases | Count | Sum | Mean | Variance | |||
|---|---|---|---|---|---|---|---|
| Group A | Group B | Group A | Group B | Group A | Group B | ||
| General | |||||||
| Standing | 44 | 4.65 | 5.04 | 0.106 | 0.114 | 0.0005 | 0.0005 |
| Flexion | 44 | 5.36 | 5.00 | 0.122 | 0.114 | 0.0007 | 0.0008 |
| Relaxation | 44 | 4.78 | 4.91 | 0.109 | 0.112 | 0.0006 | 0.0006 |
| Extension | 44 | 4.77 | 5.52 | 0.108 | 0.125 | 0.0010 | 0.0005 |
| CNSLBP | |||||||
| Standing | 24 | 2.44 | 2.80 | 0.102 | 0.117 | 0.0005 | 0.0004 |
| Flexion | 24 | 2.89 | 2.77 | 0.121 | 0.116 | 0.0004 | 0.0009 |
| Relaxation | 24 | 2.81 | 2.66 | 0.117 | 0.111 | 0.0006 | 0.0008 |
| Extension | 24 | 2.74 | 3.10 | 0.114 | 0.129 | 0.0007 | 0.0006 |
| Healthy | |||||||
| Standing | 20 | 2.20 | 2.23 | 0.110 | 0.112 | 0.0005 | 0.0005 |
| Flexion | 20 | 2.46 | 2.22 | 0.123 | 0.111 | 0.0010 | 0.0006 |
| Relaxation | 20 | 1.97 | 2.24 | 0.099 | 0.112 | 0.0004 | 0.0004 |
| Extension | 20 | 2.02 | 2.40 | 0.101 | 0.120 | 0.0012 | 0.0003 |
Mean Pool Coherence (mPC) of A and B Muscle Group for the General Group (CNSLBP Patients and Healthy Subjects), CNSLBP Patients and Healthy Subjects
Moreover, FRP was detected in the healthy subjects in all of the cases (100%), but in the CNSLBP, this phenomenon disappeared significantly between 0% for the right side and 8.33% for the left side. The Decremental of percentage between the relaxation and extension phase was shown in (Table 3).
| Healthy | CNSLBP | |||
|---|---|---|---|---|
| Mean ± SD | FRP | Mean ± SD | FRP | |
| RT side | 19.17 ± 10.10 | Yes, 100% | 61.60 ± 10.58 | No, 0% |
| Lt side | 20.12 ± 10.61 | Yes, 100% | 58.81 ± 18.17 | No, 8.33% |
FRP in CNSLBP Patient and Healthy Subject Groups
However, there was a difference in the ANOVA test-between the groups in both muscles group A and muscles group B. We noticed there was a little difference (0.024) (P < 0.05) during the co-contraction of two sets of group A; as we detected the differences of 0.037 and 0.047 in healthy subjects and CNSLPB patients, respectively (P < 0.05). Regarding group B muscle, we noticed that when the results of the two groups were considered together, there was a slight difference (0.046), whereas, in healthy subjects and patients, no difference was observed. Besides, we found out that a slight difference (0.046) in group B (P < 0.05), when the two groups were considered together; however, no difference was observed in healthy subjects and patients alone (Table 4).
| Between Groups | Within Groups | |||||||||||
|---|---|---|---|---|---|---|---|---|---|---|---|---|
| General | CNSLBP | Healthy | General | CNSLBP | Healthy | |||||||
| Group A | Group B | Group A | Group B | Group A | Group B | Group A | Group B | Group A | Group B | Group A | Group B | |
| SS | 0.006947 | 0.005034 | 0.0048 | 0.0045 | 0.0074 | 0.001 | 0.123158 | 0.106123 | 0.0537 | 0.0658 | 0.0630 | 0.0388 |
| Df | 3 | 3 | 3 | 3 | 3 | 3 | 172 | 172 | 92 | 92 | 76 | 76 |
| MS | 0.002316 | 0.001678 | 0.0016 | 0.0015 | 0.0024 | 0.0003 | 0.000716 | 0.000617 | 0.0005 | 0.0007 | 0.0008 | 0.0005 |
| P-value a | 0.024 | 0.046 | 0.047 | 0.104 | 0.037 | 0.541 | ||||||
The Alteration of A and B Coherences in the General Group (CNSLBP Patients and Healthy Subjects), CNSLBP Patients, and Healthy Subjects
Moreover, the mean pairwise coherence (mPWC) was calculated among each pair of muscle groups A and B for four phases of F-ET using Bb-IMC in CNSLBP patients and healthy subjects group. The research on mPWC group A (A mPWC), mPC group B (B mPWC) in the four phases of F-ET for three groups were shown in (Tables 5 and 6), respectively.
| Standing Phase | Flexion Phase | |||||
|---|---|---|---|---|---|---|
| Healthy | CNSLBP | P-Value a | Healthy | CNSLBP | P-Value a | |
| Group A | ||||||
| PWC (1 - 4) | 0.906 ± 0.020 | 0.894 ± 0.024 | 0.078 | 0.914 ± 0.029 | 0.885 ± .021 | 0.000 |
| PWC (1 - 6) | 0.898 ± 0.024 | 0.896 ± 0.036 | 0.862 | 0.898 ± 0.030 | 0.889 ± 0.022 | 0.299 |
| PWC (4 - 6) | 0.900 ± 0.030 | 0.901 ± 0.026 | 0.956 | 0.890 ± 0.030 | 0.878 ± 0.027 | 0.178 |
| Group B | ||||||
| PWC (2 - 3) | 0.896 ± 0.031 | 0.899 ± 0.025 | 0.741 | 0.895 ± 0.026 | 0.892 ± 0.028 | 0.741 |
| PWC (2 - 5) | 0.891± 0.031 | 0.897 ± 0.029 | 0.569 | 0.903 ± 0.025 | 0.892 ± 0.021 | 0.569 |
| PWC (3 - 5) | 0.886 ± 0.030 | 0.896 ± 0.022 | 0.201 | 0.891 ± 0.027 | 0.890 ± 0.025 | 0.201 |
Pairwise Coherence Group (A) and Group (B) in CNSLBP Patients and Healthy Subjects During the Standing and Flexion Phase
| Relaxation Phase | Extension Phase | |||||
|---|---|---|---|---|---|---|
| Healthy | CNSLBP | P-Value a | Healthy | CNSLBP | P-Value a | |
| Group A | ||||||
| PWC (1 - 4) | 0.900 ± 0.028 | 0.898 ± 0.024 | 0.793 | 0.901 ± 0.025 | 0.905 ± 0.027 | 0.622 |
| PWC (1 - 6) | 0.904 ± 0.027 | 0.901 ± 0.023 | 0.733 | 0.904 ± 0.024 | 0.900 ± 0.028 | 0.666 |
| PWC (4 - 6) | 0.903 ± 0.030 | 0.884 ± 0.028 | 0.036 | 0.916 ± 0.025 | 0.905 ± 0.025 | 0.173 |
| Group B | ||||||
| PWC (2 - 3) | 0.892 ± 0.025 | 0.898 ± 0.025 | 0.448 | 0.896 ± 0.024 | 0.900 ± 0.028 | 0.622 |
| PWC (2 - 5) | 0.890 ± 0.025 | 0.900 ± 0.020 | 0.138 | 0.883 ± 0.027 | 0.898 ± 0.031 | 0.113 |
| PWC (3 - 5) | 0.887 ± 0.020 | 0.898 ± 0.030 | 0.165 | 0.894 ± 0.026 | 0.895 ± 0.022 | 0.876 |
Pairwise Coherence Group (A) and Group (B) in CNSLBP Patients and Healthy Subjects During the Relaxation and Extension Phase
5. Discussion
This study attempted to compare the CNSLBP patients with healthy subjects in terms of phases of the F-ET through pool coherence and pairwise coherence of Bb-IMC. To the best of our knowledge, there is no study comparing the CNSLBP patients and healthy subjects group using Bb-IMC.
We calculated pool coherence (PC) and pairwise coherence (PWC) in this study and then considered the mean pool coherence (mPC) for group A (A mPC) and group B (B mPC) for four phases of F-ET using Bb-IMC in CNSLBP patients and healthy subjects. Besides, we calculated the mean pairwise coherence (mPWC) among each pair of group A (A mPWC) and group B (B mPWC) muscles for four phases of F-ET using Bb-IMC in CNSLBP patients and healthy subjects group.
Considering A mPC, the results of the general group (NSCLBP patients and healthy subjects) (Table 2), indicated that the A mPC had a high value in the flexion phase of F-ET which might lead to effective motor control and muscle recruitment in both NSCLBP patients and healthy subjects. These findings could be interpreted as the eccentric contraction of the lumbar spine (ES) muscles in combination with the eccentric contraction of the hamstrings and hip extensors that control trunk flexion (40, 41).
According to our findings, the A mPC increased only in the flexion phase in healthy subjects; however, the A mPC increased flexion, relaxation, and extension phases in CNSLBP patients. We suggest that the increased A mPC in CNSLBP in all phases of F-ET represents the hyperactivity in all muscles and the absence of passive contribution of the muscles in F-ET. In line with our findings, Riley et al. suggested that in more challenging balance conditions such as F-ET, LBP patients for compensating the proprioceptive deficits and due to pain distraction would prefer control from lower-level (such as increasing stiffness or by feedback gains increasing) (42). Concerning the B mPC, the B mPC in the general group (CNSLBP patients and healthy subjects) (Table 2) showed that the B mPC had a high value in the extension phase in the F-ET; and the B mPC in healthy subjects had a high value in the extension phase. However, the B mPC in CNSLBP patients showed a high value in extension, standing, and flexion phases. Active trunk stiffness (i.e., hyperactivity) seen in the CNSLBP patients could be attributed to the stabilizing trunk muscles co-contraction to make spinal stability (43) that, in turn, resulted in the reduction of dependence on feedback from proprioception (44). In other words, the patients might use trunk muscle co-contracting strategies or ''frozen'' postural strategy aimed at trunk stiffening and robustness, to protect the painful area (45, 46) and counter the mechanical perturbations (45, 47), due to resulted from proprioceptive deficits in NSCLBP. It is worthy of mentioning that the mechanical perpetuation, even in the absence of pain, could be due to fear or anticipation of pain and re-injury (42, 48).
In the inclusion criteria of this study, the Fear-Avoidance Beliefs questionnaire was 45 score of 96 that means the patients had a fear of pain. Thus, these psychological aspects of pain could lead to less variable or more rigid lumbopelvic muscles. Beilock et al. conducted a study and concluded that when a motor postural control task like standing and forward flexion had become automatic, the performance of the task could disrupt when centering attentiveness on that task (49). In other words, in patients, the added task or centering attentiveness on that task made the task even more challenging that could lead to an additional trunk stiffness, and consequently, the correlation between the trunk and pelvis movement had decreased and activations of the deep trunk muscles were delayed (50). It could be concluded that pain-related fear of movement and re-injury in LBP patients had increased the focus on the task and consequently increased the trunk stiffness (44, 51).
It is worth mentioning that our investigation had interesting results regarding the muscle groups A and B in flexion, extension, and relaxation phases as follow:
Flexion phase: The A mPC “1. 4. 6”, as a whole in three groups was higher than B mPC “2. 3. 5” in the flexion phase indicating that muscle group A worked more than group B to motor control.
Extension phase: As earlier, B mPC was higher than AmPC in three groups, which indicated that muscle group B had worked more than group A to attain motor control.
Relaxation phase: Our findings showed that the A mPC was more than B mPC in NSCLBP patients indicated that group A muscle was more effective in the relaxation phase (full flexion). Our data in the same study confirmed the same result by studying the FRP, whereas the results shown in (Table 3) conveyed that the right side was more effective; i.e. the absence of FRP was more significant in the right side than the left side.
However, there was a difference in the ANOVA test-between the groups in both muscles group A and muscles group B. We noticed there was a little difference (0.024) (P < 0.05) during the co-contraction of two sets of group A; as we detected the differences of 0.037 and 0.047 in healthy subjects and CNSLPB patients, respectively (P < 0.05). Regarding group B muscle, we noticed that when the results of the two groups were considered together, there was a slight difference (0.046), whereas no difference was observed in healthy subjects and patients. Besides, we found out that a slight difference (0.046) in group B (P < 0.05) when the two groups were considered together, however, no difference was observed in healthy subjects and patients alone (Table 4).
As it was mentioned in the results section, mPWC was compared among each pair of muscles group A and B for four phases of F-ET between NSCLBP patients and the healthy subjects group. A mPWC and B mPWC were not significantly different between NSCLBP patients and healthy subjects in all phases of F-ET (Tables 5 and 6). However, only A mPWC “1 - 4” and the A mPWC “4 - 6” were significantly smaller in NSCLBP patients compared to the healthy subjects in the relaxation phase and flexion phase, respectively. Therefore, using pool coherence of Bb-IMC would be recommended but not using the pairwise coherence of Bb-IMC to compare CNSLBP patients and healthy subjects.
Based on the current study, we suggest applying the Bb-IMC in the clinical assessment for CNSLBP patients. The Bb-IMC is a feasible, easy use, and highly safe for the patient with motor control impairments; besides, evaluation of the efficacy of treatment for these impairments is highly recommended.
It is worth noting that our study was limited to male participants; however, a previous study suggested that the Bb-IMC did not differ according to gender (12). Based on the test method, dominance and laterality of the assessed muscles had no effect on the results, but to make our study more accurate, all individuals were right-handed. And since that Bb-IMC was task-dependent (52). Flexion –extension task was utilized in our study between the following muscles: the right erector spinal muscle of the lumbar region “1”, left erector spinal muscle of the lumbar region “2”, right gluteus maximus muscle”3”, left gluteus maximus muscle”4”, right hamstring muscle”5” and left hamstring muscle”6”. Consequently, these results could not be generalized to other tasks and muscles. Therefore, future studies should be carried out in CNSLBP patients in other circumstances and functional tasks such as weight lifting should be taken into consideration.
5.1. Conclusions
Our study showed that pool coherence of Bb-IMC could clinically be used because of feasibility, ease of use, and high safety to assess the NSCLBP in F-ET. Thus, we recommend using pool coherence of Bb-IMC for further studies in other functional movements such as weight lifting.
