1. Background
Aquatic training has been used in many rehabilitation programs designed for different musculoskeletal injuries and diseases, including anterior cruciate ligament reconstruction (ACLR) (1). Due to the hydrostatic pressure and viscosity properties of water, proprioceptive training in an aquatic environment may be more beneficial than land-based training in achieving distinct sensory feedback (2). Although the popularity of aquatic training as an important component of rehabilitation following ACLR has increased recently, the effect of aquatic proprioceptive training on the improvement of motor control after ACLR has not been well-documented and completely understood (3).
The voluntary response index (VRI) is a surface electromyography (EMG) method that provides the quantitative analysis and recognition of primary EMG patterns in motor control during different activities (4). Voluntary response index consists of the magnitude (MAG) and similarity index (SI) of muscular electrical activity. Magnitude can be determined from the total electrical activity of all muscles during a task, and SI represents the similarity coefficient of EMG activity pattern in all muscles as compared to a prototype pattern that can be obtained from healthy subjects (4, 5). Voluntary response index indicates motor output changes occurring during the intervention, recovery, or progression of the central nervous system (CNS) and is an index with high reliability and validity when used as a measure of motor control to study muscle activation patterns and voluntary movement abnormalities (4-9).
2. Objectives
The objective of this study was to compare the effectiveness of innovative aquatic proprioceptive training plus conventional rehabilitation with conventional rehabilitation alone based on VRI components in athletes with ACLR. In our previous study (10), we investigated the effects of aquatic proprioceptive training only on knee proprioception, therefore in the present study, we intended to determine the possible effects of aquatic training on motor control changes.
3. Methods
The study design, participants, inclusion and exclusion criteria, and randomization method were similar to our previous study (10).
3.1. Intervention
The conventional rehabilitation protocol (11) was applied for all subjects from the first day after surgery to the seventh week. Then the subjects were randomly allocated into two groups. The conventional therapy (CT) group continued to receive conventional therapy (i.e., three sessions of 60 - 75 minutes per week for ten weeks) (11). The aquatic training group (hydrotherapy, HT) received three conventional rehabilitation sessions (60 - 75 minutes for ten weeks) plus two extra sessions per week of innovative aquatic proprioceptive training (60 - 75 minutes for ten weeks). The progression of the innovative aquatic proprioceptive training and the conventional exercises used in this protocol were similar to our previous study (10).
3.2. Data Collection and Analysis
Data were collected before and after the intervention. The subjects were asked to perform the functional task (sit-stand-sit), which was repeated three times within 30-second intervals. The EMG activities of five knee muscles, including the rectus femoris, vastus medialis, vastus lateralis, biceps femoris, and semitendinosus, were recorded during a sit-stand-sit task. The position of the electrodes was determined based on the instructions suggested in Surface EMG for non-invasive assessment of muscles (SENIAM) guidelines (12). Electrode sites on the skin were cleaned, and a portable 8-channel EMG system (DataLOG, Biometrics Ltd, UK) was applied. Bipolar electrodes with a fixed inter-electrode distance of 2 cm and a recording diameter of 1 cm were attached to the skin of the affected leg. The subject was placed on a chair in the starting position, with his back fully touching the back of the chair and maintaining the hip position with knees at 90° flexion. Next, the subject was instructed to stand up and accomplish the full standing up for five seconds and holding in this position for 10 seconds. Afterward, he was constructed to sit and accomplish the full sitting throughout five seconds and holding in this position for 10 seconds; this task was repeated three times. A metronome was used to monitor phase rhythms during the movement by producing a beep sound every second. The subjects were asked to stand on five beeps, stay in the standing position for ten beeps, return to the sitting position on five beeps, and stay in that position for ten beeps. They were also asked to maintain a steady pace throughout the task.
For data analysis, the functional task (sit-stand-sit) was divided into three phases: sit-to-stand (phase 1), standing (phase 2), and stand-to-sit (phase 3). Thereafter, the root mean square (RMS) was calculated for each muscle to obtain the response vector (RV) of that muscle. Next, prototype response vector (PRV) was calculated by placing the response vectors of five muscles into Equation 1, which represents the magnitude of all the muscles engaged in the functional task. Second, SI was calculated based on Equation 2 by comparing the activity distribution of ACLR muscles with the activity distribution of the same muscles in healthy subjects’ PRV profiles. Each subject’s RV was normalized with its magnitude (Equation 1) before the computing of SI (Equation 2) (4). Data were analyzed using the formulas mentioned for each phase of the functional task.
Where Ri is the response vector (RMS) for each muscle.
Statistical analysis was done using SPSS version 25. The level of statistical significance was set at 0.05 for all analyses.
4. Results
The anthropometric characteristics of the subjects in both groups were presented in Table 1. The results of the Independent t-test showed that there was no significant difference between the groups regarding the anthropometric characteristics (i.e., age, height, and weight) before the intervention (P > 0.05, Table 1). The normal distribution of variables was checked using the one-sample Kolmogorov-Smirnov test. All variables had a normal distribution; therefore, the paired t-test was used to determine the differences between the pre- and post-intervention phases. There were significant differences in MAG and SI in both groups at all phases of the functional task after the intervention (P < 0.05, Table 2).
| Group/Variables/Task | Pre-Intervention | Post-Intervention | Mean Difference | P-Value | Effect Size |
|---|---|---|---|---|---|
| CT | |||||
| MAG | |||||
| Sit to stand | 28.44 ± 13.90 | 48.4 ± 5.01 | 19.96 ± 8.89 | < 0.001 | 1.96 |
| Stand | 5.77 ± 2.14 | 12.47 ± 3.58 | 6.7 ± 1.44 | 0.005 | 2.33 |
| Stand to sit | 31.94 ± 14.85 | 46.02 ± 1.29 | 14.08 ± 13.56 | < 0.001 | 1.37 |
| SI | |||||
| Sit to stand | 0.17 ± 0.1 | 0.31 ± 0.16 | 0.14 ± 0.06 | 0.004 | 1.08 |
| Stand | 0.28 ± 0.14 | 0.39 ± 0.17 | 0.11 ± 0.03 | < 0.001 | 0.72 |
| Stand to sit | 0.20 ± 0.1 | 0.33 ± 0.08 | 0.13 ± 0.02 | 0.01 | 1.47 |
| HT | |||||
| MAG | |||||
| Sit to stand | 27.34 ± 14.85 | 65.3 ± 1.8 | 37.96 ± 13.05 | < 0.001 | 3.68 |
| Stand | 5.01 ± 1.98 | 21.36 ± 3.71 | 16.35 ± 1.73 | < 0.001 | 5.64 |
| Stand to sit | 32.74 ± 14.71 | 59.12 ± 5.41 | 26.38 ± 9.3 | < 0.001 | 2.44 |
| SI | |||||
| Sit to stand | 0.18 ± 0.14 | 0.49 ± 0.17 | 0.31 ± 0.03 | 0.03 | 2.04 |
| Stand | 0.27 ± 0.18 | 0.57 ± 0.9 | 0.3 ± 0.72 | < 0.001 | 0.47 |
| Stand to sit | 0.21 ± 0.06 | 0.48 ± 0.1 | 0.27 ± 0.04 | 0.002 | 3.36 |
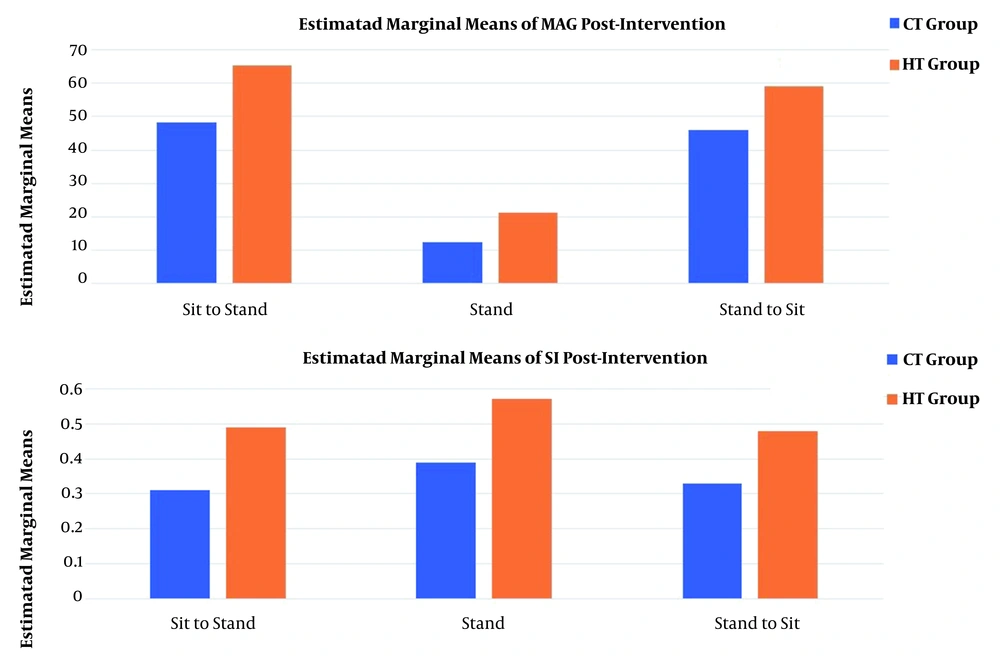
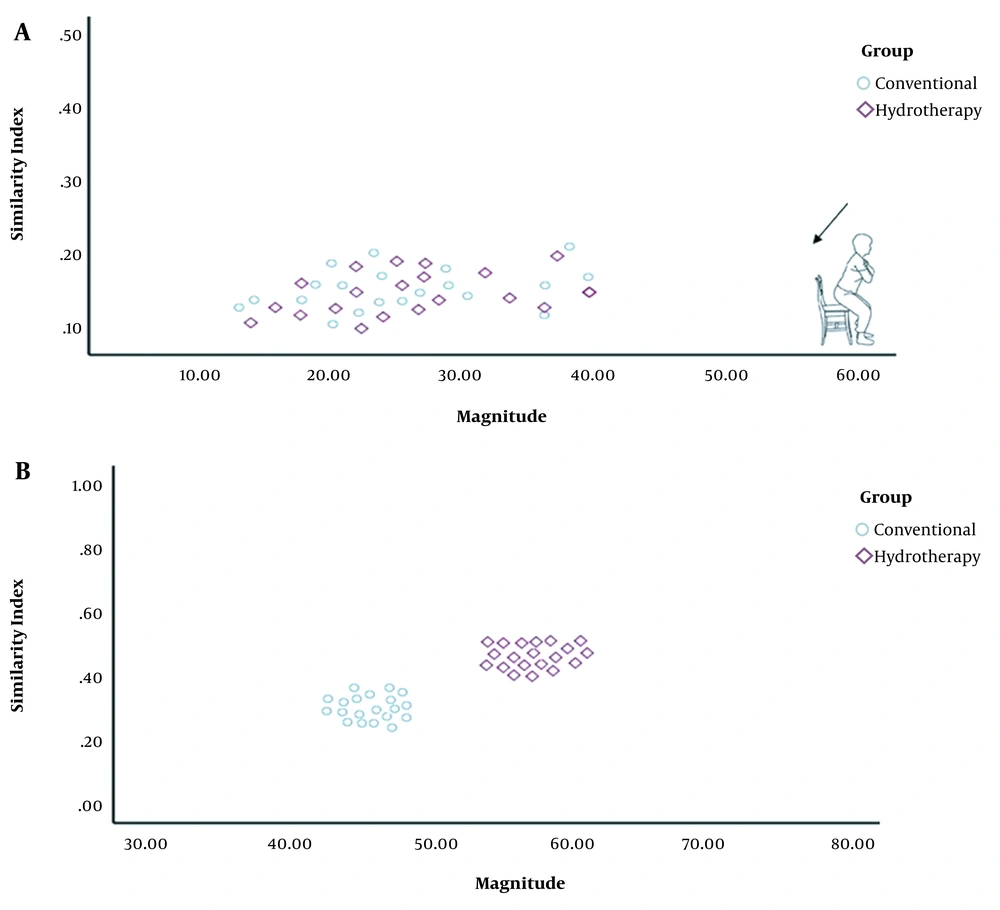
The results of MANOVA test showed that there were significant differences between the two groups in terms of MAG (Fsit-to-stand = 50.324, P = 0.003; Fstand = 48.634, P < 0.05; Fstand-to-sit = 52.841, P = 0.005) and SI (Fsit-to-stand = 31.854, P < 0.05; Fstand = 33.033, P = 0.007; and Fstand-to-sit = 31.645, P < 0.05) in all phases of the functional task (Table 3).
| Variables/Task | CT Group | HT Group | Mean Difference | F | P-Value | Effect Size |
|---|---|---|---|---|---|---|
| MAG | ||||||
| Sit to stand | 48.4 ± 5.01 | 65.3 ± 1.8 | 16.78 ± 3.21 | 50.324 | 0.003 | 4.61 |
| Stand | 12.47 ± 3.58 | 21.36 ± 3.71 | 8.89 ± 0.13 | 48.634 | < 0.001 | 2.5 |
| Stand to sit | 46.02 ± 1.29 | 59.12 ± 5.41 | 13.1 ± 4.12 | 52.841 | 0.005 | 3.42 |
| SI | ||||||
| Sit to stand | 0.31 ± 0.16 | 0.49 ± 0.17 | 0.18 ± 0.01 | 31.854 | < 0.001 | 1.12 |
| Stand | 0.39 ± 0.17 | 0.57 ± 0.9 | 0.18 ± 0.73 | 33.033 | 0.007 | 0.29 |
| Stand to sit | 0.33 ± 0 .08 | 0.48 ± 0.1 | 0.15 ± 0.02 | 31.645 | < 0.001 | 1.7 |
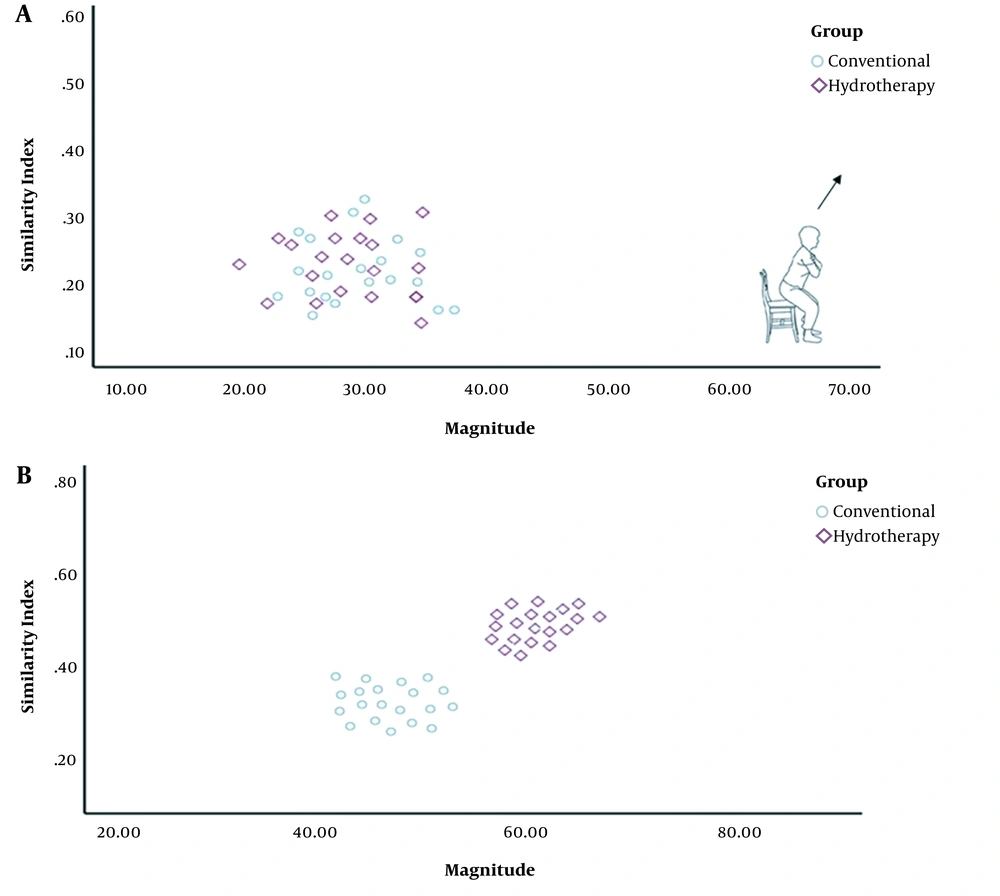
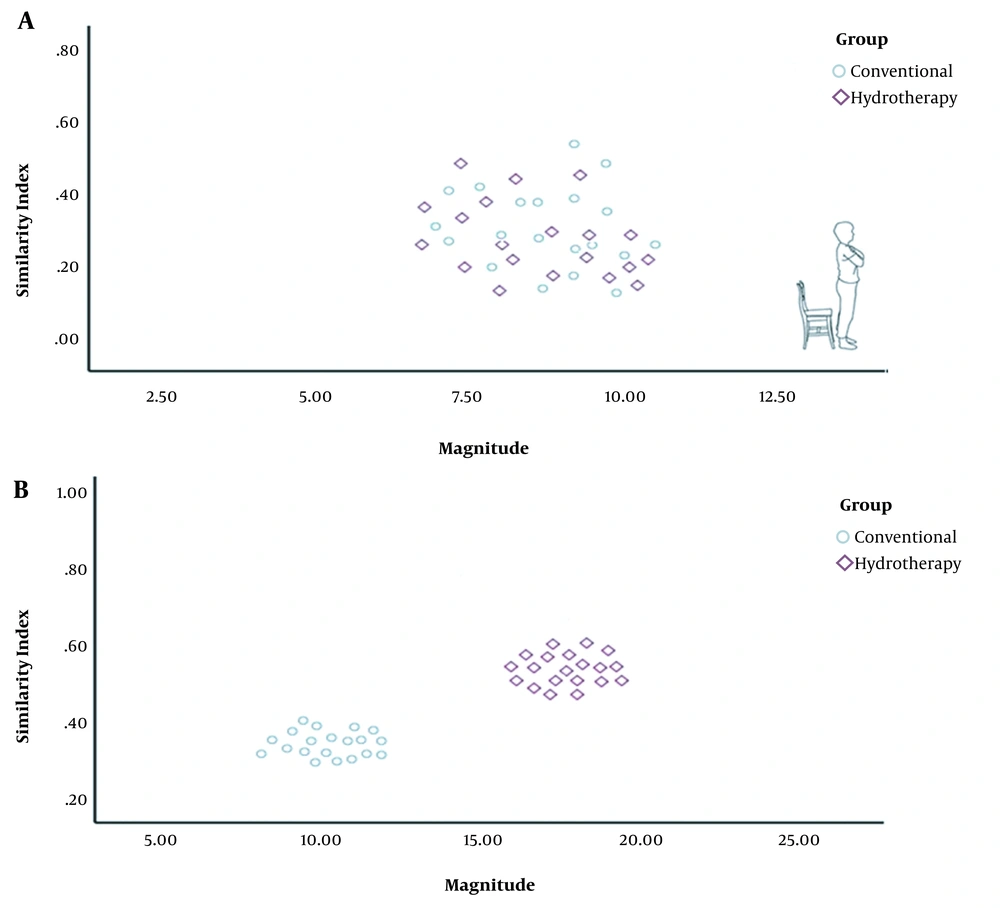
Changes in MAG and SI were significantly greater in all phases of the functional task in the HT group as compared to the CT group (Figure 1). The VRI values of both groups before and after the intervention, which represent changes in motor control and muscle activation patterns, have been shown in Figure 2 for the sit-to-stand task, in Figure 3 for the standing task, and in Figure 4 for the stand-to-sit task. Different values of SI and MAG of RV were observed in both groups after the intervention at different phases of the functional task.
5. Discussion
In the current study, the muscle coactivation patterns of the quadriceps/hamstring muscles were investigated using the VRI analysis. The main finding of this study was that the total electrical activity of all muscles during a task (MAG), as well as the similarity coefficient (SI) of the EMG activity pattern, significantly increased after the intervention at all phases of the functional task in both groups.
The increased MAG in the HT group at all phases suggested a huge/large effect occurring after the intervention, implying meaningful and relevant results. Clinically, the increased MAG in the HT group suggested the augmented coactivation of synergistic muscles due to changes in CNS motor output following the intervention. Likewise, an increase in the SI value of the HT group at all phases suggested the occurrence of a medium to large effect after the intervention, indicating a clinically meaningful observation. Again, the increased SI value of the HT group showed that RV during the task approached the typical distribution of EMG activities of PRV. It should be noted that a smaller SI implies a larger deviation of RV from the prototype response vector. A value of 1 for SI shows that RV has an identical distribution of EMG activities to PRV during a task (13). In other words, the EMG activity pattern of ACL-reconstructed patients in the HT group was close to that of healthy patients after the intervention. Therefore, the aquatic proprioceptive training induced CNS changes reflected in motor control alterations and muscle activation patterns.
Because there is no fixed resting position in the aquatic environment, this environment is always associated with muscles’ continual activation to retain stability. This stability is provided by the hydrostatic pressure, which acts as an external sensory stimulus, enhancing resistance to all active muscles. Consequently, body awareness would be more efficient and more functional, followed by the enhanced stimulation of proprioceptive muscles and increased activity of the sensory feedback (1, 14). For instance, in this study, standing on a foam roller created sensory information. Therefore, during the foam roller training, the patients had to maintain their balance, promoting neuromuscular coordination and proprioception efficiency, as reflected in motor control changes (15).
Because of the unique properties of the aquatic environment, several studies have used this type of environment for treating patients with ACLR (10, 16-20). Most of these studies have compared the effects of land-based therapy with hydrotherapy, using similar exercises. In the present study, we focused on aquatic proprioception exercises in addition to the conventional accelerated rehabilitation protocol. Accordingly, we were able to evaluate their possible effects on motor control and muscle activation patterns. However, no study used VRI analysis to assess possible motor control changes (10, 16, 17, 20). Due to the scarcity of evidence regarding the effects of proprioception training on VRI components in athletes with ACLR, especially in the aquatic environment, it was difficult to make a direct comparison with previous studies.
However, many studies have investigated CNS motor output changes during the progression of certain disorders (13, 21-24). For example, Cheng et al. conducted a study to investigate cervical EMG responses during head tasks in patients with neck pain. In their study, the flexor and extensor neck muscles’ activities were analyzed by VRI. They found altered EMG patterns (i.e., similar MAG, but smaller SI) in the patients as compared to healthy subjects during voluntary sagittal neck motions (13). Moreover, Kouhzad Mohammadi et al. used the VRI analysis of pronated feet to investigate changes in the activation patterns of lower extremity muscles. They found that changes in the muscle activation patterns of these patients were associated with differences in the activation of the muscles around the legs and knee joints (24). Also, Khaleghi et al. assessed changes in the reciprocal coactivation patterns of the quadriceps and hamstring muscles in individuals with patellofemoral pain syndrome using VRI and showed that the abnormal patterns of reciprocal coactivation around the knees were affected by motor control (21).
5.1. Conclusion
According to the results of the current study, innovative aquatic proprioceptive training could alter motor control via changing muscle activation patterns. The present findings highlighted the importance of designing special aquatic exercises to improve motor control rather than the casual performing of aquatic exercises. Moreover, clinicians can use the innovative aquatic proprioceptive training to increase coordination between muscles and promote proprioception in patients with ACLR.
