1. Context
Pain may be due to functional disorders or anatomical disorders. One of the causes of functional disorders is musculoskeletal disorders (MSDs) and injuries caused during work and activity. Musculoskeletal disorders are caused by physical activity that affects muscles, tendons, bones, and joints (1, 2). Musculoskeletal disorders differ in severity and include a wide range of disorders and complications, from mild to severe, chronic, and debilitating conditions (3).
Musculoskeletal diseases and the pain caused by it are the main cause of loss of work ability, which causes people to leave their jobs and reduce their financial security. So that the reduction of work ability, employment of a new employee, hospitalization of a person, and the need to perform diagnostic and treatment measures are among the economic pressures created on dentists. On the other hand, if there is Pain in dentists, it becomes difficult to provide proper service to patients, and as a result, satisfaction with dentists also decreases (4-6).
One of the medical professions that experience MSDs is dentists. The dental profession requires high concentration and accuracy for a long time and creates continuous and significant pressures on the body's organs (7). In fact, these complications are caused by the long-term and continuous use of dental devices in a limited environment, performing delicate tasks, and being in unfavorable body positions for long hours, which lead to the experience of pain in dentists (8, 9). Dentists experience pain in most parts of the body, including pain related to the spine (10).
Having information about spine injuries and conducting necessary investigations in this field can be effective in preventing chronic diseases (11). The cervical spine has a structure that is responsible for supporting and orienting the head in space and transmitting the force arising from the trunk (4, 12, 13). As a result of injuries caused to the spine, neck and back, it suffers damage (13, 14).
Back pain and neck pain are among the pain experienced by dentists that are caused by MSDs (15, 16). Back pain is one of the common health problems across all ages, which is the main cause of disability and absenteeism from work. Lower back pain (LBP) is one of the main reasons for patients to visit doctors, reasons for hospitalization, patient referrals, and the use of physiotherapy services for patients (5, 17, 18). Chronic neck pain has a prevalence between 16.7% and 75.1% and is considered one of the common causes of disability. On the other hand, due to the increase in the elderly population in Iran, the prevalence of neck and back pain is expected to rise (19).
2. Objectives
Considering the significance of identifying pain in patients, this meta-analysis study was conducted with the aim of determining the prevalence of back and neck pain in Iranian dentists.
3. Data Sources
This meta-analysis study was conducted based on the PARISMA checklist (20).
3.1. Inclusion and Exclusion Criteria
All articles published in Farsi and English that were conducted in the group of dentists and were published between the years 2000 and 2024 were included in the study. Articles that were published in the group of students or assistants or had incomplete data were excluded from the study.
3.2. Information Sources and Study Selection
In this meta-analysis study, which aimed to determine the prevalence of back and neck pain among dentists in Iran, all articles in the international and domestic databases of Iran, including Scopus, PubMed, EBSCO, ISI, SID, Magiran, ScienceDirect, and Iranmedx, were reviewed. The search was performed using keywords such as LBP, back pain, neck pain, pain, dentists, Iran, upper back pain (UBP), and low back pain.
3.3. Data Collection and Statistical Analysis
Two of the authors of the article (associate professor of periodontology and assistant professor of restorative dentistry) reviewed all the searched articles and extracted the related data. It should be noted that all the data were checked and confirmed by the third author of the articles (FF). After entering the data into the researcher-made checklist, data analysis was performed using CMA software.
4. Results
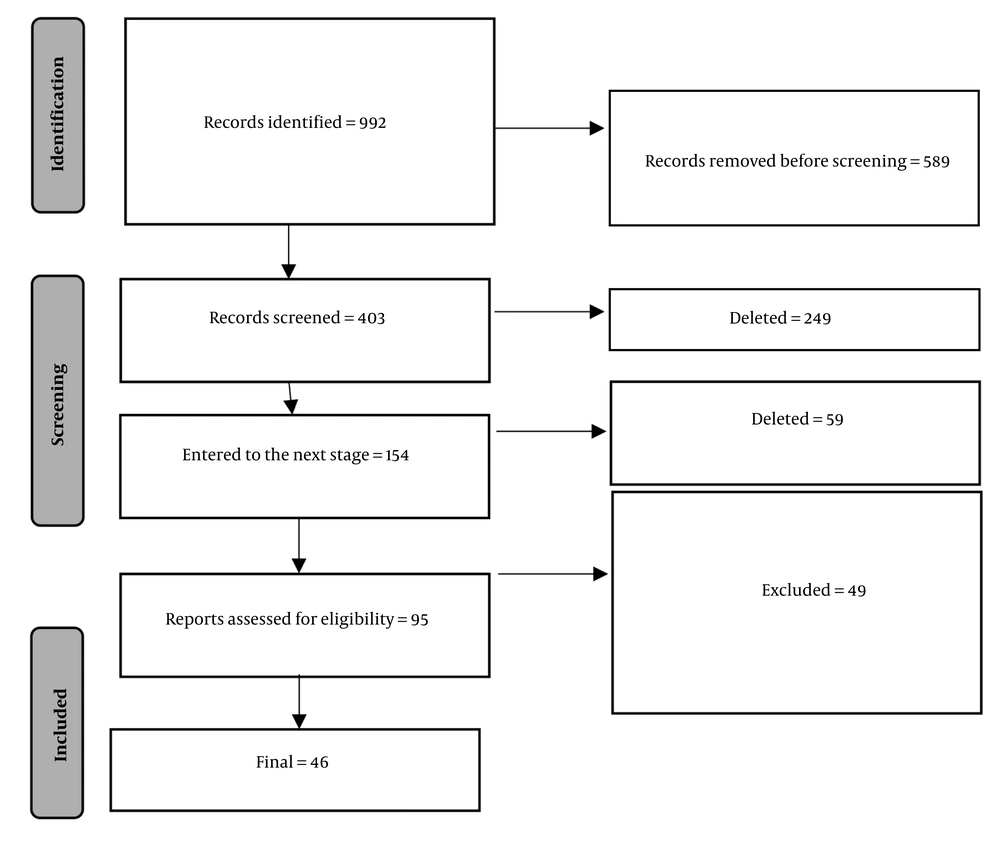
Results showed that initially 992 articles were extracted, of which 46 were removed during the preliminary search (Figure 1). After additional reviews and evaluations, 46 articles were analyzed (Table 1).
| Authors | Years | Place | Age | Questionnaire | N | Back | Upper Back | Lower Back | Neck |
|---|---|---|---|---|---|---|---|---|---|
| Pur Abbas et al. (21) | 2004 | Tabriz | - | VAS | 97 | 12 | - | - | 42.2 |
| Ezoddini et al. (22) | 2005 | Yazd | 36.61 (9.57) | VAS | 70 | - | - | - | 47.1 |
| Nasl Saraji et al. (23) | 2005 | Birjand | 36.70 | NMQ & REBA | 35 | 60 | - | - | 54 |
| Sarami et al. (24) | 2007 | Tehran | 36 (5.56) | NMQ & REBA | 47 | 46.8 | 51.1 | - | 83 |
| Kardani et al. (25) | 2007 | Ahvaz | - | Self-administered | 172 | - | - | - | 70 |
| Pargali and Jowkar (26) | 2010 | Shiraz | 37.70 (7.65) | Self-administered | 82 | 33 | - | - | 28 |
| Ahmadi Motemayel et al. (27) | 2012 | Hamedan | 39.02 (7.22) | NMQ | 71 | - | 23.9 | 16.9 | 49.7 |
| Chamani et al. (28) | 2012 | NMQ | 38.2 (7.5) | Kerman | 110 | - | 34 | 35 | 59 |
| Choobineh et al. (29) | 2012 | Shiraz | 39.01 (7.75) | NMQ | 160 | - | 49.2 | 45.8 | 55.9 |
| Rabiei et al. (30) | 2012 | Rasht | 39.1 (8.73) | NMQ & RULA | 92 | 35.8 | - | - | 43 |
| Varmazyar et al. (31) | 2012 | Qazvin | 28.38 (7.37) | NMQ & REBA | 63 | 42.9 | - | - | 50.8 |
| Aminian et al. (32) | 2012 | Tehran | 35.75 (8.35) | 210 | - | 51.3 | 55.5 | 66 | |
| Asgaripoor et al. (33) | 2013 | Semnan | 38.40 (7.1) | NMQ & REBA | 48 | 77.2 | - | - | 52.9 |
| Eyvazi et al. (34) | 2013 | Tabriz | 42.12 (8.99) | NMQ | 100 | 38 | - | - | 48 |
| Memarpour et al. (35) | 2013 | Shiraz | - | Painful disorders | 272 | - | 30.7 | 29.9 | 31.8 |
| Aminian et al. (36) | 2013 | Tehran | 43.19 (9.88) | Nordic | 261 | 54.8 | - | - | - |
| Rahmani et al. (37) | 2013 | Tehran | 41.30 (8.43) | VAS | 300 | - | - | - | 34.7 |
| Ebrahimian et al. (38) | 2014 | North-Khorasan | 41.17 | NMQ & REBA | 60 | 46.7 | - | - | 27 |
| Baroonizade et al. (39) | 2014 | Hamedan | 28.74 (2.74) | NMQ & LUBA | 30 | 43.3 | - | - | 63.3 |
| Ilbeigi et al. (40) | 2014 | Mashhad | 39.90 (9.7) | NMQ & RULA | 80 | 50 | 56.3 | ||
| Khayati et al. (41) | 2014 | Tehran | 41.65 (6.23) | VAS | 70 | - | - | - | 66.6 |
| Shadmehr et al. (42) | 2014 | Tehran | - | Nordic | 446 | - | 57 | 48.2 | 64.4 |
| Rafie et al. (43) | 2015 | Kerman | - | NMQ | 130 | 32.5 | - | - | 55.9 |
| Nadri et al. (44) | 2015 | Tehran | 38.2 (7.1) | VAS | 150 | - | - | 34.5 | 50 |
| Rahnamaye Tamrooiy et al. (45) | 2015 | Tehran | - | NMQ & RULA | 92 | 55.4 | -- | 78.3 | |
| Tirgar et al. (46) | 2015 | - | 43.85 (6.64) | NMQ & RULA | 60 | - | 40 | - | 83.3 |
| Jalili Nasab et al. (47) | 2016 | Qazvin | 38.8 (7.9) | Nordic | 50 | - | 10 | 16 | 24 |
| Seifi et al. (48) | 2016 | Babol | 38.16 (7.43) | NMQ | 64 | - | - | - | 41 |
| Nokhostin and Zafarmand (49) | 2016 | - | 42.18 (9.59) | Self-administered | 600 | - | - | - | 51.87 |
| Zahedpasha et al. (50) | 2016 | Isfahan | 37.8 (8.3) | Nordic | 116 | 43.1 | - | - | 56.9 |
| Koosha et al. (51) | 2016 | Tehran | 38.28 (6.76) | NMQ & RULA | 100 | 58 | - | - | 60 |
| Mohseni-Bandpei et al. (52) | 2017 | Tehran | 41.30 (8.43) | VAS | 300 | 31.4 | - | - | - |
| Aliakbari et al. (53) | 2018 | Bojnourd | - | Nordic | 63 | 50.8 | - | - | 47.6 |
| Shirinbak et al. (54) | 2018 | Zanjan | 37.1 | Nordic | 120 | 24.2 | - | - | 20.8 |
| Yazdanian et al. (55) | 2018 | Tehran | 40.83 (8.2) | Nordic | 66 | - | 49 | 44 | 66 |
| Hosseini et al. (56) | 2019 | Shiraz | 35.6 (8.7) | NMQ | 136 | - | 61.6 | 35.3 | 37.5 |
| Nadri et al. (44) | 2019 | Tehran | 38.7 (6.6) | VAS | 84 | 44.9 | - | - | - |
| Khandan et al. (57) | 2020 | Qom | 40.06 (9.53) | BPAI | 51 | - | 45.5 | 34.1 | 72.7 |
| Karapor et al. (58) | 2020 | Ilam | 39.22 (5.53) | Nordic | 18 | 77.8 | - | - | 66.7 |
| Shahraki Ebrahimi et al. (59) | 2021 | Zahedan | 37.6 (8.9) | Nordic | 102 | 72.5 | - | - | 77.5 |
| Hadadi et al. (60) | 2021 | Bojnourd | 38.32 (6.32) | Nordic | 28 | 50 | - | - | 71.4 |
| Koochak Dezfouli et al. (61) | 2022 | Sari | 43.47 (7.78) | Nordic | 90 | - | 22.2 | 24.4 | 43.3 |
| Hosseini and Roshani (62) | 2023 | Urmia | 41.6 (28.51) | Nordic | 76 | 35 | - | - | 53 |
| Roozegar et al. (63) | 2023 | Ilam | 26.36 (10.77) | Nordic | 53 | 43.4 | - | - | 52.8 |
| Rahbar et al. (64) | 2023 | Ahwaz | 30.41 (6.22) | Nordic | 152 | - | 59.2 | 53.3 | 71.1 |
| Nasiri et al. (65) | 2015 | Rasht | - | Nordic | 99 | - | - | - | 98.8 |
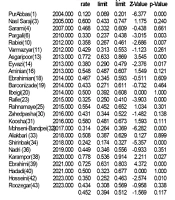
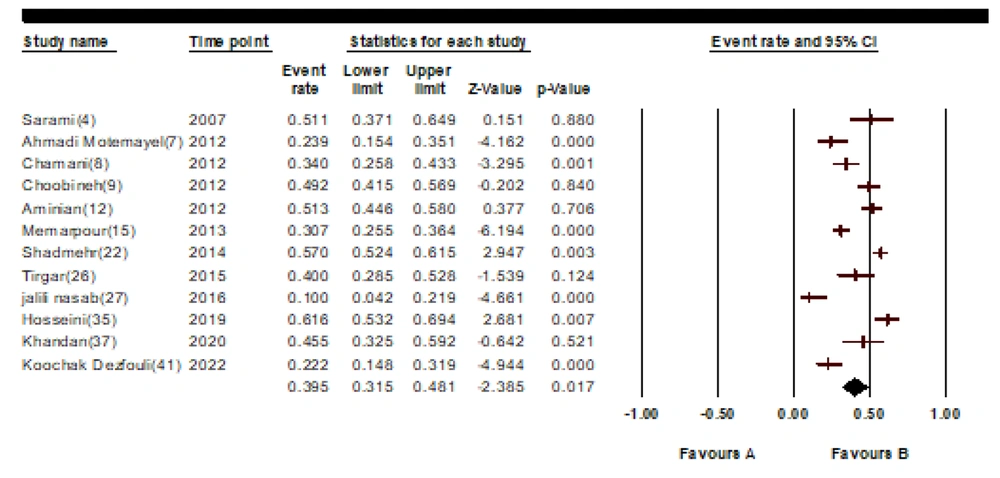
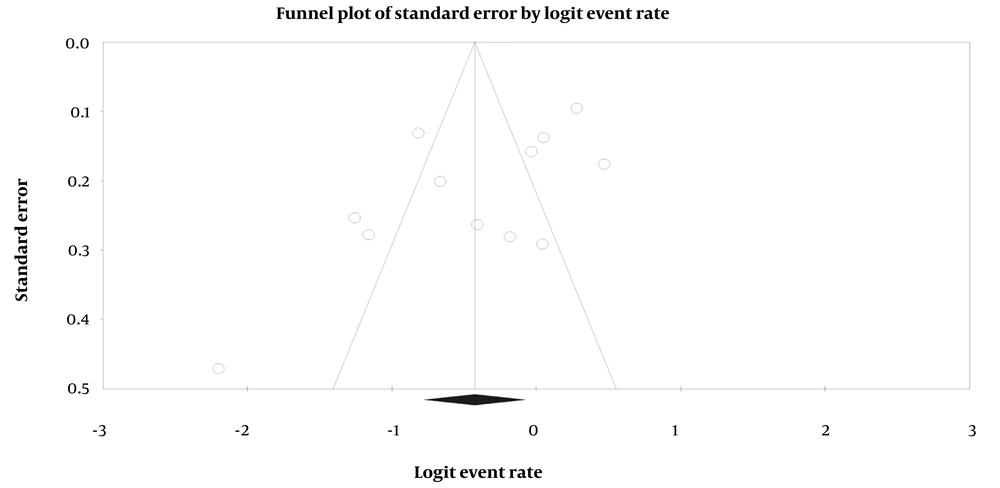
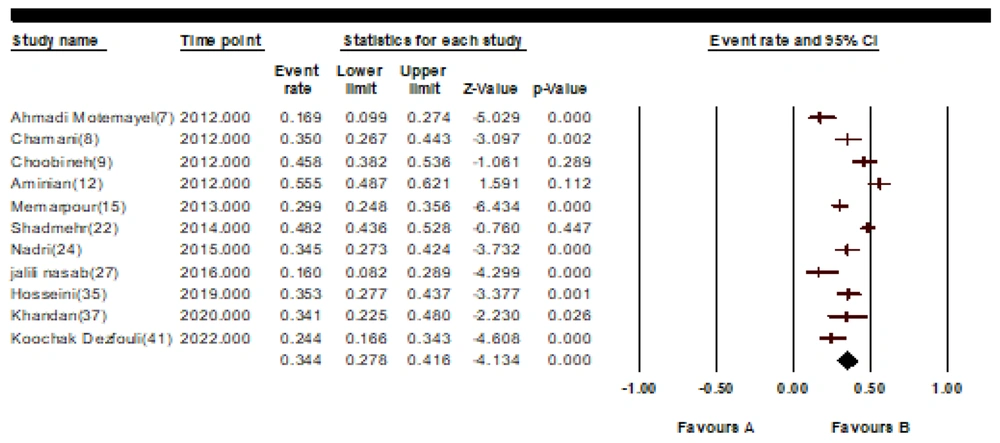
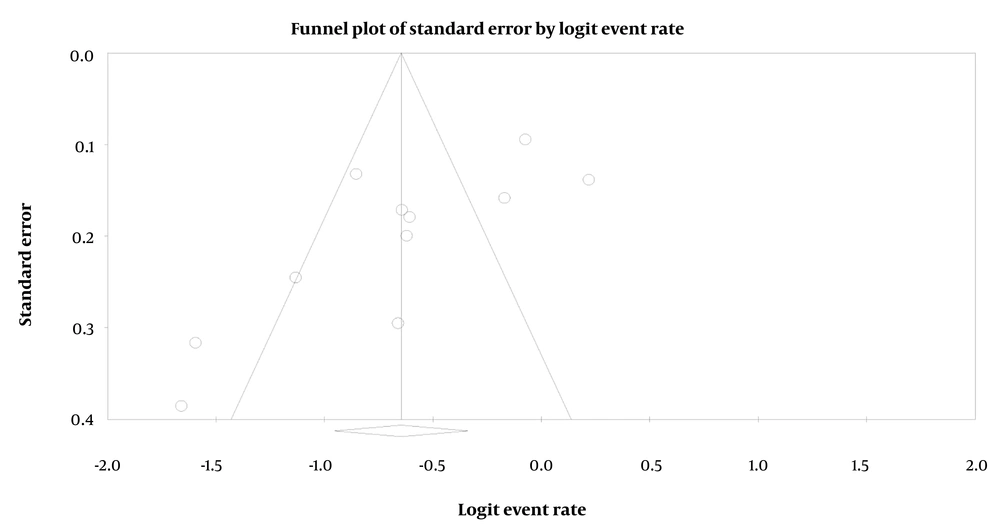
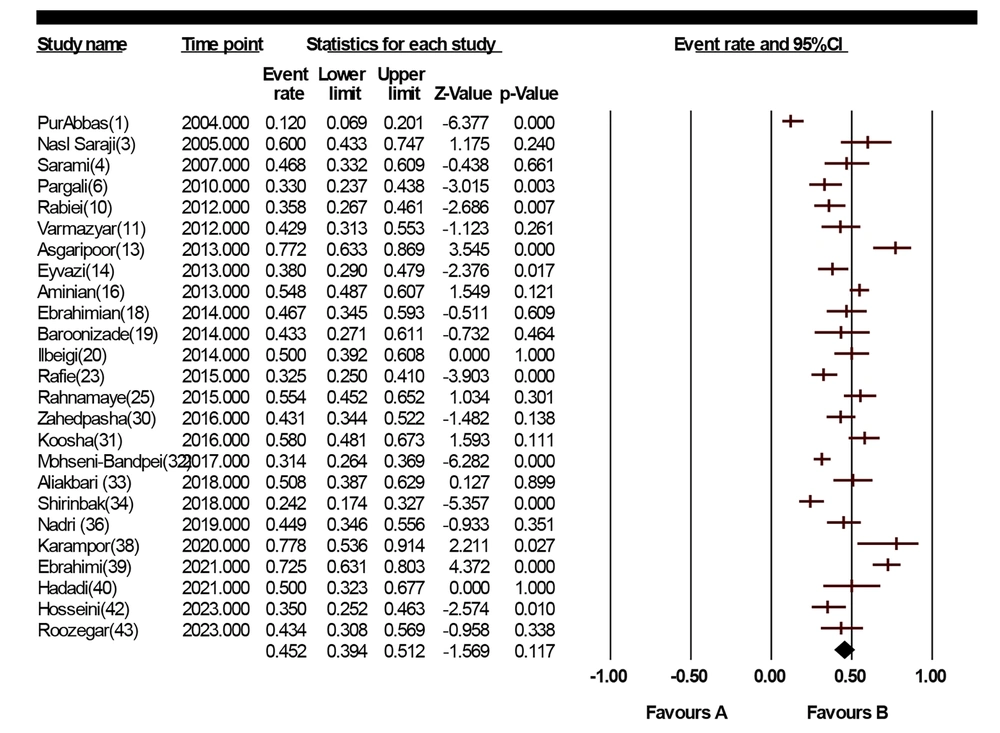
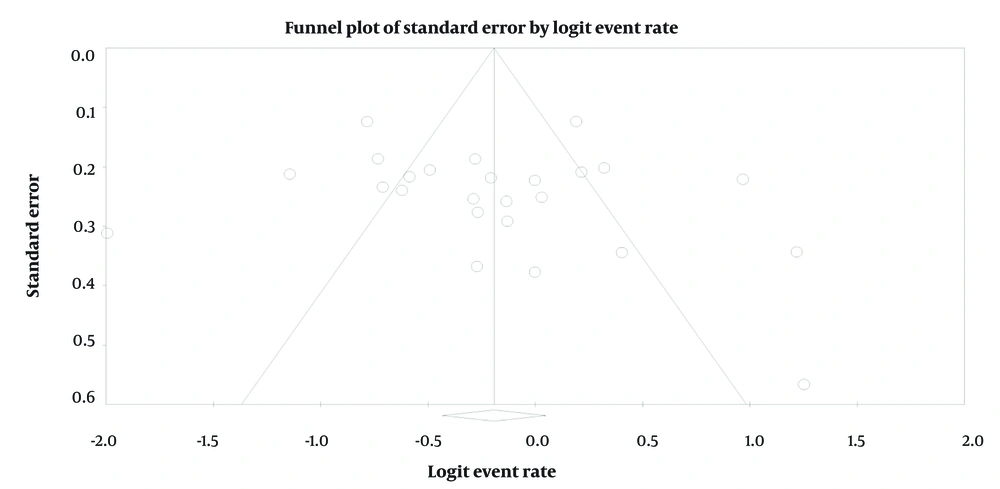
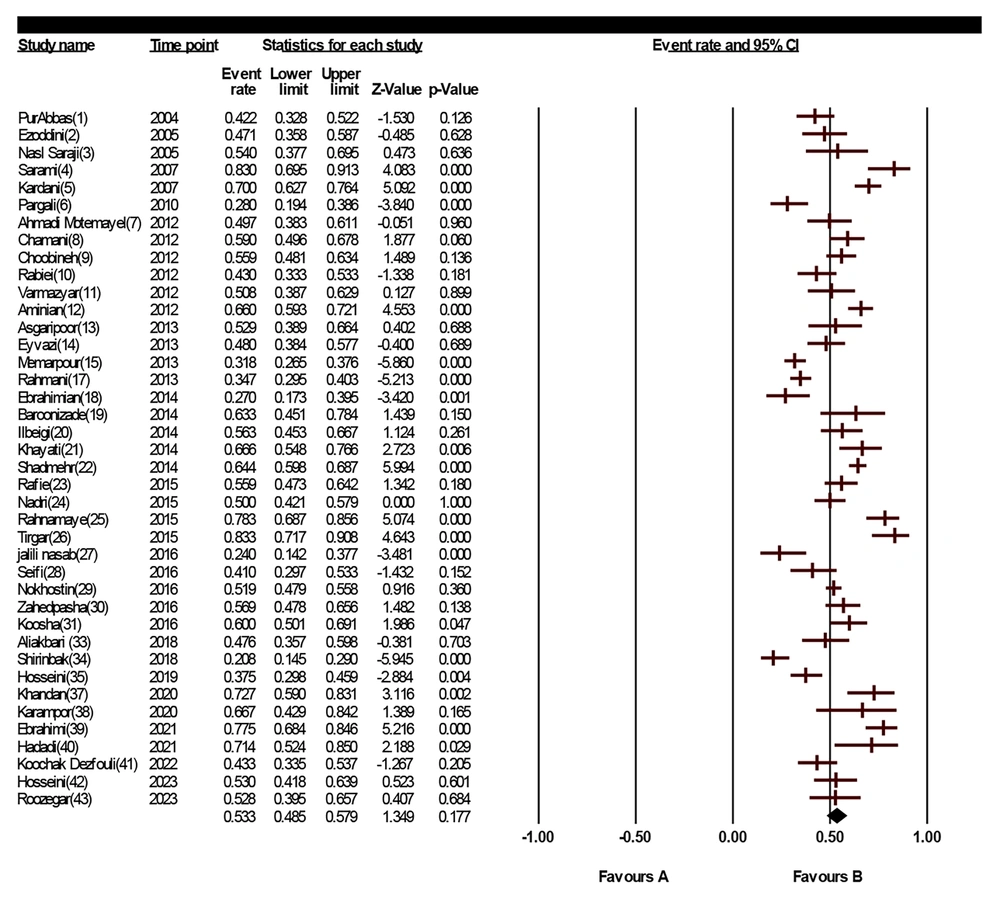
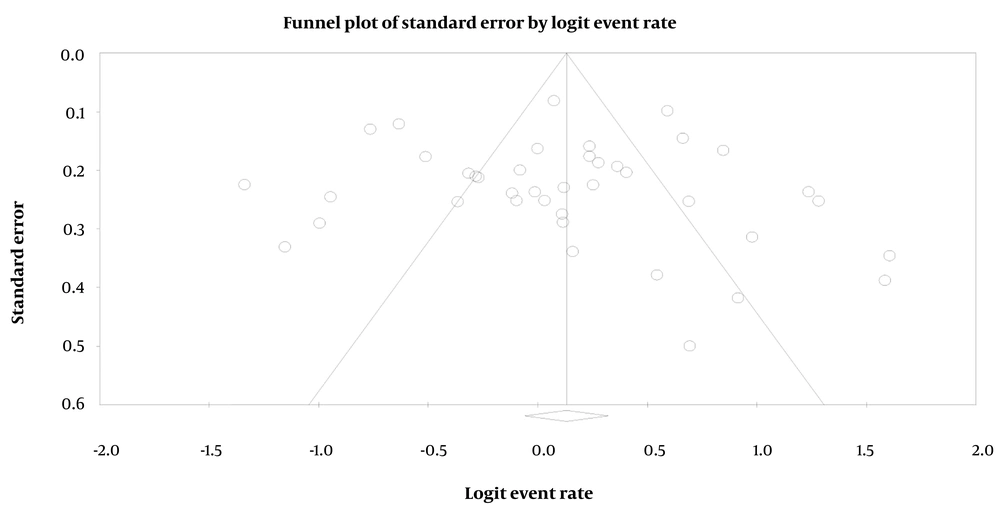
The results indicated that the prevalence of neck pain in Iranian dentists was 53.3% [CI = 48.5 - 57.9], the Prevalence of back pain was 45.2% [CI = 39.4 - 51.2], the prevalence of UBP in the last 12 months was 39.5% [CI = 31.5 - 48.1], and the prevalence of LBP was 34.4% [CI = 27.8 - 41.6] (Figures 2 - 9).
7. Discussion
Pain causes various complications, including disability and reduced life expectancy for patients. For this reason, it is important to identify the prevalence of pain (5, 17, 18, 66). In this study, the prevalence of neck pain in Iranian dentists was 53.3% [CI = 48.5 - 57.9]. In the study of Ohlendorf et al., the prevalence of neck pain related to the last 12 months in 204 Brazilian dentists was 55.4% (67). In the study of Rehan et al. in 270 Pakistani dentists, it was 23% (68), and in Shekhawat's study et al., neck pain was reported as 5.6% "always" and 55% "sometimes" (69). Paying attention to the prevalence of neck pain in dentists and implementing preventive and therapeutic interventions to address it is very important and necessary (70, 71).
Results showed that the prevalence of back pain was 45.2% [CI = 39.4 - 51.2]. In the study of Al-Mohrej et al., conducted on 204 Saudi Arabian dentists (103 men and 101 women), the Prevalence of LBP was 68.1% (72). In the study of Gaowgzeh et al., involving 60 dentists with an average age of 25.7 years, the prevalence of LBP was 70%, with 9.5% of dentists reporting it at an extreme level (73). Similarly, in the study by Ohlendorf et al. on qualified dental assistants, results showed that 86.9% of the surveyed individuals reported back pain (74).
Results showed that the prevalence of UBP in the last 12 months was 39.5% [CI = 31.5 - 48.1], and the prevalence of LBP was 34.4% [CI = 27.8 - 41.6]. In the study of Ohlendorf et al., conducted on 450 German dentists (163 men and 287 women), the prevalence of UBP was 33.3%, and the prevalence of LBP was 45.8% (67). In the study by Akesson et al., among dentists, the prevalence of UBP was 53%, and the prevalence of LBP was 49% (75). In the study by Kumar et al., involving 646 dentists in India, the prevalence of UBP was 18.65%, and the Prevalence of LBP was 72.01% (76).
The strengths of this study include its novelty and the reporting of the status of back pain and neck pain in dentists in Iran. One of the weaknesses of this study is the failure to report all types of pain in dentists. For this reason, it is recommended that another study be conducted to investigate the prevalence of other musculoskeletal pain in dentists.
5.1. Conclusions
Considering the high prevalence of neck pain and back pain among dentists in Iran, it is necessary to implement preventive measures to reduce neck and back pain in this professional group.
