1. Background
Gliomas are the most common type of primary brain tumors. According to WHO grading pipeline based on molecular feature, gliomas classify to 4 grades in two categorized types of low grades (I and II) known as benign and high-grades (III & IV), which are considered malignant glioma (1). Maximum surgical resection is a first-line treatment particularly for high-grade gliomas (2). Whole tumor removal is not achievable due to lesion size, location, and proximity to functional regions of the brain. In this regard, the detection of tumor residue after surgical resection is related to patient’s survival (3, 4). Consequently, it affects post operation (post-op) decision of re-resection or planning an efficient treatment procedure (5). Conventional MR imaging is commonly used for detection of tumor burden. Among many imaging features, contrast-enhanced lesion strongly translated to the tumor and mostly is considered high-grade glioma (6). Surprisingly, one-third of high-grade gliomas are non-progressing (7) and in such cases, T2 weighted hyperintensity is used for identification of the tumor. Hypersignal area on T2 images is a candidate for a mixture of tumor and peripheral edematous tissue (8); thus conventional MR imaging features are not so good practice to indicate a residual tumor. Then, it is needed to apply advanced imaging techniques such as molecular spectroscopic imaging, which is critical for tumor evaluation after surgery. Indeed, MRS is a window to brain biochemistry in vivo (9). It has been confirmed that the alteration in metabolite concentrations such as Cho, Cr, NAA, and also their relative values, including Cho/NAA and Cho/Cr are strongly correlated with the pathology of the tumor (10). In addition to MRS-guided tumor grading (11), it is administered as an indicator for tumor extent (12).
2. Objectives
The aim of this study was to evaluate MRS-based finding a residual tumor by different thresholds of Cho/NAA and Cho/Cr in comparison to MR imaging features of T1 weighted contrast enhancement or T2 weighted images after tumor resection to investigate the extent to which the metabolic-based definition of the tumor differs from MRI-based definition of the tumor.
3. Methods
3.1. Patients
Eighteen adult patients with glioma mean age 35 ± 3.1 years (mean ± SD) after near-total or subtotal tumor resection were included in the study. Four patients had a stereotactic biopsy. All subjects had been recently diagnosed with glioma and had no prior head surgery, radiotherapy, or chemotherapy. Demographic characteristics of the patients are shown in Table 1. This study was approved by the local Ethics Committee of the Tehran University of Medical Sciences. Written informed consent was obtained from all patients for participating in this study and using their imaging data.
| Subjects | Age/Sex | Type of Tumor | Tumor Location |
|---|---|---|---|
| 1 | 33/M | Grade III (without CE) | L frontal |
| 2 | 26/M | Grade III (without CE) | R frontal insular |
| 3 | 64/F | Grade III (without CE) | Bi frontal |
| 4 | 24/M | Grade IV (without CE) | R frontal insular |
| 5 | 44/M | Grade IV | R frontal |
| 6 | 18/M | Grade II (without CE) | L frontal |
| 7 | 37/M | Grade II (without CE) | L frontal |
| 8 | 56/F | Grade III (without CE) | R frontal |
| 9 | 48/M | Grade II (without CE) | L frontal |
| 10 | 29/M | Grade IV (without CE) | L insular parietal |
| 11 | 22/F | Grade II (without CE) | R parietal |
| 12 | 31/M | Grade IV | R temporal |
| 13 | 50/M | Grade IV | L insula |
| 14 | 27/M | Grade II (without CE) | R parietal |
| 15 | 40/M | Grade II (without CE) | R insula |
| 16 | 38/M | Grade II (without CE) | L temporal |
| 17 | 46/M | Grade IV | L temporal |
| 18 | 56/M | Grade IV | L frontal insular |
Abbreviations: CE, contrast enhancement; L, left; R, right.
3.2. Imaging Protocol
MRIs and MRSIs were obtained (1.5 T GE Optima; General Electric Medical Systems) 2 - 4 days after surgery. Conventional brain MRI sequences consisted of axial T2 (TR/TE = 4224/99.92, FOV =230 × 230 × 256 mm3 ), and axial FLAIR (TR/TE = 522/9.6, FOV = 250 × 250 × 192 mm3 ). Then post-gadolinium axial T1 (TR/TE = 480/10 ms, FOV = 250 × 250 × 192 mm3), sagittal T1 (TR/TE = 440/10, FOV = 280 × 280 × 192 mm3), and coronal T1 (TR/TE = 522/9.6, FOV = 260 × 260 × 224 mm3 ) were performed as reference images for MRSI.
MRSI was acquired using chemical shift selective (CHESS) water suppression sequence and a point-resolved spectroscopy sequence (PRESS) by Proton Brain Exam-Spectroscopic Imaging (PROBE/SI) protocol with TR/TE of 1000/144 ms and a voxel size of 12.5 × 12.5 × 15 mm3, FOV 200 × 200 mm2, and phase encoding matrix size 16 × 16. The volume of interest (VOI) was positioned to include the largest T1 contrast enhancement or T2 hyperintense lesion, peritumoral region, and normal contralateral brain. Six saturation bands were located near the VOI to eliminate signals outside the VOI.
3.3. MRSI Analysis
Raw data were analyzed using TARQUIN software package (version 4.3.10) (13). Data were fitted to a predefined basis set of Cho, NAA, and Cr. Excel sheet containing an arbitrary concentration of metabolites, voxel positioning, and quality of spectra for each voxel were exported after advanced analyses. Relative concentration for Cho/NAA and Cho/Cr achieved by dividing the value of Cho to NAA and Cr in the same voxel.
3.4. ROI Based Analysis
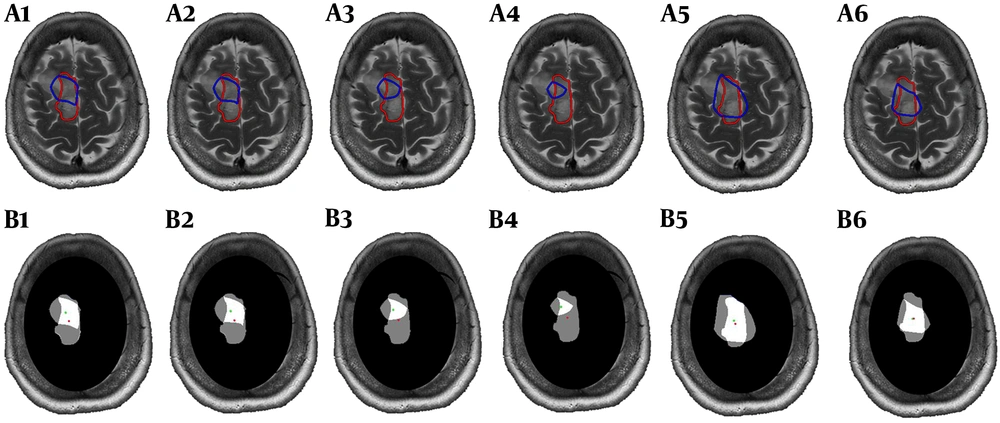
Interpolated metabolic map exported from the relative metabolites was superimposed on post-contrast T1 or T2 weighted images using a script on MATLAB (The MathWorks, Inc., 2018a), then metabolic ROI by four different thresholds of Cho/NAA (> 1.7, 1.8, 2 and 2.2) and two thresholds of Cho/Cr (> 1.5 and 2) were determined (Figure 1, Blue lines). ROI of residual tumor (ROI-t) was manually defined by the free segmentation software of ITK-SNAP (version 3.4.0, www.itksnap.org) (14) on the same section of MRS VOI based on imaging features and approved by a neuro-radiologist (Figure 1, Red lines). Mask of the different metabolic ROIs with selected thresholds and ROI-t was shown in Figure 1, B. Since the VOI of MRS did not cover the entire lesion, we ignored the area of residual tumor outside the VOI. For further analyses, the area of each metabolic ROI for various thresholds and ROI-t, as well as overlapped areas, were calculated. To evaluate the similarity between ROIs, we calculated the dice coefficient between different metabolic ROI and ROI-t. The displacement between metabolic and imaging ROI was obtained throughout the distance of the center of the two ROIs.
3.5. Statistical Analysis
Data were analyzed using GraphPad Prism software (version 8.0.0 for Windows, GraphPad software, La Jolla California USA, www.graphpad.com). After using the normality test of Shapiro-Wilk and approving the normal distribution of data, analysis of variance (ANOVA) with post-hoc of Tukey were performed to compare the mean area of metabolic ROIs and ROI-t as well as an average of dice coefficient by the significance level of P < 0.05.
4. Results
Obtained data revealed that among 18 post operation glioma patients, 10 patients had no contrast enhancement lesion and 6 of them had high-grade glioma.
The mean values of dice coefficient between ROI-t and different thresholds of Cho/NAA and Cho/Cr are shown in Table 2. The uppermost similarity has been found between Cho/NAA > 1.7 and ROI-t. There were no significant changes between different thresholds of metabolic ROIs. The measured distance between ROI-t and metabolic ROIs centers was provided in Table 2. The minimum displacement was seen in the mean of distance between the center of metabolic ROI defining by Cho/NAA > 1.7 and center of ROI-t.
| Metabolic Ratios | Cho/NAA > 1.7 | Cho/NAA > 1.8 | Cho/NAA > 2 | Cho/NAA > 2.2 | Cho/Cr > 1.5 | Cho/Cr > 2 |
|---|---|---|---|---|---|---|
| Dice coefficient | 0.54 ± 0.19 | 0.46 ± 0.20 | 0.38 ± 0.24 | 0.38 ± 0.24 | 0.41 ± 0.19 | 0.35 ± 0.22 |
| Distance from ROI-t, mm | 9.70 ± 4.8 | 9.78 ± 4.9 | 10.2 ± 5.1 | 10.5 ± 5.2 | 13.5 ± 6.9 | 13 ± 8.1 |
aValues are expressed as mean ± SD.
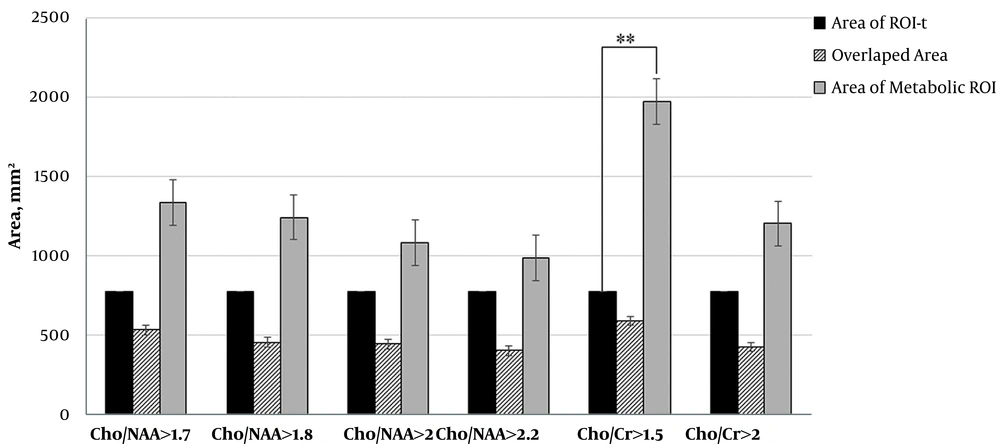
We calculated the area of ROI-t and all metabolic ROI. The area of Cho/NAA > 1.7 and > 1.8 in ten patients were greater than ROI-t. The results also showed that in 9 patients, the area of Cho/NAA by thresholds of > 2 and > 2.2 was greater than ROI-t. The data that are illustrated in Figure 2 demonstrate the reduction in the mean values of the Cho/NAA area by increasing in the threshold.
In all patients, the area of Cho/Cr > 1.5 was greater than ROI-t and in 10 patients the area of Cho/Cr with a cut of value 2 was greater than ROI-t. The area of ROI Cho/Cr > 1.5 had a significant difference with the area of ROI-t (P = 0.01). The data are illustrated in Figure 2.
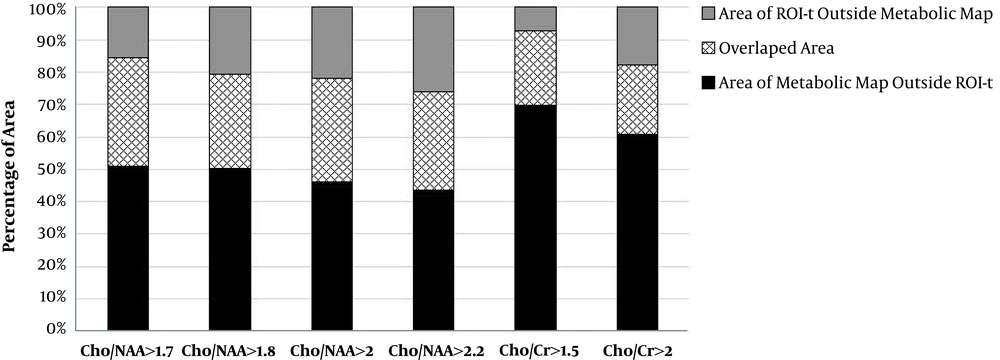
In addition, we evaluated the percentage area of each metabolic ROIs in all patients which extent to ROI-t. The mean of extent areas for Cho/NAA > 1.7, > 1.8, >2 and > 2.2 were 51%, 53%, 48% and 49%, respectively. Averaged extent of Cho/Cr > 1.5 over the ROI-t was 70% and for Cho/Cr > 2 was 66%. The data is shown on Figure 3.
5. Discussion
The present study showed that the conventional MRI features are not proper for tumor detection and the MRS imaging findings via metabolic mapping of Cho/NAA and Cho/Cr could address the tumor burden differently by location.
The presence of tumor residue after surgery is an undeniable fact, which is related to the location, size, and the misdiagnosed of tumor burden due to insufficient imaging findings (15). Obviously, the volume of the residual tumor is related to the treatment outcome and patient’s survival (16, 17). We performed MRS imaging on glioma patients after tumor resection and our findings in agreement with those aforesaid reports (18, 19), which showed the difference of location for metabolic ROI beyond to imaging ROI. Gliomas and particularly high-grade gliomas show complex imaging features of necrosis, cyst, and edema (20). The contrast-enhanced area is one of the imaging features, which belongs to the tumor presence and it is a well-known indicator of blood-brain-barrier (BBB) disruption (21). It is reported that one-third of the high-grade gliomas are non-enhancing or even in the gliomas with a transformation character to high-grade there was no obvious enhancement (7, 22). In addition, the low-grade gliomas also considered as non-enhancing tumors and the heterogenic hypersignal areas on T2 weighted images were defined as a tumor (23). Using the multimodal metabolic and functional imaging, it has been illustrated that the sensitivity and predictive value of conventional MR imaging features are not strong enough in glioma detecting and grading (24).
Current results have considered that there are differences between the location of metabolic ROIs and anatomic ROI-t. Cho/NAA and Cho/Cr are the most applicable metabolic ratios for detecting tumor location (25, 26). Previous MRS studies in the association of histopathological findings of glioma have demonstrated the dissimilarity between the location of metabolic and imaging features (19, 27). However, , the regions with cut of value more than 2 are considered indicators for tumor regarding Cho/NAA ratio (28) and the maximum sensitivity have been reported for Cho/NAA > 2 in detection of tumor from non-tumor tissue (29); however, there are some studies suggesting the cut of value > 1.7 for detection of tumor (30). In the present study, we compared the ROI of the four most-stated thresholds of Cho/NAA and two thresholds for Cho/Cr with the ROI-t defined by conventional imaging. The small dice coefficient has revealed there are differences in the location of metabolic and anatomic ROIs. In addition, we confirmed this finding by estimation of the distance between the centers of ROIs. However, the comparison between multiple thresholds indicated that the maximum similarity and leaning on that the minimum distance belonged to Cho/NAA > 1.7. By the elevation of Cho/NAA ratio, we observed that the distance between the centers of ROIs increased from 9.7 to 10.5 millimeter. In addition to increasing Cho/NAA ratio, the area of ROI was reduced. This might be confirmed that the metabolically active tumor is not in correlation with the contrast-enhanced or T2 hypersignal as reported in the previous investigation, which found regions with high Cho/NAA that located outside non-enhancing T2-hyperintense area (27). The results of Cho/Cr map was also indicated the location displacement between ROI-t and metabolic defined ROI, which is in accordance with Cho/NAA map and the maximum similarity was for Cho/Cr > 1.5. Nevertheless, in contrast to Cho/NAA, the maximum distance was also found for the aforementioned ratio of Cho/Cr (> 1.5). Therefore, the current results demonstrated that the metabolically active tumor area differs in the location that was obtained by imaging features.
Gliomas and particularly high-grade ones are heterogeneous and have a mixture of complications such as necrosis, gliosis, enhanced and non-enhanced T2 hyperintensity (31). We observed high-grade subjects, which had no contrast-enhanced area after surgery; however, they had hyperintensity on T2 images. Also, these subjects had abnormal areas in metabolic mapping, which is an indicator of the residual tumor. Certainly, it could not be able to define an accurate threshold for Cho/NAA for tumor delineation and it is because of low spatial resolution of MRS imaging. Altogether, based on our findings, it could be suggested that the Cho/NAA > 1.7 is a safer threshold for tumor burden definition.
5.1. Conclusions
Applying of MRS mapping in the post-operation gliomas is a proper approach for detecting a residual tumor in contrast to conventional MR imaging feature. Consequently, in line with non-enhancing tumors, the metabolically active tumor area could be detected using MRS. In suggestion; we proposed that it is efficient to define more precise metabolic maps for voxels that have the same metabolic thresholds of Cho/NAA. This may be able to demonstrate the heterogeneity of post-operated regions of the residual tumor, peripheral edematous area meanwhile indicating normal appearance for following treatment proceedings.

.jpg)
.jpg)


