1. Background
Despite advances in diagnosis, diarrheagenic diseases remain one of the most important agents contributing to morbidity and mortality (1). Children under 5 years are particularly susceptible to diarrheagenic diseases, which are among the leading causes of death (2). Among the diarrhoeagenic disease the bacterial agent has a major role. Escherichia coli specially cause most of death in the infants. Escherichia coli can be divided into pathogenic and non-pathogenic types, and identification of each pathogenic type can be of great importance (3). Diarrhoeagenic E. coli can be categorized into pathogenic groups based on the presence of specific genes (4). Identifying each pathotype is important for treatment, investigation of antibiotic resistance, and defining the specific burden of illness (5). Biochemical tests and culture methods are only able to identify E. coli in general and cannot differentiate between pathogenic and non-pathogenic types (6). In addition, enumerating E. coli cells from diarrheal samples using culture methods and biochemical tests is time-consuming and laborious. Therefore, the use of molecular methods can reduce the time needed for diagnosis (7).
Enterotoxigenic Escherichia coli (ETEC) causes one of the most significant illnesses in children living in developing countries. Enterotoxigenic Escherichia coli can lead to watery diarrhea, ranging from mild to cholera-like illness (8). Contaminated food is one of the major ways ETEC is transmitted. Foods that come from animals can transmit bacterial pathogens to humans and cause disease. ETEC is responsible for causing domestic foodborne diarrhea as well as traveler’s diarrhea (9).
Polymerase chain reaction (PCR) is a powerful method utilized to identify E. coli. However, it cannot determine the number of bacteria present in the sample. This problem can be resolved by using quantitative real-time polymerase chain reaction (qPCR), which detects desired DNA by monitoring the proliferation of the target gene. The target gene was investigated in real-time by fluorescence (10). Real-time PCR can be used for the detection of single nucleotide polymorphisms, genotyping, gene expression, and quick detection of pathogens in the sample (11). However, one limitation of this method is that it cannot differentiate between DNA extracted from dead and live bacteria. As a result, real-time PCR amplifies the extracted DNA independently of its source, which can lead to misdiagnosis. Free DNA from dead cells can persist for days to weeks, even in the presence of chloroform, which can be problematic for amplification-based techniques (12, 13).
Propidium monoazide (PMA) is a viability dye that enters compromised cells and binds to DNA. Due to its positive charge, PMA cannot penetrate cells with intact membranes. Each PMA molecule attaches to 4 - 5 nucleotides and, when exposed to light, converts the azide group to a nitrene radical. Nitrene radicals bind to any carbon moiety and organic molecule nearby, inhibiting PCR amplification. In other words, the azide group forms an irreversible nitrogen-carbon bond that prevents DNA amplification (14, 15). By inhibiting DNA in dead or injured cells, qPCR treated with PMA results in higher threshold cycles (Ct) compared to qPCR alone. This is because PMA removes DNA from dead cells, resulting in a higher Ct value (14).
Combining PMA treatment with specific identification of the ETEC lt gene enables rapid identification and quantification of viable ETEC bacteria.
2. Objectives
This study is of the explanatory type because it compares a new method with conventional methods.
This study aims to quantify the number of live bacteria present in samples of pediatric diarrhea in Iran. This investigation represents the first attempt to determine the quantity of live bacteria present in such samples.
3. Methods
3.1. Sample Collection
A total of 138 samples were collected from the Children’s Medical Center of Tehran, Iran.
Stool specimens were swabbed and cultured on MacConkey agar. Pink colonies were then selected and subjected to biochemical tests, including the indole test. Following overnight culturing, colonies suspected to be E. coli were isolated and confirmed using PCR.
3.2. Colony Count
Standard plate counting was performed in the following manner. A total of 10 tubes were filled with 9 mL of sterilized peptone water and orderly labeled as 10-1, to, -10-10. One mL of the sample was added to tube 10-1 and then, 1 mL was transferred from tube 10-1 to tube 10-2. Serial dilutions were performed on the sample, and 1 mL of the diluted sample was discarded from tube 10-10. Next, 0.1 mL of each tube was transferred to a petri dish, and approximately 18 mL of plate count agar (PCA) was added and mixed with the sample before being allowed to solidify at room temperature. The Petri dish was incubated for 24 hours at 37°C, and the colony count was recorded (16). The colony count was determined using the following formula:
3.3. Screening for the Presence of Escherichia coli in the Sample
After colonies have been identified through chemical tests, such as the indole test, they are confirmed through PCR. DNA extraction is performed on purified bacteria cultured in Tryptic Soy Broth (TSB) using a DNA extraction kit, specifically the Allprep DNA minikit (Qiagen, Inc.). The primers utilized in this investigation for identifying the uidA gene in E. coli, which encodes the β-glucuronidase enzyme, were obtained from a previous study (Table 1) (17).
| Gene and Type of Primer | Sequence | Annealing Temperature | Product Size |
|---|---|---|---|
| uidA | 503 bp | ||
| Forward | GCGTCTGTTGACTGGCAGGTGGTGG | 53 | |
| Reverse | GTTGCCCGCTTCGAAACCAATGCCT | 53 |
Primers Used in This Study
All PCR reactions were carried out using a Bioer PCR system (Life ECO). The reaction mix comprised of 12 μL of 2X master mix containing 3 mM/L MgCl2, 0.4 mM/L dNTPs, 1X PCR buffer, and 0.08 IU Taq DNA polymerase, 1 μL of each forward and reverse primer, 1 μL of the DNA template, and distilled water to achieve a final volume of 25 μL. The PCR cycling conditions consisted of an initial denaturation step at 95°C for 5 min, followed by 35 cycles of denaturation at 94°C for 50 s, annealing at 61°C for 30 s, and extension at 72°C for 50 s. The final extension was held at 72°C for 10 min after the last cycle. The PCR product was analyzed by running it on a 1% agarose gel stained with DNA safe stain (Sina Clon Co., IRAN). Samples that tested positive for E. coli were further subjected to serial dilution, DNA extraction, and qPCR analysis with and without PMA treatment.
3.4. Generation of Sample Define Live and Dead Cells
The clinical sample-derived E. coli was cultured in Luria-Bertani (LB) broth at 37°C for 24 hours. Serial dilutions of 1 mL of culture ranging from 10-1 to 10-10 were prepared, and each dilution was centrifuged, resuspended in PBS, and aliquoted into microtubes. To differentiate between live and dead bacteria, it was necessary to artificially produce samples. One method to achieve this is by using thermal treatment, which was carried out using the Weibull frequency distribution method (18).
The microtubes were heated using a water-bath at 90°C for 15 minutes. Subsequently, no colonies were produced on the plate colony count agar (19). A sample was taken from the microtube every minute during the process and cultured on nutrient agar. Boiling the sample at 90°C for 1 to 5 minutes revealed a serial reduction in the dilution of live bacteria in the first 4 minutes, and complete eradication was observed at minute 5.
One mL of duplicate serial dilutions ranging from 10 to 10-10 were mixed with 102 copies of dead bacteria. Each sample was then centrifuged at 15,000 rpm for 10 minutes.
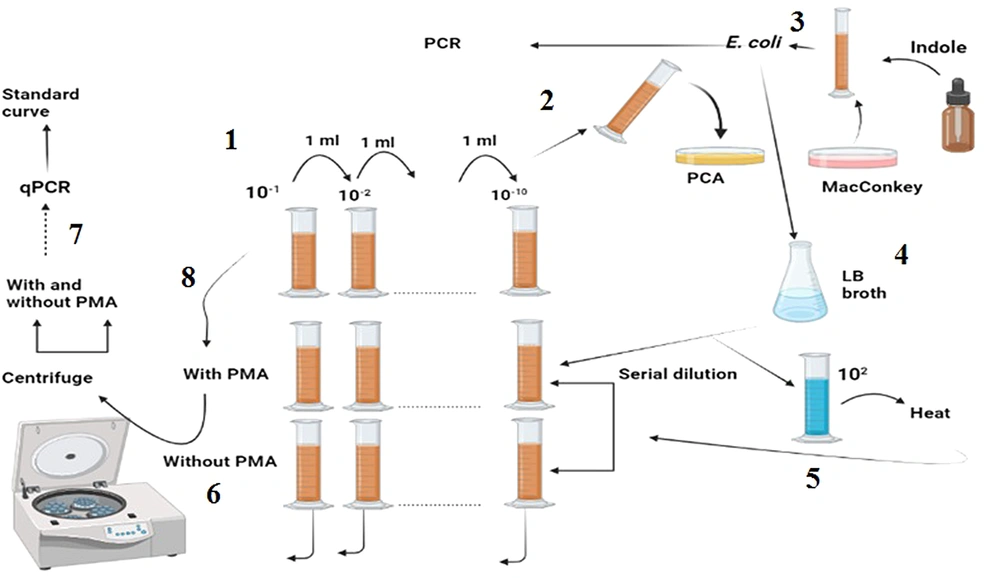
As shown in Figure 1: (1) The stool sample was subjected to serial dilution; and (2) each dilution was cultured using the pour-plate method, and the resulting colonies were counted; (3) a colony resembling E. coli was selected and confirmed via the indole test and used for DNA isolation; (4) the confirmed colony was grown in LB broth and subjected to serial dilution; (5) a constant concentration of 102 was added to all the dilutions; (6) one dilution series was treated with PMA, while the other was left blank; (7) both series were analyzed using qPCR after centrifugation and DNA extraction; (8) finally, the sample was treated with and without PMA, centrifuged, and analyzed after DNA extraction.
(1) The stool sample was subjected to serial dilution, and (2) Each dilution was cultured using the pour-plate method, and the resulting colonies were counted. (3) A colony resembling E. coli was selected and confirmed via the indole test and used for DNA isolation. (4) The confirmed colony was grown in LB broth and subjected to serial dilution. (5) A constant concentration of 102 was added to all the dilutions. (6) One dilution series was treated with PMA, while the other was left blank. (7) Both series were analyzed using qPCR after centrifugation and DNA extraction. (8) Finally, the sample was treated with and without PMA, centrifuged, and analyzed after DNA extraction.
After centrifugation, one of the microtubes was treated with PMA, while the other was left untreated. DNA was extracted from both microtubes, and qPCR was subsequently performed, as described later. The clinical sample was treated with and without PMA, centrifuged, and used for DNA extraction and qPCR.
3.5. The Effect of Propidium Monoazide on the Sample
The sample was diluted with Ringer’s solution and centrifuged at 15000 rpm for 15 minutes. The supernatant was removed, and a bacterial pellet was isolated for further steps. Each sample yielded two pellets, one containing PMA and the other serving as a control.
Propidium monoazide was dissolved in 20% dimethyl sulfoxide (DMSO) to prepare a 20 mM stock solution, which can be stored at -20°C in the dark. Then, 2.5 μL of PMA was added to 1 mL of the sample to yield a final concentration of 50 μM (19).
The bacterial pellet was mixed with PMA and gently shacked for 5 minutes in the dark. Next, the mixture was exposed to a 650 W halogenated light for 10 minutes at an approximate distance of 15 cm. After the light exposure, the bacteria-PMA mixture was centrifuged at 7000 rpm for 10 minutes, and the resulting pellet was used for DNA extraction (20, 21).
3.6. Generating a Standard Curve and Determining Its Sensitivity
To investigate qPCR for the detection of E. coli, the bacterial samples from the previous step were subjected to 10-fold serial dilution and centrifuged, and the resulting pellet was used for DNA extraction. Real-time PCR was performed using the StepOnePlus® instrument. A primer pair and probe targeting the lt gene were designed by Ram et al. (11) and are listed in Table 2.
| Gene and Type of Primer | Sequence | Tm |
|---|---|---|
| lt | ||
| Forward | TTATAGCGACAGCACCAAATATG | 55 |
| Reverse | CACGATACCATCCATATATCTGAG | 55 |
| Probe | TTCCACTAACGCAGAAACCTCCT | 62 |
Primers and Probe Used for Quantitative Real-time PCR (qPCR)
The reaction mixture consisted of ready-to-use master mix (2X), containing reaction buffer, deoxynucleotide triphosphate, and Taq DNA polymerase to a volume of 12.5 μL, DNA template 2 μL, forward and reverse primers at 1 μL each, probe at 0.5 μL, and distilled water to a final volume of 25 μL. Amplification was carried out with a program consisting of initial denaturation at 95°C for 180 seconds, followed by 40 cycles at 95°C for 20 seconds, 52°C for 30 seconds, and 72°C for 30 seconds. A mixture of PCR reagents, excluding DNA template, was used as a negative control. A sample was considered positive if the fluorescent signal increased within 40 cycles. The probe was labeled with the quencher dye, 6-carboxytetramethylrhodamine (TAMRA), and the reporter dye, 6-carboxyfluorescein (FAM).
3.7. Specificity
The primer and probe sequences were first screened using the BLAST program in the NCBI database, and subsequently experimentally tested against negative control strains such as Staphylococcus aureus and Salmonella enterica.
3.8. Intra-assay Calculation
A DNA serial dilution ranging from 10-1 to 10-9 was prepared and analyzed in real-time as a triplex. Intra-assay accuracy, which refers to the precision of the qPCR method in determining the concentration of repeated measurements, was determined by calculating the mean and standard deviation (SD) of the differences between each repetition.
3.9. Statistical Analysis
qPCR and qPCR + PMA data sets were analyzed using Wilcoxon test.
4. Result
4.1. Screening for the Presence of Escherichia coli in the Samples
All 54 isolates obtained from the investigated sample were identified as E. coli, and the presence of a 500-bp uidA band was detected in all of them.
4.2. Standard Curves and Limits of Detection
Standard curves were generated from a 10-1 to 10-10 serial dilution of DNA, which was extracted and examined by qPCR. The increase in Ct values in relation to the dilution was found to be linear and correlated with the reduction in colony count. The initial dilution had a low Ct value of 11, which increased with further dilution, and became undetectable at a dilution of 10-11. The limit of detection in this study was found to be 8 CFU/mL.
4.3. Sensitivity, Specificity, and Propidium Monoazide Effectiveness
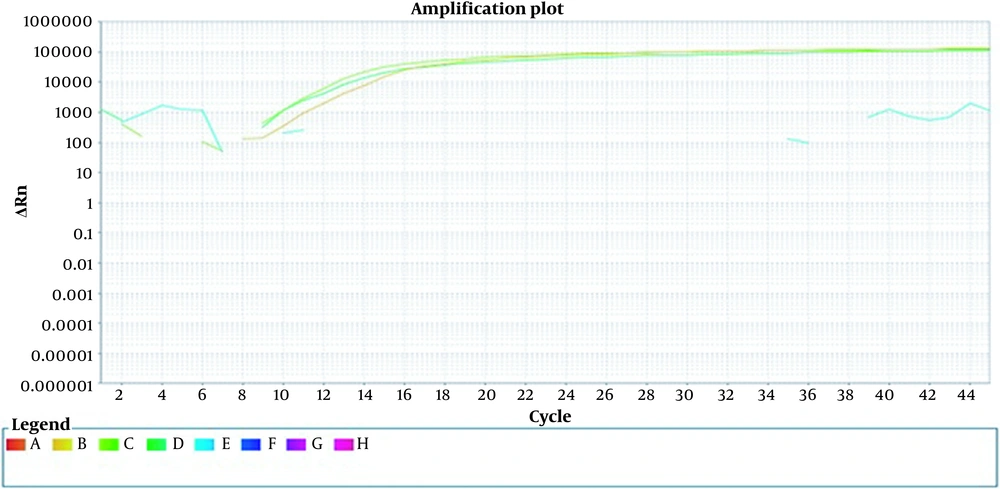
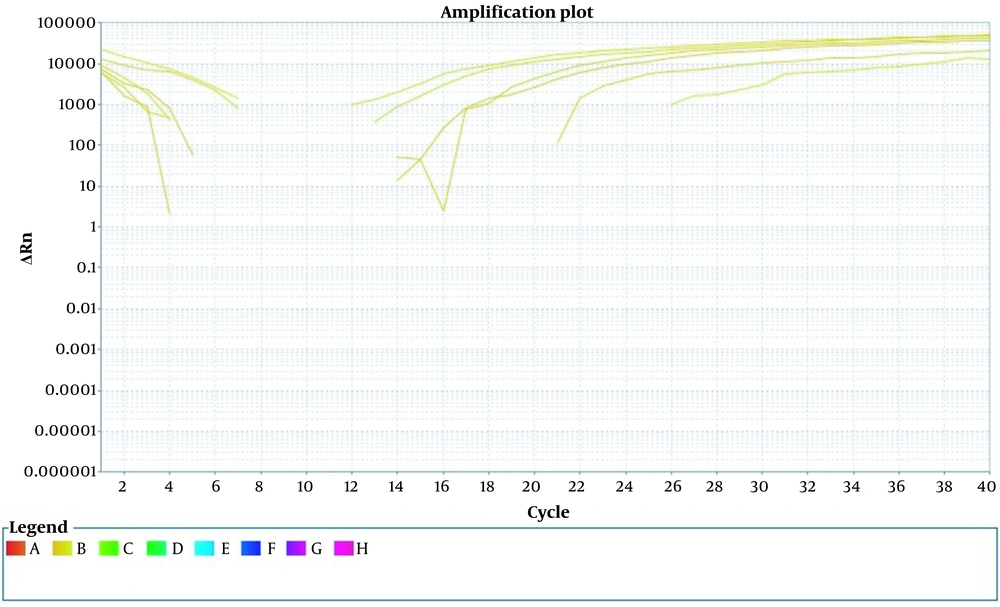
To ensure the specificity of the primer, non-specific bacteria such as Staphylococcus and Salmonella were examined. No signal was detected in the DNA extracted from these bacteria, indicating the primer’s specificity for detecting E. coli. Additionally, the coefficient of variation (CV) of Ct values was assessed by serially diluting the positive control. The intra-assay reproducibility was confirmed with a CV of less than 6% (Figure 2).
Internally repeatable measurement. A sample of constant concentration is replicated three times. At the same time and in the same run, a constant concentration of DNA was performed in the form of triple samples. Orange, deep green, and light green colors represent three microtubes with a constant concentration.
After being mixed with a constant 102 copy number of dead bacteria, two series of dilutions were prepared. One series was treated with PMA, while the other was not. DNA was extracted from both series and analyzed using qPCR. The results indicated that the samples treated with PMA exhibited an increase in Ct values, indicating a decrease in the amount of primary DNA. This decrease is likely due to the removal of free DNA introduced by the 102 copy number.
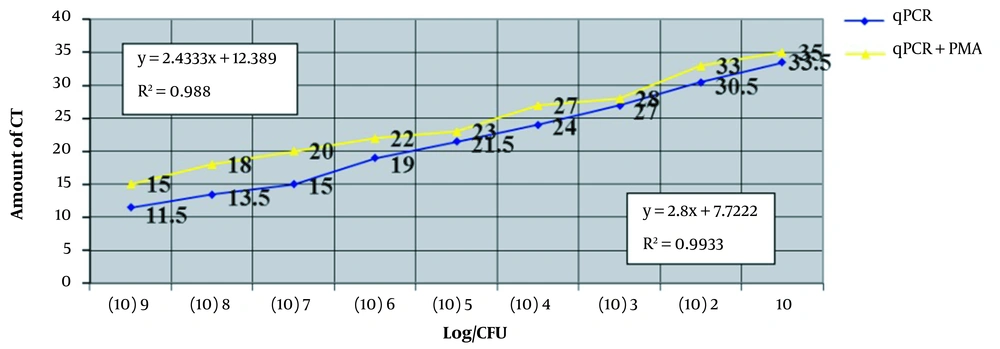
The results indicate that in the dilutions that were not treated with PMA, the Ct values for the 10-1 and 10-2 dilutions were 11.5 and 13.5, respectively (Figure 3). The Ct values continued to increase, and by the 10-10 dilution, the threshold was undetectable . These results closely match those of the standard curve. Additional results are presented in Table 3.
Investigating serial concentrations of bacteria and the relationship between the mentioned concentrations and the value of threshold cycles (Ct). In this figure, serial concentrations of bacteria are used on the horizontal axis, and the relationship between these concentrations and the value of Ct is shown on the vertical axis.
| Dilution | Colony Count | Mean of Ct ± SD Without PMA | Mean of Ct with PMA ± SD |
|---|---|---|---|
| 10-1 | 0.8 × 10⁹ | 11.5 ± 0.5 | 15 ± 0.5 |
| 10-2 | 0.8 × 10⁸ | 13.5 ± 0.5 | 18 ± 0.5 |
| 10-3 | 0.8 × 10⁷ | 15 | 20 |
| 10-4 | 0.8 × 10⁶ | 19 | 22 |
| 10-5 | 0.8 × 10⁵ | 21.5 ± 0.5 | 23 ± 0.5 |
| 10-6 | 0.8 × 10⁴ | 24 | 27 |
| 10-7 | 0.8 × 10³ | 27 | 28 |
| 10-8 | 0.8 × 10² | 30.5 ± 2 | 33 ± 2 |
| 10-9 | 8 | 33.5 ± 2 | 35 ± 2 |
Dilution Rate, Colony Count, Mean Threshold Cycles in Sample Treated with and Without Propidium Monoazide Have Been Compared with Each Other.
The correlation coefficient (R2) for the qPCR alone is 0.993, which suggests a good quantitative result from this assay. In the analysis of the qPCR + PMA, the value of R2 is 0.980, indicating good quantification. Table 3 compares the samples treated with and without PMA. According to the results of Will-Coxon analysis, a significant difference was observed between the average ranks of the qPCR and qPCR + PMA groups (P = 0.008).
Each dilution was performed in duplicate, the results were combined, and their average was calculated. The standard deviation of the results for each dilution showed that the overall dispersion was less than 2% from the mean data.
In the process of examining clinical samples, 16 ETEC isolates were identified and the Ct of serial dilution was investigated in these samples. The results of this part are similar to the standard serial dilution treated with PMA. However, due to the presence of bacterial debris and other substances in the feces, a higher concentration of PMA at 50 μm was used.
The investigation involving plate count agar and real-time PCR on the sample did not reveal any differences between them. However, the application of boiling treatment resulted in a noteworthy reduction in colony count, but not in real-time PCR (Figure 4). Specifically, after boiling for 5 minutes, all colony count samples tested negative, while the real-time PCR overestimated the level of live bacteria. Real-time PCR of boiling samples treated with PMA for durations of 1 to 4 minutes exhibited a significant reduction in the level of bacteria that was proportional to the real-time PCR alone. This outcome was similar to that obtained via plate colony counts and underscores the elimination of dead bacterial DNA from the investigation.
The results indicate that PMA + qPCR can facilitate the determination of the reduction in viable cells subsequent to boiling treatment, with outcomes that are similar to those obtained from the plate colony count. Furthermore, an examination of two bacterial DNA samples, one with PMA and one without PMA, demonstrated that DNA + PMA was entirely eradicated, with no amplification observed. This step’s results highlight the facile prevention of free DNA replication via PMA.
This study used a 50 mM dilution as standard dilution (22-24).
The increase in the Ct value was observed in all dilution averages; but the rate of increase varied among the different dilutions. At higher dilutions, a more substantial increase in Ct value was observed, and a larger fluctuation range was seen due to the lower amount of DNA present in the template. In other words, the Ct value increased as the amount of DNA decreased, exhibiting a logarithmic relationship with the number of bacteria from which the DNA was extracted.
5. Discussion
The uidA gene, which encodes for β-D-glucuronidase, has been utilized in numerous studies to confirm the presence of E. coli in samples (25). In this study, we employed the uidA gene for primary screening of E. coli in the samples. Additionally, we utilized PMA with qPCR to differentiate between dead and live cells. The standard method for identifying E. coli is the culture method, which necessitates several days of incubation. However, using qPCR can significantly reduce this time to just a few hours.
Exposure to the environment stress, high temperatures, competition with other bacteria, and chemical factors can damage bacteria. This damage has the power to kill bacteria such that they cannot be distinguished from live bacteria when examined using molecular methods (26). This issue is important in the sense that each bacterium must reach its infectious dose to cause disease. Given that free DNAs may exist in the sample and they do not necessarily cause the disease, they should be removed from the diagnosis process. Therefore, the issue of how many live and active bacteria are present in a sample is very important. Environmental stress can induce damage to the bacterial membrane, which subsequently permits the influx of PMA into the bacterial cell. In contrast, live bacteria possess an intact cytoplasmic membrane, which prevents the penetration of this chemical substance, rendering it exclusive to dead bacterial cells (13, 27).
The concentration of PMA used in various studies varies depending on the sample concentration (28, 29). In the event that the dilution process is appropriately carried out and the sample is not excessively concentrated, a predetermined quantity of PMA can be employed to treat the sample. In this study, the sensitivity and accuracy of the method were repeatable and reliable in the prepared dilution. The amount of PMA used in this study remained constant at all dilutions.
The detection of E. coli as a major pathogen in children holds immense significance. This bacterium can become more aggressive by acquiring virulence genes. However, given that the infectious dose required to cause disease ranges from 106 to 1010 bacteria, it is crucial to precisely determine this quantity in order to accurately predict the pathogenicity of this bacterium (30, 31). In addition to this, bacteria can enter the viable but non-culturable (VBNC) state, which cannot be detected using the culture method (32). Previous research has indicated that chronic infection can persist despite antibiotic use and negative culture results due to the presence of VBNC bacteria (33). These findings highlight the limitations of culture techniques and the need for more advanced molecular techniques, which offer greater sensitivity, specificity, and efficiency (34, 35). While some studies continue to advocate for the culture approach, many confirm the precision and effectiveness of the PCR method. Moreover, the culture method may not be able to identify pathogens in the presence of antibiotics or low pathogen concentrations. Real-time PCR can detect both the genus and species of bacteria and provide a precise quantification, while the culture method only detects the genus, and further biochemical and sugar fermentation studies are required for species identification, leading to longer turnaround times (33, 34). To reliably detect a signal, a sufficient concentration of DNA is necessary, and the limit of detection indicates the lowest DNA concentration that can be reliably distinguished from a blank sample (35). The sensitivity of a test reflects its ability to correctly identify a patient, with higher sensitivity leading to a lower false negative rate and better identification of disease cases (36).
One problem with using PMA in a dense sample like feces is that the presence of organic matter, dead bacteria, undigested food, and other materials can interfere with PMA penetration. One way to solve this problem is to dilute the sample, which reduces the concentration of target organisms. According to these cases, one strategy to solve this problem is to use a high concentration of PMA in the dense samples (29, 36). However, using serial dilution, high concentrations of PMA, and investigation of all dilutions in this study allowed the sensitivity, accuracy, and reproducibility of this method to be investigated. All the dilutions were tested, and the results were reproducible. In another research study, the DNA gradient method was found to produce similar results to the culture method, but in a shorter time period (37). Zhong et al. as cited by Pan et al. used PMA and PCR to investigate the presence of VBNC, which is comparable to the present study in that only DNA from living bacteria is examined (38). However, since qPCR was not used in this study, the amount of primary DNA could not be determined. Moreover, this study did not investigate the efficacy of PMA or conduct its examination in a controlled manner, as was successfully done in the current study (38). Yuan et al. investigated the presence of live E. coli in water samples using PMA and qPCR (39). In this study, environmental water samples showed 102 CFU/mL in the sample. This method can effectively identify living bacteria originating from feces in less time since the minimum detection limit is similar to the culture method and does not exhibit much difference. However, due to the different sample used in this study, a concentration of 5 M of PMA was used instead of the amount used in the current investigation (39).
The Lee et al. study utilized the uidA gene for diagnosis, whereas in the current study, the same gene was utilized for initial screening (40). With the assistance of a specific primer, the bacterial pathotype was accurately identified. Another distinction is that Lee et al. employed a qualitative method based on PCR, whereas the present study utilized qPCR, a quantitative method that enables the estimation of the bacterial count in the sample (40).
In short, this method offers two key advantages. Firstly, it is faster than the culture method and can identify the genus and species of bacteria. Secondly, it outperforms qPCR alone as the use of PMA allows for the exclusion of DNA from dead bacteria, enabling the identification of only living bacteria.
5.1. Conclusions
In this study, the diagnostic power of the real-time method alone and in combination with PMA was investigated. During this study, PMA was used in combination with living cells, living and dead cells, and only dead cells to determine the effectiveness of this combination. As a result, no signal was detected in dead cells by using PMA + qPCR. However, when dead and live cells were combined with (dead + live + PMA + qPCR), only the number of live cells was identified, indicating the successful differentiation of PMA.
The traditional method of identifying bacterial pathogens in diarrheal disease involves microbial culture, which is time-consuming and can be affected by growth-inhibiting factors such as antibiotics. However, the present study aimed to improve the accuracy and speed of diagnosis by using the qPCR method in combination with PMA. By selectively identifying and counting only living bacteria, the accuracy of the method was increased. This approach is particularly useful for accurately identifying the amount of live pathogenic bacteria, which can aid in both initial diagnosis and monitoring the effectiveness of treatment.
Using E. coli pathotype primer facilitates conducting a specific diagnosis quickly and accurately. Furthermore, the exact number of bacteria can be determined if PMA is used in conjunction with the above approach. This finding is helpful for studies that examine the effect of treatment.
In conclusion, this method enjoys two advantages: (1) Higher speed than the culture method; and (2) the ability to identify the genus and species of bacteria. The second advantage of this method compared to the application of qPCR alone is that PMA can remove DNA from dead bacteria, helping to identify live bacteria.
