


1. Background
On 29 December, 2019, doctors in Wuhan, China noticed unusual cases of patients with pneumonia. However, the first case of the disease was observed on 12 December, 2019. Finally, on 9 January, 2020, the cause of the disease was announced by a new coronavirus called 2019-nCoV by the Centers for Disease Control and Prevention (CDC) (1-4). Coronavirus is one of the major pathogens of the human respiratory system. The outbreaks of coronavirus like severe acute respiratory syndrome (SARS-CoV) and Middle East respiratory syndrome (MERS-CoV), as the causes of severe lower respiratory tract infection in humans, are a major threat to the human health (5). Coronaviruses are a large family of viruses and a subset of Cornidovirineae that could causes diseases ranging from the common cold to severe diseases, such as SARS, MERS, and coronavirus disease 2019 (COVID-19) (6-8).
As of April 2022, the number of patients was 500,186,525, and the number of deaths was more than 6,190,349, and 216 countries were affected by the outbreak (9). Also, in Iran, the number of patients was 7,199,861 and the number of deaths was more than 140,711 cases (10). The average number of days from onset of symptoms until death was estimated to be 14 days and the median of days from the initial symptoms to death in people aged 70 years and older (11.5 days) was shorter than in people under 70 years (20 days). These issues indicate that the disease progresses faster in older people than in young ones (11). The basic reproduction number of COVID-19 was estimated to be 2.3% in Iran (12, 13). In a study, the fatality rate of COVID-19 was estimated at 2.84%, while other studies reported 1.93%, 3.4%, 14%, and 15% (14-16).
During the COVID-19 epidemic in Iran, the first patient was reported from Qom (17, 18), a holy city near the capital Tehran and a major destination of pilgrimages in the region (19). Qom province, located on the south of Tehran, north of Isfahan Province and central Iran, is of 11238 sq. km. The province is connected to the Markazi Province from southwest to northwest and to the Semnan Province in the east. The population is estimated as 1.2 million (20). All the provinces were affected by COVID-19, and the rate in Qom province was 61.8 cases per 100,000 population (17).
Predicting the epidemic situation over time can be very helpful for health care providers. In the last decade, numerous mathematical modeling and computational simulations have been developed to understand the behavior of the infectious diseases. This has led to a clearer knowledge of the dynamics of disease transmission, the adoption of preventive behaviors, and the consideration of control strategies (21).
To predict and control epidemics, several computational models have been used by health managers (22). Increasing access to computer resources has facilitated modeling of the spread of the epidemic in several levels, including individual, social, regional, and national levels. Computer models improve representation, understanding of complex social structures and heterogeneous patterns within interpersonal communication networks, and estimating transmission dynamics (23).
2. Objectives
Modeling of epidemic diseases, by combining social structures and heterogeneous communication patterns between individuals (24), has been used in different studies and diseases (cancers, seasonal flu, malaria, COVID-19, etc.) (25-31). Accordingly, this modeling study aimed to project the epidemics trend of COVID-19 in Qom, Iran.
3. Methods
We projected the COVID-19 outbreak in Qom using a modified susceptible-exposed-infectious-recovered (SEIR) compartmental model by the end of December 2020. The modelling framework was similar to that proposed by Sharifi et al. (32). The model was calibrated based on Qom’s epidemiological and clinical data. Conceptually, the model is shown in Figure 1.

The conceptual modified SEIR model
Differential equations system was defined for each compartment as follows:
Where, S is the susceptible population, E is the exposed population, I is the infected population, R is the recovered population, D is the death population, E is the isolated population, H is the hospitalized population, and T is the temporary isolation units population. Total Qom population (1,292,000) was considered as susceptible. The individuals exposed to infectious people are in latent period and cannot transmit the infection. Latent period and incubation period were assumed equal (33). Infected individuals transmit the infection to susceptible population. Four events occurred for the infected individuals as follows: (1) some patients were asymptomatic or had mild symptoms; these people were not isolated; (2) a proportion of patients were asymptomatic or had mild symptoms; these people self-isolated themselves after demonstrating clinical symptoms and recovered; (3) a proportion of patients had severe symptoms and needed to be hospitalized; and (4) some patients died without requiring hospitalization. In addition, a proportion of hospitalized people died and a proportion of them were isolated in temporary units and recovered.
The model was calibrated based on COVID-19 epidemic trend in Qom from 1 January to 11 July (Figure 1). The number of infected, hospitalized, and death cases were projected by 31 December.
A Monte Carlo uncertainty analysis was applied to obtain 95% uncertainty interval (UI) around the estimates. Probability distributions was considered for model parameters, and 10,000 simulations were run. We defined model parameters, values, and distribution in Table 1. In this case, the classical infectious disease model (Susceptible → Exposed → Infected → Removed: SEIR) was used to analyze the data.
| Variables | Scenario A | Scenario B | Scenario C | Scenario D | Scenario E | Scenario F |
|---|---|---|---|---|---|---|
| Infected Cases | ||||||
| Peak date | 31 Dec | 31 Dec | 31 Dec | 31 Dec | 31 Dec | 31 Dec |
| Number (95% UI) of new cases per day on peak | 15,700 (130 - 28,000) | 9,000 (40 - 22,000) | 6,700 (20 - 18,800) | 2,300 (50 - 10,000) | 1,100 (20 - 5,400) | 270 (70 - 1,600) |
| Total number (95% UI) until 1 January 2021 | 948,000 (6,000 - 2,400,000) | 541,000 (56,000 - 1,750,000) | 431,000 (56,000 - 1,400,000) | 265,000 (56,000 - 901,000) | 222,000 (56,000 - 675,000) | 188,000 (55,000 - 514,000) |
| Hospitalized Cases | ||||||
| Peak date | 31 Dec | 31 Dec | 31 Dec | 31 Dec | 31 Dec | 31 Dec |
| Number (95% UI) of the existing cases on peak | 10,700 (100 - 25,500) | 5,000 (30 - 16,000) | 3,800 (10 - 13,200) | 1,100 (40 - 5,700) | 620 (10 - 3,000) | 150 (45 - 900) |
| Total number (95% UI) until 1 January 2021 | 120,000 (8,000 - 351,000) | 64,000 (7,000 - 220,000) | 53,000 (7,000 - 180,000) | 32,500 (7,000 - 107,000) | 28,000 (7,000 - 85,000) | 23,700 (7,000 - 64,000) |
| Deaths | ||||||
| Total number (95% UI) until 1 January 2021 | 8,000 (700 - 21,000) | 4,200 (700 - 13,500) | 3,600 (700 - 11,500) | 2,200 (600 - 6,800) | 2,000 (600 - 5,300) | 1,700 (600 - 4,000) |
The Estimated Date for Epidemic Peak, Number of Infected, Hospitalized, and Death Cases in Qom Under Six Difference Scenarios from 1 January 2020 to 31 December 2021
3.1. Scenarios
Contact rate and isolation rate were susceptible to change in the scenarios. Qom is a metropolitan city in Iran. It is the second destination of religious tourism in Iran due to the presence of the shrine of Fatemeh Masoumeh. Therefore, we assumed that before diagnosing the first case in Iran, the contact rate was 14. Contact rate parameters were calibrated based on interventions implemented in Qom before 11 July. We assumed that the minimum of contact rate in Qom was five because the average household size was 3.4 individuals. The government in Iran closed the offices and schools and imposed some travel restrictions on 19 April. Also, the weekly congregational prayer was gradually halted after 19 April. However, there are still some restrictions on schools and universities and holding wedding ceremonies.
To increase self-isolation in Iran, case finding through 4030 Call System and self-report through www.salamat.gov.ir were established. Patients were followed every day to stay at home for 14 days. We assumed that self-isolation was observed by 10% of patients without any intervention. The first case was diagnosed in Qom on 19 February. Therefore, self-isolation increased to 15%. Also, the self-isolation rate was calibrated from 3 March to 11 July. The contact rate and self-isolation rate have been shown in Table 2. We considered six scenarios to project the trend of epidemic in Qom from 12 July to 31 December, 2020 (Table 3).
| Date | Calibrated Model | |
|---|---|---|
| Contact Rate | Isolation Rate | |
| From 1 January, 2020 to 1 February, 2020 | 14 | 10 |
| From 2 February, 2002 to Feb21, 2020 | 12 | 10 |
| From 22 February, 2020 to 3 March, 2020 | 9 | 15 |
| From 4 March, 2020 to 13 March, 2020 | 6 | 50 |
| From 14 March, 2020 to Apr19, 2020 | 5 | 50 |
| From 20 April, 2020 to 29 April, 2020 | 6 | 50 |
| From 30 April, 2020 to 23 May, 2020 | 8 | 45 |
| From 24 May, 2020 to 22 June, 2020 | 8 | 40 |
| From 23 June, 2020 to 11 July, 2020 | 8 | 30 |
Contact Rate and Isolation Rate for Calibrated Model from 1 January to 11 July, 2020 in Qom
| Date | Scenarios | Contact Rate | Isolation Rate |
|---|---|---|---|
| From 12 July 2020 to 31 December 2020 | A | 8 | 30 |
| B | 8 | 40 | |
| C | 7 | 30 | |
| D | 7 | 40 | |
| E | 6 | 30 | |
| F | 6 | 40 |
Contact Rate and Isolation Rate for Six Different Scenarios from 12 July 2020 to 31 December 2020 in Qom
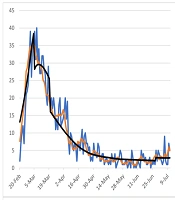
The model was calibrated based on death toll in Qom. The contact rate and isolation rate for the calibrated model have been presented in Figure 2.
.")
The calibrated model based on death toll per day and cumulative deaths (we predicted that 90 death cases existed before 20 February when the first case was observed; so, we omitted 90 cases from the number of cumulative deaths).
4. Results
4.1. Scenario A
The peak on 31 December was 15,700 (95% UI: 130 - 28,000) new infected cases per day. The total number of infected cases by 31 December was expected to be 948,000 (95% UI: 6,000 - 2,400,000). The peak number of hospitalized cases on 31 December was 10,700 (95% UI: 100 - 25,500) per day. The total number of hospitalized cases by 31 December was expected to be 120,000 (95% UI: 8,000 - 351,000). The COVID-19 death toll was expected to be 8,000 (95% UI: 700 - 21,000) (Table 1, Figures 3 - 5).
.")
The estimated number of new infected cases per day in Qom under six difference scenarios from 1 January to 31 December, 2020 (*the red line shows 11 July 2020).
.")
The estimated number of existing hospitalized cases in in Qom under six difference scenarios from 1 January to 31 December, 2020 (*the red line shows 11 July 2020).
.")
The estimated number of deaths in in Qom under six difference scenarios from 1 January to 31 December, 2020 (*the red line shows 11 July 2020).
4.2. Scenario B
Under scenario B, the epidemic peaks on 31 December was 9,000 (95% UI: 40 - 22,000) new infected cases per day. The total number of infected cases by 31 December was expected to be 541,000 (95% UI: 56,000 - 1,750,000). The peak number of hospitalized cases on 31 December was 5,000 (95% UI: 30 - 16,000) per day. The total number of hospitalized cases by 31 December was expected to be 64,000 (95% UI: 7,000 - 220,000). The total number of deaths was expected to be 4,200 (95% UI: 700 - 13,500) (Table 1, Figures 3 - 5).
4.3. Scenario C
The peak number of new infected cases on 31 December was 6,700 (95% UI: 20 - 18,800) per day. It was predicted that total number of infected cases would be 431,000 (95% UI: 56,000 - 1,400,000) by 31 December. The peak number of hospitalized cases on 31 December was 3,800 (95% UI: 10 - 13,200) per day. The total number of hospitalized cases by 31 December and the total number of deaths were expected to be 53,000 (95% UI: 7,000 - 180,000) and 3,600 (95% UI: 700 - 11,500), respectively (Table 1, Figures 3 - 5).
4.4. Scenario D
Under scenario D, the peak on 31 December was 2,300 (95% UI: 50 - 10,000) new infected cases per day. The total number of infected cases by 31 December was expected to be 265,000 (95% UI: 56,000 - 901,000). The peak number of hospitalized cases on 31 December was 1,100 (95% UI: 40 - 5,700) per day. The total number of hospitalized and death cases by 31 December were expected to be 32,500 (95% UI: 7,000 - 107,000) and 2,200 (95% UI: 650 - 6,800), respectively (Table 1, Figures 3 - 5).
4.5. Scenario E
The peak number of new infected cases on 31 December was 1,100 (95% UI: 20 - 5,400) per day. It was predicted that the total number of infected cases would be 222,000 (95% UI: 56,000 - 675,000) by 31 December. The peak number of hospitalized cases on 31 December was 620 (95% UI: 10 - 3,000) per day. The total number of hospitalized and deaths cases by 31 December were expected to be 28,000 (95% UI: 7,000 - 85,000) and 2,000 (95% UI: 600 - 5,300), respectively (Table 1, Figures 3 - 5).
4.6. Scenario F
Under scenario F, the peak number of new infected cases on 31 December was 270 (95% UI: 70 - 1,600) per day. The total number of infected cases by 31 December was expected to be 188,000 (95% UI: 55,000 - 514,000). The peak number of hospitalized cases on 31 December was 150 (95% UI: 45 - 900) per day. Total number of hospitalized and death cases by 31 December were expected to be 23,700 (95% UI: 7,000 - 64,000) and 1,700 (95% UI: 600 - 4,000), respectively (Table 1, Figures 3 - 5).
5. Discussion
The COVID-19 outbreak has become a clinical threat to the general population and healthcare workers worldwide. However, the world's knowledge about this new virus is limited. In this study, we projected the COVID-19 outbreak in Qom, Iran using available data on new infected, hospitalized, and death cases based on six scenarios between January and the end of December 2020. In each scenario, the contact rate and isolation rate changed. In practice, politicians can control these rates by closing schools and businesses, imposing travel restrictions, as well as case-finding and isolation of the infected cases. We studied the impact of making changes in the mentioned parameters, on the peak date of outbreak, number of new cases per day during peaks, and the number of new infected, hospitalized, and death cases.
According to the results, the reduced contact rate and increased isolation rate were effective in reducing the size of the epidemic in all scenarios. By reducing the contact rate from eight to six, the number of new cases in peak days, as well as the total number of hospitalized cases by the end of the period (31 December), decreased. For example, in Scenario A, compared to Scenario E, with a decrease in contact rate from eight to six, the number of new cases on peak days decreased from 15,700 to 1,100. The largest decrease in the number of new cases on peak days was related to Scenario F with 270 cases. Also, the total number of cases decreased from 948,000 to 222,000 between the scenarios, and the largest decrease in this regard was related to Scenario F, with 188,000 cases. This trend is visible in all A - F scenarios and follows almost the same trend, which is consistent with some previous studies that reported the importance of personal hygiene, social distance, and reducing contact in reducing death and infected cases (32, 34-37). In a study in China, the researchers showed that to control the epidemic, the contact rate should be kept below 30% of the normal level (38). Also, to minimize the contact rate, people should pay attention to wearing masks and avoid crowded places (39, 40).
Several studies conducted around the world showed that interventions on contact and isolation rates could have a positive effect on delaying the onset of the epidemic (41-43). In a study by Kuniya in Japan, the closures of schools and social events led to a decrease in the number of people in the community, which had a positive impact on the epidemic control (41).
In addition, our results showed that with the increase of isolation rates in different scenarios, the new cases decreased. This reduction is quite true for the total number of cases, hospitalizations, and deaths due to COVID-19. For example, in the case of hospitalization in the basic scenario A with a contact rate of eight and minimal isolations, a minimum of 10,700 people would be hospitalized per day during the epidemic, and the total number of hospitalizations during the study period is estimated at 120,000 people. In the scenario with a contact rate of six and isolation rate of 40%, the number of admissions per peak day was estimated to be 150, and the total number of hospitalizations during this period was estimated to be 23,700, indicating a decrease of 98.5% and 80%, respectively. Regarding the death of people in scenario A, 8,000 people will die during the study period, and in scenario F, which can be the best-case scenario, the number of deaths will be reduced to 1,700. Some previous studies also confirmed this hypothesis (43-46).
The results of study showed that in scenario A, in early October 2020, we will have an epidemic peak again, which will be higher than the initial peak, so that in the short period of one to two months after October, the peak rate can reach four to five times the first peak. In scenarios B and C, we will have an increase from late October to mid-November, and the peak will reach two to three times the first peak. In scenario D, in late mid-December, we will have a brief peak that will be slightly higher than the first peak. If scenario E occurs, there will be a re-peak in December 2020, which will be less than the initial peak. If scenario F occurs, a very slight but very short and almost flat increase in new cases of the disease will occur in December 2020; but a second peak is not seen, which is the most ideal scenario possible. Some previous studies also confirmed this result (47-50).
It seems that the best scenario for controlling the disease is scenario F, which almost eliminates the possibility of recurrence. However, due to the economic sanctions in Iran and various economic problems, it is practically impossible to implement it at present. On the other hand, the results of this study showed that if scenarios A to C are followed in late autumn in Qom, a re-epidemic peak will occur, which on average will be between three to five times the previous peak, and if there is no effective intervention, the number of people with the disease in a relatively short period of two to three months can increase to 948,000 people, in which case the number of new deaths can be estimated between 2,000 and 3,000 people in Qom province. If there is no effective reduction of contacts and isolation, it can send between 500 and 1,500 new patients daily to the city hospitals, which can have catastrophic consequences due to the lack of sufficient beds in hospitals, medical equipment, special wards and devices, ventilators, and limited human resources. On the other hand, if effective interventions are performed under scenarios D and E, the results can be good. For example, to reduce the number of calls, schools and universities and all educational centers in the province should not be reopened in any way during the academic year, and trainings should be done in absentia and virtually. Physical distancing should be observed at the community level, and it should be adequately monitored. Also, religious ceremonies, celebrations, and funerals should be prohibited. Meanwhile, city-level stores to provide offline services on the Internet and activate delivery systems should be applied.
To isolate patients with the aim of reducing or stopping the transmission chain at the community level, finding and isolating the infected people and their effective treatment and extensive tracking and testing can be performed (51). All contact cases should be treated and isolated. It is also necessary to provide support to the vulnerable people. The results of the study also indicated that the simultaneous change of both contact rate and isolation rate, compared to the implementation of each of these rates alone, can better control the outbreak. In general, it seems that the best scenario to implement is scenario F, in which the contact rate was six and the isolation rate was 40%. These results are similar to the studies by Paul et al. (52), Yang et al. (53), Heymann et al. (54) and Cheung et al. (55).
5.1. Limitations
Firstly, some of the parameters used in the model were not from empirical data from Qom and were from other studies. Secondly, our results about the projection of the epidemic in Qom depended on the assumption of implementing physical distancing. So, any changes in policy and public interventions may change the course of the epidemic. However, the results of this study under different scenarios provide a foundation to measure the effect of interventions in Qom.
5.2. Conclusions
The results of this study showed that the parameter of contact rate and isolation rate can reduce the number of infected people and prevent the outbreak, or at least delay the onset of the peak. This can help health policymakers and community leaders to upgrade their health care systems, as well as have enough time to provide the infrastructure for health care interventions, including equipping health care facilities. Also, they will have enough time to perform effective therapeutic interventions for patients and prevent the burnout of medical staff, including physicians, nurses, and all health care providers.
