


1. Context
Rapid growing numbers of COVID-19 patients and limited infrastructure resources provide significant challenges for healthcare institutions. It would be beneficial if any clinical or laboratory parameters would help us rapidly triage patients to appropriate units. The COVID-19 severe manifestations must be detected as soon as possible to predict each case's prognosis. Although the underlying pathophysiology of severe COVID-19 is poorly defined, some studies (1) reported that severe COVID-19 is related to significant coagulopathy.
A previous meta-analysis (2) demonstrated that advanced coagulation parameters such as D-dimer were associated with severity and mortality of COVID-19. However, most hospitals in peripheral areas, especially in developing countries, might not be able to test D-dimer. Simple coagulation parameters, including Prothrombin Time (PT), international normalized ratio (INR), activated partial thromboplastin time (aPTT), and platelets, are widely accessible in many health centers (3). Based on early reports, moderate to severe COVID-19 patients were likely to have prolonged PT, elevated INR, prolonged aPTT, and decreased platelets with subsequent poorer outcomes (4-6).
2. Objectives
We aimed to identify if basic coagulation profiles have a prognostic value in COVID-19 in-hospital mortality.
3. Method
We selected observational studies or trials on adult COVID-19 patients presenting some details on coagulation profiles, including platelet (PLT), PT, aPTT, and INR, for in-hospital mortality outcomes. Any study that had incomplete required data or lacked coagulation profile information on admission was removed. This meta-analysis was written as per the Preferred Reporting Items for systematic reviews and meta-analyses (PRISMA) guidelines (7).
A systematic literature search was finalized on November 20, 2021, following the approval of the institutional review board. We searched five different databases (PubMed, Science Direct, Scopus, ProQuest, and medRxiv) using the keywords "COVID 19" OR "Sars-Cov-2" OR "Novel coronavirus" AND "Laboratory parameter" OR "Coagulation" AND "Mortality" OR "Death" OR "Survivor." We also examined reference lists of the included studies to recognize any relevant studies to be added. Before full-text retrieval, three investigators evaluated titles and abstracts. Three investigators reviewed titles and abstracts before retrieving full-text papers. Two investigators then collected the data in each comparison category from full-text studies, including the authors, publication year, location, study design, peer-reviewed publication status, study outcome, and coagulation profile data.
The coagulation profile focusing on survival and non-survival outcomes was the primary outcome in our meta-analysis. The NIH quality assessment tool for observational Cohort and cross-sectional studies was used to determine the methodological quality of the studies. The visual analysis of funnel plots and the Egger regression test were used to assess publication bias (8).
Data analysis was carried out utilizing review manager (RevMan v5.4 2020) and Stata v.16. A standardized mean difference (SMD) for coagulation profile values was used in the meta-analysis. According to Wan et al. (9), sample size, median, and interquartile range (IQR) were used to calculate the mean and standard deviation (SD). We used inverse-variance weighting and random-effects models. The pooled odds ratios (ORs) were calculated using the Mantel-Haenszel formula for dichotomous variables.
We carried out a subgroup analysis by study design. Sensitivity analysis was performed using the leave-one-out method or dependent on peer-review status to evaluate the reason for heterogeneity. We assessed the heterogeneity using the I2 statistic. Restricted maximum likelihood random-effects meta-regression was performed for age, sex, cardiovascular disease (CVD), hypertension (HTN), and diabetes mellitus (DM) comorbidities in coagulation profiles, with a significant result and more than 10 studies included (10). In this meta-analysis, all p values less than 0.05 were statistically significant (except for heterogeneity using P < 0.10).
4. Results
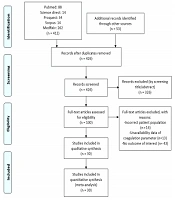
Initial searches showed 88 PubMed records, 14 Science Direct records, 34 ProQuest records, 14 Scopus records, 262 medRxiv records, and 53 other records (Figure 1). After removing 39 duplicates and excluding 326 records, we retrieved 100 records for full-text screening. A total of 14 studies were excluded due to incorrect patient population, 13 due to unavailability of data on coagulation parameters, and 43 due to no outcome of interest. Thereby, we included the remaining 30 studies (9,175 patients) for analysis (11-40).
")
Study flow chart (as per PRISMA guideline)
Tables 1 and 2 show the baseline characteristics of the included studies. There were 28 retrospective studies and two prospective observational studies. Peer review had already been completed on 21 studies. We assessed all methodologically acceptable studies (Table 1). The analyses and conclusions drawn were reliable. Nonetheless, due to their cross-sectional designs, most studies did not assess exposure before evaluating the outcome and would most likely lack adequate periods for the outcome.
| No | Author | Study Design | Hospital | Town, Country | Period | Samples (n) | Samples with a Lab Value | Male (%) | Age (y) | HTNo. (%) | CVD (%) | DM (%) | Study Quality |
|---|---|---|---|---|---|---|---|---|---|---|---|---|---|
| 1 | Zhang et al. 2020 (14) | Retro | Wuhan Pulmonary Hospital | Wuhan, China | February 7 - March 27, 2020 | 53 (13 vs. 40) | aPTT 42(10 vs. 32), PT 53(40 vs. 13), Platelet 53(40 vs. 13) | N/A | N/A | N/A | N/A | N/A | Fair |
| 2 | Yan et al. 2020 (15) | Retro | Tongji Hospital | Wuhan, China | January 10 - February 24, 2020 | 193 (108 vs. 85) | 48 (39 vs. 9) | 76.9 vs. 33.3 | 70.5 ± 10 vs. 64.7 ± 7.3 | 52.8 vs. 18.8 | 25 vs. 4.7 | 36.1 vs. 10.6 | Good |
| 3 | Tang et al. 2020 (16) | Retro | Tongji Hospital | Wuhan, China | Jan 1 - Feb 3 2020 | 449 (134 vs. 315) | 449 (134 vs. 315) | 67.1 vs. 56.5 | 68.7 ± 11.4 vs. 63.7 ± 12.2 | N/A | N/A | N/A | Good |
| 4 | Wu et al. 2020 (17) | Retro | Jinyintan Hospital | Wuhan, China | Dec 25, 2019 - Jan 26, 2020 | 84 (44 vs. 40) | 84 (44 vs. 40) | 65.9 vs. 77.5 | 67.6 ± 12 vs. 49.03 ± 12.69 | 36.4 vs. 17.5 | 9.1 vs. 2.5 | 25 vs. 12.5 | Good |
| 5 | Tang et al. 2020 (13) | Retro | Tongji Hospital | Wuhan, China | Jan 1 - Feb 3 2020 | 183 (21 vs. 162) | 183 (21 vs. 162) | 76.19 vs. 50.61 | 64.0 ± 20.7 vs. 52.4 ± 15.6 | N/A | N/A | N/A | Good |
| 6 | Fan et al. 2020 (18) | Retro | Jinyintan Hospital | Wuhan, China | Dec 30, 2019 - Feb 16, 2020 | 73 (47 vs. 26) | 73 (47 vs. 26) | 68.09 vs. 65.38 | 65.46 ± 9.74 vs. 46.23 ± 12.01 | 44.68 vs. 11.54 | 14.89 vs. 0 | 21.28 vs. 7.69 | Good |
| 7 | Li et al. 2020 (19) | Retro | Wuhan Fourth Hospital | Wuhan, China | Jan 25 - Feb 26, 2020 | 74 (14 vs. 60) | 74(14 vs. 60) | 78.6 vs. 55 | 72.33 ± 6.59 vs. 61.67 ± 12.91 | 71.4 vs. 41.7 | 28.6 vs. 3.3 | 21.4 vs. 18.3 | Good |
| 8 | Satici et al. 2020 (20) | Retro | Gaziosmanpasa Research and Training Hospital | Istanbul, Turkey | April 2 - May 1, 2020 | 681 (55 vs. 626) | 681 (55 vs. 626) | 60 vs. 50.2 | 65.8 ± 12 vs. 56.1 ± 15.8 | 50.9 vs. 32.9 | 14.5 vs. 8.6 | 41.8 vs. 26.8 | Good |
| 9 | Du et al. 2020 (21) | Pros | Wuhan Pulmonary Hospital | Wuhan, China | Dec 25, 2019 - Feb 7, 2020 | 179 (21 vs. 158) | 179 (21 vs. 158) | 47.6 vs. 55.1 | 70.2 ± 7.7 vs. 56 ± 13.5 | 61.9 vs. 28.5 | 57.1 vs. 10.8 | 28.6 vs. 17.1 | Good |
| 10 | Pan et al. 2020 (22) | Retro | Union Hospital, Tongji Medical College, Huazhong University of Science and Technology | Shanghai, China | Jan 27-Mar 19, 2020 | 124 (89 vs. 35) | 124 (89 vs. 35) | 75.3 vs. 51.4 | 69 (61-73) vs. 65 (49-77) | 52.8 vs. 42.9 | 14.6 vs. 17.1 | 21.3 vs. 17.1 | Good |
| 11 | Chen et al. 2020 (12) | Retro | Tongji, Hospital | Shanghai, China | Jan 13-Feb 12, 2020 | 274 (113 vs. 161) | 274 (113 vs. 161) | 73 vs. 55 | 68.0 (62.0-77.0) vs. 51.0 (37.0-66.0) | 48 vs. 24 | 14 vs. 4 | 21 vs. 14 | Good |
| 12 | Gil et al. 2020 (11) | Retro | Montefiore Medical Center/ University Hospital for Albert Einstein College of Medicine, Moses Campus | New York, USA | Mar 20-31, 2020 | 217 (70 vs. 147) | 217 (70 vs. 147) | 67.1 vs. 53.7 | 68.71 ± 12.44 vs. 57.71 ± 15.56 | 74.3 vs. 61.2 | N/A | 45.7 vs. 33.3 | Fair |
| 13 | Alshukry et al. 2020 (23) | Retro | Jaber Al-Ahmad Hospital | Kuwait City, Kuwait | Feb 24-May 24, 2020 | 417 (60 vs. 357) | 88 (60 vs. 22) | 90 vs. 68.2 | 54.20 ± 11.09 vs. 52.32 ± 13.51 | 46.7 vs. 22.7 | 21.7 vs. 4.5 | 40.0 vs. 22.7 | Fair |
| 14 | Ayed et al. 2020 (24) | Retro | Jaber Al-Ahmad Al Sabah Hospital | Kuwait City, Kuwait | Mar 1-Apr 30, 2020 | 103 (45 vs. 47) | 92 (45 vs. 47) | 91 vs. 79 | 56 (48-63) vs. 51 (40-61) | 51.1 vs. 23.4 | 17.8 vs. 6.5 | 51.1 vs. 30.4 | Good |
| 15 | Shi et al. 2020 (25) | Retro | Renmin Hospital of Wuhan University | Wuhan, China | before February 15, 2020 | 101 (48 vs. 53) | 101 (48 vs. 53) | 58.3 vs. 60.4 | 72.0 (59.0-78.0) vs. 71.0 (59.0-81.0) | 56.3 vs. 60.4 | 18.8 vs. 26.4 | 18.8 vs. 22.6 | Fair |
| 16 | Luo et al. 2020 (26) | Retro | Renmin Hospital of Wuhan University | Wuhan, China | Jan 30-Feb 25, 2020 | 403 (100 vs. 303) | PLT: 403 (100 vs. 303) | 57 vs. 44.9 | 71 (65-80) vs. 49 (37-62) | 60 vs. 17.5 | 16 vs. 6.6 (CAD) | 25 vs. 10.6 | Good |
| 17 | Zhang et al. 2020 (27) | Retro | Wuhan No.1 Hospital | Wuhan, China | Dec 25, 2019- Feb 15, 2020 | 48 (17 vs. 31) | PLT: 48 (17 vs. 31) | 70.6 vs. 67.7 | 78.65 ± 8.31 vs. 66.16 ± 13.66 | 70.6 vs. 64.5 | 23.5 vs. 29.0 (CAD) | 29.4 vs. 16.1 | Fair |
| 18 | Paranjpe et al. 2020 (28) | Retro | Mount Sinai Hospital | New York, USA | Feb 27-April 2, 2020 | 1078 (310 vs. 768) | PLT:1008 (282 vs. 726); PT: 446 (142 vs. 304); aPTT: 442 (140 vs. 302) | 61.6 vs. 56.8 | 75 (64-85) vs. 59 (45-72) | 45.2 vs. 30.3 | 26.8 vs. 10.9 | 33.9 vs. 19.7 | Fair |
| 19 | Hu et al. 2020 (29) | Retro | Tongji Hospital | Wuhan, China | Jan 28-Mar 11, 2020 | 183 (68 vs. 115) | 183 (68 vs. 115) | 73.53 vs. 49.57 | 68.44 ± 9.94 vs. 60.54 ± 13.19 | 44.12 vs. 37.39 | N/A | 20.59 vs. 18.26 | Good |
| 20 | Fu et al. 2020 (30) | Retro | Third Batch of Chongqing Medical Aid Team | Wuhan, China | February 4- February 16, 2020 | 85 (14 vs. 71) | 85 (14 vs. 71) | 78.57 vs. 53.52 | 67(50.75-74.25) vs. 62(55-70) | 50 vs. 33.8 | 28.57 vs. 11.23 | 28.57 vs. 12.68 | Good |
| 21 | Luo et al. 2020 (31) | Retro | Eastern Campus of Renmin Hospital of Wuhan University | Wuhan, China | Jan 30-Feb 20, 2020 | 298 (84 vs. 214) | 298 (84 vs. 214) | 60.7 vs. 46.3 | 71 (64-80) vs. 51 (37-63) | 58.3 vs. 17.3 | 15.5 vs. 6.1 | 21.4 vs. 12.6 | Good |
| 22 | Wang et al. 2020 (32) | Retro | Renmin Hospital | Wuhan, China | Jan 1-Feb 6, 2020 | 339 (65 vs. 274) | 339 (65 vs. 274) | 60 vs. 46.4 | 76 (70–83) vs. 68 (64–74) | 50 vs. 38.8 | 32.8 vs. 11.7 | 17.2 vs. 15.8 | Good |
| 23 | Yang et al. 2020 (33) | Retro | Wuhan Jin Yin-tan hospital | Wuhan, China | Dec 24, 2019-Jan 26, 2020 | 52 (32 vs. 20) | 52 (32 vs. 20) | 66 vs. 70 | 64.6 ± 11.2 vs. 51.9 ± 12.9 | N/A | 9 vs. 10 | 22 vs. 10 | Good |
| 24 | Zhou et al. 2020 (34) | Retro | Jinyintan Hospital and Wuhan Pulmonary Hospital | Wuhan, China | December 29, 2019-Jan 31, 2020 | 191 (54 vs. 137) | PLT: 191(54 vs. 137); PT: 182(54 vs. 128) | 70 vs. 59 | 69 (63–76) vs. 52 (45–58) | 48 vs. 23 | 24 vs. 1 | 31 vs. 14 | Good |
| 25 | Wang et al. 2020 (35) | Retro | Sino-French New City Branch of Tongji Hospital | Wuhan, China | Jan 28-Mar 4, 2020 | 199 (24 vs. 175) | 199 (24 vs. 175) | 66.7 vs. 49.1 | 69.5 (64.5-82.75) vs. 64.0 (51.0-71.0) | 50.0 vs. 37.9 | 8.3 vs. 12 | 37.5 vs. 18.9 | Good |
| 26 | Sai et al. 2021 (36) | Retro | Leishenshan Hospital | Wuhan, China | Feb 24-April 5, 2020 | 47 (15 vs. 32) | 47 (15 vs. 32) | 46.7 vs. 71.9 | 70.64 ± 12.33 vs. 69.67 ± 12.91 | 46.7 vs. 56.3 | 20 vs. 15.6 | 40 vs. 37.5 | Good |
| 27 | Peiró et al. 2021 (37) | Retro | Joan XXIII University Hospital | Tarragona, Spain | Mar 16-May 15, 2020 | 196 (37 vs. 159) | 196 (37 vs. 159) | 62.2 vs. 59.1 | 76.5 (68.5–82.5) vs. 61.5 (51.5–75.5) | 64.9 vs. 39.6 | 18.9 vs. 7.6 | 35.1 vs. 20.8 | Good |
| 28 | Velasco-Rodríguez et al. 2021 (38) | Retro | 4 hospitals in Madrid | Madrid, Spain | Feb 27-Apr 17, 2020 | 2070 (393 vs. 1677) | 2070 (393 vs. 1677) | 20.92 vs. 79.08 | 81 (72–87) vs. 63 (51–75) | 27.75 vs. 72.25 | 31.49 vs. 68.51 | 29.1 vs. 80.9 | Good |
| 29 | Violi et al. 2021 (39) | Pros | University hospitals located in Rome (2 centers), Latina, Perugia, and Chieti | Italy | Mar 1-31, 2020 | 373 (75 vs. 298) | 373 (75 vs. 298) | 72 vs. 59 | 75.3 ± 13.9 vs. 65.5 ± 17.0 | 61 vs. 51 | 22 vs. 13 | 25 vs. 15 | Good |
| 30 | Gayam et al. 2021 (40) | Retro | inner-city teaching hospital Brooklyn | New York, USA | Mar 1-Apr 9, 2020 | 408 (132 vs. 276) | 408 (132 vs. 276) | 32.9 vs. 67.1 | 71 (62-80) vs. 63 (53-73) | 64.9 vs. 39.6 | 37.04 vs. 62.92 | 40.91 vs. 59.09 | Good |
Characteristics of Included Studies a
| No. | Author | aPTT (s) | PT (s) | PT Cut-Off | PLT (109/L) | PLT Cut-Off | INR |
|---|---|---|---|---|---|---|---|
| 1 | Zhang et al. 2020 (14) | 39.99 ± 7.12 vs. 40.25 ± 4.65 | 14.95 ± 1.70 vs. 13.70 ± 1.04 | NR | 109.42 ± 112.33 vs. 176.75 ± 54.40 | NR | N/A |
| 2 | Yan et al. 2020 (15) | 40.16 ± 8.3 vs. 37.63 ± 6.77 | 15.47 ± 3.15 vs. 13.73 ± 0.92 | NR | 167 ± 88.51 vs. 202.33 ± 111,08 | NR | N/A |
| 3 | Tang et al. 2020 (16) | N/A | 16.5 ± 8.4 vs. 14.6 ± 2.1 | NR | 178 ± 92 vs. 231 ± 99 | NR | N/A |
| 4 | Wu et al. 2020 (17) | 24.9 ± 4.67 vs. 29.78 ± 9.03 | 11.72 ± 1.03 vs. 11.72 ± 1.15 | NR | 167.83 ± 92.35 vs. 201.33 ± 96.5 | NR | N/A |
| 5 | Tang et al. 2020 (13) | 45.33 ± 8.59 vs. 40.7 ± 5.31 | 15.4 ± 1.51 vs. 13.63 ± 0.97 | NR | N/A | N/A | N/A |
| 6 | Fan et al. 2020 (18) | N/A | 11.88 ± 1.55 vs. 11.13 ± 1.41 | NR | 168.33 ± 65 vs. 207 ± 93.33 | NR | N/A |
| 7 | Li et al. 2020 (19) | 37.47 ± 7.17 vs. 35.13 ± 6.30 | 13.93 ± 2.80 vs. 13.33 ± 1.37 | NR | N/A | N/A | 1.13 ± 0.16 vs. 0.69 ± 0.76 |
| 8 | Satici et al. 2020 (20) | N/A | N/A | N/A | 196 ± 47.96 vs. 198.33 ± 60.93 | NR | N/A |
| 9 | Du et al. 2020 (21) | 36.7 ± 8.51 vs. 35.1 ± 6.14 | 14.17 ± 3.18 vs. 13.77 ± 2.09 | NR | N/A | N/A | N/A |
| 10 | Pan et al. 2020 (22) | 37.45 ± 1.86 vs. 38.63 ± 1.69 | 14.15 ± 0.43 vs. 13.67 ± 0.29 | > 13.9 | 187.33 ± 58.78 vs. 191.33 ± 70.34 | ≤187 | N/A |
| 11 | Chen et al. 2020 (12) | 40.92 ± 1.99 vs. 40.72 ± 1.25 | 15.6 ± 0.56 vs. 13.85 ± 0.21 | NR | 160.78 ± 18.95 vs. 203 ± 16.92 | NR | 1.23 ± 0.05 vs. 1.08 ± 0.02 |
| 12 | Gil et al. 2020 (11) | 32.63 ± 1.10 vs. 34.13 ± 1.29 | 13.85 ± 0.22 vs. 14.68 ± 0.45 | NR | N/A | N/A | N/A |
| 13 | Alshukry et al. 2020 (23) | 45.81 ± 3.05 vs. 32.63 ± 1.3 | 15.87 ± 1.04 vs. 13.64 ± 0.35 | NR | 260.35 ± 22.89 vs. 323.92 ± 24.27 | NR | N/A |
| 14 | Ayed et al. 2020 (24) | 41.5 ± 8.5 vs. 38.75 ± 6.68 | N/A | N/A | 216.5 ± 20.66 vs. 261.75 ± 24.9 | NR | 1.16 ± 0.10 vs. 1.03 ± 0.03 |
| 15 | Shi et al. 2020 (25) | 30.48 ± 1.02 vs. 30.03 ± 1.10 | 13.32 ± 0.38 vs. 12.63 ± 0.42 | NR | 168 ± 26.78 vs. 159.75 ± 16.19 | NR | N/A |
| 16 | Luo et al. 2020 (26) | N/A | N/A | N/A | 169.67 ± 73.72 vs. 207.33 ± 82.68 | < 125 | N/A |
| 17 | Zhang et al. 2020 (26) | N/A | N/A | N/A | 140 ± 100.24 vs. 182.33 ± 57.51 | < 125 | N/A |
| 18 | Paranjpe et al. 2020 (28) | 33.57 ± 5.54 vs. 31.63 ± 4.54 | 14.7 ± 2.02 vs. 13.63 ± 1.04 | NR | 189.33 ± 70.79 vs. 197.67 ± 69.82 | NR | N/A |
| 19 | Hu et al. 2020 (29) | N/A | 15.6 ± 2.42 vs. 13.83 ± 0.98 | NR | 171.33 ± 78.39 vs. 211 ± 80.33 | NR | N/A |
| 20 | Fu et al. 2020 (30) | N/A | N/A | N/A | 165.33 ± 50.67 vs. 226 ± 72.64 | NR | N/A |
| 21 | Luo et al. 2020 (31) | N/A | N/A | N/A | 159.33 ± 76.94 vs. 202.67 ± 75.38 | NR | N/A |
| 22 | Wang et al. 2020 (32) | 29.43 ± 3.26 vs. 28.37 ± 4.17 | 12.97 ± 1.64 vs. 12.17 ± 0.52 | NR | 164.67 ± 86.36 vs. 212.67 ± 81.15 | NR | N/A |
| 23 | Yang et al. 2020 (33) | N/A | 12.9 ± 2.9 vs. 10.9 ± 2.7 | NR | 191 ± 63 vs. 164 ± 74 | NR | N/A |
| 24 | Zhou et al. 2020 (34) | N/A | 12.33 ± 1.86 vs. 11.47 ± 1.65 | ≥16 | 167.17 ± 92.92 vs. 219.67 ± 77.17 | < 100 | N/A |
| 25 | Wang et al. 2020 (35) | 41.3 ± 7.32 vs. 39.3 ± 6.05 | 39.37 ± 6.05 vs. 14.9 ± 1.26 | NR | 221 ± 114.0 vs. 230.5 ± 86.5 | NR | N/A |
| 26 | Sai et al. 2021 (36) | 35.87 ± 14.51 vs. 33.63 ± 9.75 | 13.63 ± 3.52 vs. 12.53 ± 1.77 | NR | 173.47 ± 107.84 vs. 225.47 ± 98.79 | NR | N/A |
| 27 | Peiró et al. 2021 (37) | N/A | N/A | N/A | 226.33 ± 118.77 vs. 215.67 ± 90.52 | NR | N/A |
| 28 | Velasco-Rodríguez et al. 2021 (38) | 30.07 ± 4.17 vs. 30.47 ± 3.34 | 13.3 ± 1.41 vs. 12.87 ± 1.19 | > 14 | 199.17 ± 82.96 vs. 198.08 ± 128.54 | < 140 | N/A |
| 29 | Violi et al. 2021 (39) | N/A | N/A | N/A | 204 ± 119 vs. 211 ± 75 | NR | N/A |
| 30 | Gayam et al. 2021 (40) | 31.42 ± 4.76 vs. 31.41 ± 3.95 | N/A | N/A | 215.33 ± 83.19 vs. 226 ± 89.43 | NR | N/A |
Laboratory Parameters in Included Studies a
Funnel plots for INR and aPTT showed an asymmetrical appearance indicating publication bias (Appendix 1). Since less than 10 studies were involved, we did not conduct Egger's regression test for INR. The publication bias for aPTT was also shown by the Egger's test (P = 0.007), but not for PT (P = 0.395) and PLT (P = 0.896).
4.1. Platelet
Random-effects meta-analysis revealed significantly lower platelet counts on admission in the non-survivor group than in the survivor group, as shown in Figure 2 [26 studies, SMD = -0.56 (95% CI: -0.79 to -0.33), P < 0.01; I2 = 94%, P < 0.01]. A similar result was shown in retrospective subgroup analysis. Categorical data of platelet count were found in five studies. Decreased platelet counts were associated with increased mortality [OR = 3.00 (95% CI: 1.66 to 5.41), P < 0.01; I2 = 69%, P = 0.01] (Figure 2). The sensitivity of 58% (95% CI: 38 to 76%) and specificity of 70% (95% CI: 54 to 83%) were obtained from a pooled analysis of multiple cut-off points (Appendix 2). Decreased platelet had a positive likelihood ratio (LR) of 1.9 and a negative LR of 0.6. According to a meta-regression analysis, unlike age (P = 0.023) and HTN (P = 0.014), sex (P = 0.412), CVD (P = 0.580) and DM (P = 0.935) had no impacts on the relationship between decreased platelet count and mortality.

Forest plot of platelet level for mortality outcome. A, Non-survivors had a lower platelet level than survivors; and B, Decreased platelet was associated with increased mortality.
4.2. Prothrombin Time
The pooled effect size demonstrated that PT was significantly higher in non-survivors than in survivors, as shown in Figure 3 [21 studies, SMD = 1.22 (95% CI: 0.71 to 1.72), P < 0.01; I2 = 98%, P < 0.01]. A similar result was shown in retrospective subgroup analysis. Sensitivity analysis by removing Gil et al.’ study (11) showed no improvement in heterogeneity. Pooled analysis of three studies with categorical data of PT demonstrated increased PT in the non-survivor group [OR = 1.86 (95% CI: 1.43 to 2.43), P < 0.01; I2 = 2%, P = 0.36] (Figure 3). According to a meta-regression analysis, age (P = 0.964), sex (P = 0.422), CVD (P = 0.889), DM (P = 0.955), and HTN (P = 0.910) comorbidities had no impact on the relationship between decreased platelet count and mortality.
.")
Forest plot of PT level for mortality outcome. A, Non-survivors had a higher PT level than survivors; and B, Increased PT and mortality (PT, prothrombin time).
4.3. Activated Partial Thromboplastin Time
The pooled effect size demonstrated that aPTT was non-significantly higher in non-survivors than in survivors, as shown in Figure 4 [18 studies, SMD = 0.24 (95% CI: -0.04 to 0.52), P = 0.09; I2 = 93%, P < 0.01]. The prospective group did not differ from the retrospective subgroup, as shown in subgroup analysis based on study design. Nevertheless, the removal of Gil et al.’s study (11) demonstrated a significant result of higher aPTT in non-survivors [SMD = 0.43 (95% CI: 0.06 to 0.58), P = 0.02; I2 = 91%, P < 0.01].
.")
Forest plot of aPTT level for mortality outcome. Non-survivors had a non-significantly higher aPTT level than survivors (aPTT, activated partial thromboplastin time).
4.4. International Normalized Ratio
Higher mean INR was found in non-survivors than in survivors, as shown in Figure 5 [three studies, SMD = 2.21 (95% CI: 0.10 to 4.31), P = 0.04; I2 = 98%, P < 0.01]. Sensitivity analysis by removing Chen et al.’ study (12) showed improvement in heterogeneity [SMD = 1.21 (95% CI: 0.10 to 2.32), P = 0.03; I2 = 88%, P < 0.01].
.")
Forest plot of INR for mortality outcome. Non-survivors had a higher INR level than survivors (INR, international normalized ratio).
5. Discussion
This meta-analysis found that COVID-19 patients with prolonged PT and aPTT, elevated INR, and a lower platelet level on admission had a higher mortality rate. Our results are similar to previous studies (6, 41). The prolongation of PT in the non-survivor group was consistent with another meta-analysis (4). However, the degree of PT prolongation is less prominent in COVID-19 than in bacterial sepsis-induced coagulopathy or disseminated intravascular coagulation (DIC) (42). Mild prolongation of aPTT demonstrated in COVID-19 subjects is possibly explained by the involvement of severe consumption or inhibition to specific coagulation factors (43).
Along with the emerging evidence of SARS-CoV-2, the presence of coagulopathy is one of the major factors responsible for high mortality rates other than cytokine storms (44). Severe infection activates the coagulation cascade and increases DIC risk, consequently increasing the fatality rates (13). Besides, COVID-19 increases the risk of thromboembolism in several organs, as it causes abnormal activation of coagulation and secondary hyperfibrinolysis (45). A first autopsy series to COVID-19-related deaths in New Orleans (46) reported the presence of significant diffuse alveolar damage and pulmonary microvascular thrombosis, possibly contributing to death.
Decreased platelet counts in COVID-19 are possibly caused by hematopoiesis suppression in the bone marrow by the virus. As known, COVID-19 increases autoantibodies and immune complexes, leading to specific immune system disruption of platelets. Lung tissue and pulmonary endothelial cells damage in COVID-19 can activate platelets in the lungs, leading to microthrombi aggregation and formation and increased platelet consumption (47).
In addition, PT and aPTT are beneficial for the early detection of DIC in COVID-19-associated coagulopathy (48). Laboratory characteristics in DIC vary depending on the stage. In early DIC, hemostatic system activation is compensated. As DIC develops into the decompensated stage, which might be found in the late stage of COVID-19, decreased thrombocyte, elevated PT and aPTT, increased fibrinogen, increased fibrin degradation product, and reduced protease inhibition are found (49). Besides, PT, aPTT, and INR are excellent parameters describing clot formation. These parameters do not provide information about fibrin crosslinking or clot dissolution and will thus be insensitive to abnormalities of fibrinolysis. On the other hand, D-dimer indicates recent or ongoing intravascular coagulation and fibrinolysis (50).
Our findings suggest that the abnormality of routine coagulation parameters on admission can be used as risk stratification tools in adult COVID-19 patients. Risk stratification in triage would help health workers allocate resources and sort the patients in the appropriate critical care or modified units, therefore maximizing the use of acute care beds (51). We encourage further studies to develop a prognostic model involving coagulation profiles in COVID-19 outcomes.
To the authors’ knowledge, our review of 30 studies is the largest meta-analysis on the elaboration of coagulation profiles and in-hospital mortality of COVID-19. However, several limitations are found in our study. Publication bias was noted in several coagulation parameters. There was also substantial heterogeneity across studies. Some of the included studies in this meta-analysis were published at the preprint server. The majority of the included studies were retrospective and had limited sample sizes. Furthermore, China was the source of the majority of the studies. Differences in ethnicity and geography can skew the analysis results.
5.1. Conclusions
In COVID-19 patients, abnormal simple coagulation parameters on admission, such as increased PPT and INR and decreased platelets, were related to a higher risk of in-hospital mortality. We recommend clinicians closely monitor routine coagulation parameters as markers for potential progression to critical illness.
