


1. Background
Post-kidney transplantation urinary tract infections (UTIs) are a prevalent complication, with a prevalence of 5% to 36%, increasing the risk of graft loss for patients and incurring additional costs for the healthcare system (1-4). Infection by Enterobacteriaceae producing extended-spectrum β-lactamases (ESBLs) is more serious in immune-deficient and transplanted patients, including kidney transplant patients (KTPs). Despite developing a broad range of antibiotics, enthusiasm for applying these drugs has decreased for several reasons. One of the main complications of conventional antibiotics is global antibiotic resistance, which is progressed to the point where most of the uropathogens, such as quinolone-resistant and β-lactamase producing bacteria, are now resistant to antibiotics, acquired through different mechanisms.
Fosfomycin, a phosphoric acid derivative, is used to combat gram-positive and gram-negative bacteria responsible for lower urinary tract infections and other systemic diseases (4-7). Like any other antibiotic, resistance to fosfomycin is a common event that could be induced either through a chromosomal- or plasmid-mediated manner (6). It should be mentioned that most mutations that lead to intrinsic chromosome-mediated resistance against this antibiotic could not easily transfer to other organisms due to the impaired uptake system. It has been reported that those mutations that target the genes encoding fosfomycin transporters, such as glpT and uhpT, could block the entrance of the drug into the host cells, leading to the induction of acquired fosfomycin resistance. In addition to acquired mutations in transporter genes, resistance to fosfomycin can also be induced through other mechanisms, such as the plasmid's origin of fosfomycin-modifying enzymes, including FosA, FosB (8), FosC (9), and FosX (10). Additionally, the transfer of plasmids between bacteria can also result in resistance to antibiotics other than fosfomycin, such as β-lactams, aminoglycosides, and quinolones. Fosfomycin prescription in Iran during urinary tract infection is not as usual as in other countries. On the other hand, it is not the primary choice.
2. Objectives
The study aimed to estimate the prevalence of fosfomycin resistance and the frequency of ESBL production in Escherichia coli isolates from three KTPs in Tehran.
3. Methods
3.1. Sampling and Study Design
From April to May 2019, urine samples were collected by the mid-stream clean catch method from patients with kidney transplants referred to Labafinejad Hospital and Yekta and Gholhak Private Clinics' laboratories. Escherichia coli was identified based on standard bacterial tests (11). All the confirmed bacteria were kept in 10% glycerol and TSB media at -70°C.
3.2. Sample Size Calculation
The sample size was determined based on a confidence of 95% and accuracy of 0.01% using N = Z (1 - zα/2)2 (p) (q)/d2 formula.
3.3. Antimicrobial Susceptibility Testing
Antimicrobial susceptibility testing (AST) was performed manually and interpreted according to the protocol and breakpoints recommended by the Clinical and Laboratory Standards Institute (CLSI) (12). The following antibiotics were purchased from Mast (England) and Rosco (Denmark) for AST: Ceftriaxone 30 mg, cefotaxime 30 mg, cefixime 30 mg, cefazolin 30 μg, cephalexin 30 mg, ampicillin 10 μg, ampicillin-sulbactam 20/10 μg, piperacillin/tazobactam 100/10 μg, cefpodoxime 30 μg, doripenem 10 μg, imipenem 10 μg, ertapenem 10 μg, meropenem 10 μg, gentamycin 10 μg, tobramycin 10 μg, amikacin 30 μg, ciprofloxacin 5 μg, trimetoprim 5 μg, and nitrofurantoin 200 μg.
3.4. Minimum Inhibitory Concentration
Based on the manufacturer's protocol, fosfomycin's minimum inhibitory concentration (MIC) was determined using the E-test (Liofilchem, Italy). The results were interpreted based on the CLSI guidelines approved for E. coli in UTIs (i.e., susceptible at MICs of ≤ 64 μg/mL or with zones of ≥ 16 mm) (12).
3.5. Phenotypic Screening of Extended-spectrum β-Lactamase Production
Cefotaxime 30 mg (CTX) and ceftazidime 30 mg (CAZ) disks, either alone or in combination with clavulanic acid 10 mg (CA), were used in the Double Disk Synergy Test (DDST) for ESBL production screening according to the CLSI 2020 guideline (12-14). Any increase in diameter of 5 mm or more around either the CTX or CAZ disk when combined with CA, compared to the diameter of these disks alone, indicated the presence of an ESBL-producing bacterial isolate. Simultaneously, two ATCC bacterial isolates, including E. coli ATCC 25922 and K. pneumonia ATCC 700603, were used as the negative and positive controls, respectively.
3.6. DNA extraction, Polymerase Chain Reaction Method, and Sequencing
The DNA was extracted as previously described (15, 16). The frequency of the bla CTX-M, TEM, and SHV genes (17, 18), as well as the fosA3, fosC2, murA, uhpT, glpT, and cyaA genes (19), which are responsible for ESBL production and fosfomycin resistance, were determined using separate polymerase chain reaction (PCR) methods in a 25 µL reaction mixture (20). The primers used in this study and the PCR program are shown in Tables 1 and 2, respectively. Electrophoresis on a 1.5% agarose gel was used for PCR product analysis. Two bacterial strains, including K. pneumoniae ATCC 700603 and a fosfomycin-resistant E. coli isolate (provided by Prof. C. Giske from Karolinska Institute, Sweden), were simultaneously used as positive controls for the PCR test.
| Gene and Primers | Band Size | References |
|---|---|---|
| murA | 1542 | (19) |
| AAACAGCAGACGGTCTATGG | ||
| CCATGAGTTTATCGACAGAAC | ||
| uhpT | 1667 | (19) |
| TTTTTGAACGCCCAGACACC | ||
| AGTCAGGGGCTATTTGATG | ||
| glpT | 1785 | (19) |
| GCGAGTCGCGAGTTTTCATTG | ||
| GGCAAATATCCACTGGCACC | ||
| cyaA | 2773 | (19) |
| AACCAGGCGCGAAAAGTGG | ||
| ACCTTCTGGGATTTGCTGG | ||
| fosA3 | 240 | (19) |
| CCTGGCATTTTATCAGCAGT | ||
| CGGTTATCTTTCCATACCTCAG | ||
| fosC2 | 243 | (19) |
| TGGAGGCTACTTGGATTTG | ||
| AGGCTACCGCTATGGATTT | ||
| CTX-M | 593bp | (19) |
| TTTGCGATGTGCAGTACCAGTAA | ||
| CGATATCGTTGGTGGCATA | ||
| TEM | 800bp | (21) |
| TAATCAGTGAGGCACCTATCTC | ||
| GAGTATTCAACATTTCCGTGTC | ||
| SHV | 1000bp | (19) |
| GCC GGG TTA TTC TTA TTT GTC GC | ||
| ATG CCG CCA GTC A | ||
| rpoD-qPCR | - | (22) |
| CAAGCCGTGGTCGGAAAA | ||
| GGGCGCGATGCACTTCT | ||
| uhpT-qPCR | - | (22) |
| AAGCCGACCCTGGACCTT | ||
| ACGGTTTGAACCACATTTTGC |
| Genes | Initial Denaturation | Denaturation | Annealing Temperature (°C) | Extension | Final Extension | Cycles |
|---|---|---|---|---|---|---|
| blaTEM | 95°C | 95°C | 58 | 72°C | 72°C | 35 |
| 5 min | 30 s | 45 s | 10 min | |||
| blaSHV | 95°C | 95°C | 59 | 72°C | 72°C | 30 |
| 5 min | 30 s | 45 s | 10 min | |||
| blaCTX-M | 94°C | 94°C | 57 | 72°C | 72°C | 30 |
| 5 min | 45 s | 45 s | 10 min | |||
| fOSA3 | 5 min | 45 s | 58 | 45 s | 72°C | 36 |
| 94°C | 94°C | 72°C | 10 min | |||
| fosC2 | 5 min | 45 s | 58 | 45s | 72°C | 36 |
| 94°C | 94°C | 72°C | 10 min | |||
| murA | 5 min | 1 min | 57 | 1 min | 10 min | 35 |
| 94°C | 94°C | 72°C | 72°C | |||
| uhpT | 5 min | 1 min | 58.5 | 1 min | 10 min | 36 |
| 94°C | 94°C | 72°C | 72°C | |||
| glpT | 5 min | 1 min | 58 | 1 min | 10 min | 36 |
| 94°C | 94°C | 72°C | 72°C | |||
| cyaA | 5 min | 1 min | 59 | 1 min | 10 min | 36 |
| 94°C | 94°C | 72°C | 72°C |
Sequencing was done by Bioneer company, Korea, to identify the presumptive mutation(s) among encoding chromosomal fosfomycin resistance genes.
3.7. Carbohydrate Phosphate Transporter Activity
To evaluate any change in the expression rate of the transporter gene uhpT, real-time PCR was done on four suspicious E. coli isolates (one fosfomycin-resistant, one fosfomycin-intermediate, and two fosfomycin susceptible). First, a bacterial culture using Luria-Bertani (LB) broth was prepared and incubated in a 37°C shaker incubator for 24 h. Then, grown cells were harvested, washed twice with M9 minimum salt solution, and then inoculated into M9 minimum salt solution with or without 0.2% glucose-6-phosphate (G6P). The mixture was then incubated for 30 minutes at 37°C (1). The induction effect of G6P on the expression of the uhpT gene and the housekeeping gene rpoD was determined after RNA extraction and cDNA preparation using Bio Fact Kit (South Korea) and real-time PCR by QuantiFast SYBR Green PCR Mastermix (Qiagen). Primer sets for each gene are listed in Table 1, and the ingredients are in Table 3. Data were analyzed using the 2-ΔΔCT method normalized to the housekeeping gene rpoD mRNA levels.
| Master Mix | Volume (µL) |
|---|---|
| Forward primer | 1 |
| Reverse primer | 1 |
| WW | 6 |
| cDNA | 2 |
| Total volume | 10 |
3.8. Statistical Analysis
Statistical analysis was done using SPSS version 22, and the frequency of evaluated genes was determined as a percentage.
4. Results
Among 63 suspicious E. coli isolates, 60 were confirmed as E. coli based on standard bacterial tests. Hence, three isolates were not confirmed as E. coli and were excluded from this study. Also, we excluded E. coli isolates from UTI patients without kidney transplants. We found that 72.5% of the patients were female and 27.5% were male, aged 15 - 65.
4.1. Antimicrobial Susceptibility Testing
The susceptibility of all E. coli isolates was significant to doripenem and ertapenem (100%). However, the maximum resistance rate was to ampicillin, cefotaxime, and cefazolin at 85.9%, 80.1%, and 77.1%, respectively (Table 4 and Figure 1).
| Antibiotic (mg) | Susceptible | Intermediate | Resistance |
|---|---|---|---|
| Ampicillin 30 | 5 (8) | 1 (2) | 54 (90) |
| Amoxicillin-clavulanic acid 30 | 28 (46) | 28 (46) | 4 (8) |
| Ampicillin-sulbactam 20/10 | 26 (44) | 8 (12) | 26 (44) |
| Pipracilin-tazobactam 100/10 | 40 (67) | 6 (8) | 14(24) |
| Cefazolin 30 | 40 (67) | 8 (12) | 12 (20) |
| Cefepime 30 | 27 (45) | 8 (12) | 25 (43) |
| Cefotaxime 30 | 20 (34) | 1 (2) | 39 (65) |
| Doripenem 10 | 60 (100) | 0 (0) | 0 (0) |
| Ertapenem 10 | 60 (100) | 0 (0) | 0 (0) |
| Fosfomycine 200 | 57 (95) | 2 (3) | 1 (1) |
| Imipenem 10 | 57 (95) | 3 (5) | 0 (0) |
| Meropenem 10 | 60 (100) | 0 (0) | 0 (0) |
| Amikacin 30 | 40 (66) | 10 (17) | 10 (17) |
| Tobramycin 10 | 41 (68) | 10 (17) | 9 (15) |
| Trimethoprim 5 | 10 (17) | 13 (22) | 37 (61) |
| Nitrofurantoin 200 | 48 (83) | 6 (8) | 6 (8) |
| Ciprofloxacin 5 | 16 (27) | 4 (6) | 40 (67) |
| Gentamicin 10 | 48 (71) | 6 (8) | 6 (8) |
| Cefpodoxime 30 | 20 (34) | 2 (2) | 38 (64) |
a Values are expressed as No. (%).
")
Frequency of the high and low antibiotic resistance rate among Escherichia coli isolates from kidney transplant patients (KTPs)
4.2. Minimum Inhibitory Concentration of Fosfomycin by E-Test
The fosfomycin E-test method was used for MIC detection. According to the CLSI 2020 protocol, MICs above 128 µg/mL were considered resistant. According to the results, out of 60 samples, one was resistant, and two were intermediate. Based on the results, 57/60 E. coli isolates were susceptible, and their MICs were between 0.125 and 48 µg/mL. Two samples were intermediate (MIC of 64 µg/mL), and one was resistant (MIC 256 µg/mL) to fosfomycin (Table 5). According to the phenotype test, resistance to fosfomycin in our samples was 1.6%.
| Fosfomycin - Resistant Rate | ESBL Production | ESBL Genes | Fosfomycin MIC (µg/mL) | Fosfomycin Resistance Genes | |||||||
|---|---|---|---|---|---|---|---|---|---|---|---|
| Plasmid Genes | Chromosomal Genes | ||||||||||
| R | + | bla CTX-M + | bla SHV + | bla TEM + | 256 | fosA3 - | fosC2 - | murAa Leu 370 lle, Asp369 Asn | glpTb Thr 421 | uhpTb Glu 429 | cyaA NM |
| I | + | bla Ctx-M + | bla SHV - | bla TEM + | 64 | fosA3 - | fosC2 - | murANM | glpT NM | uhpTNM | cyaANM |
| I | + | bla CtxM + | bla S HV + | blaT EM + | 64gur | fosA3 - | fosC2 - | murA NM | glpT NM | uhpT NM | cyaA NM |
Abbreviations: ESBL, extended-spectrum beta-lactamase; MIC, minimum inhibitory concentration; I, intermediate; R, resistant; ND, not detected; NM, no mutation; +, positive for a gene; -, negative for a gene; Thr, threonine; Gl, glutamate.
a Type of mutation: Substitution,
b Type of mutation: Deletion.
4.3. Frequency of Extended-Spectrum Beta-Lactamase Produced by DDST
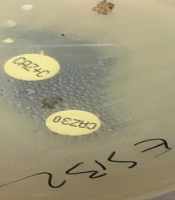
Based on the CLSI, the percentage of ESBL-producing E. coli in KTPs was found to be 33.5% (Figure 2).

Extended-spectrum beta-lactamase detection by Double Disk Synergy Test. CAZ: Ceftazidime, CAZ+C: Ceftazidime/clavulanic acid disks. The increased diameter of the inhibition zone around the ceftazidime /clavulanic acid is shown in this figure.
4.4. Frequency of Extended-Spectrum Beta-Lactamase Genes and Fosfomycin-Resistant Genes by PCR
The ESBL-responsible genes among E. coli isolates were blaTEM (55%), blaCTX-M (51.1%), and blaSHV (41%). Among the fosfomycin-resistant genes, we failed to find any fos A3 and fos C2 plasmid genes despite mutations detected among the chromosomal murA, glpT, and uhpT genes (Table 5 and Figures 3, 4, 5 and 6).

Detection of the murA gene by gel electrophoresis. Wells 1 and 2 are positive controls. Wells 3 and 4 are negative controls. Wells 5 to 9 are the first to fifth samples, and well 10 is the ladder.

Detection of fosA3 gene by gel electrophoresis. Well, 1 is the ladder, and well 2 is negative control. Well, 3 is a positive control. Wells 4, 5, and 6 are the first, second, and third samples, respectively.

Detection of the glpt gene by gel electrophoresis. Well 1 is the ladder, well 2 is the control sample, well 3 is the positive control, and well 4 is the negative control sample. Wells 5 to 10 are the first to sixth samples, respectively.

Detection of the uhpT gene by gel electrophoresis. Well 1 is the ladder, well 2 is the control sample, well 3 is a positive control, and well 4 is the negative control sample. Wells 5 to 10 are the first to sixth samples, respectively.
Chromosomal mutations were identified in a resistant E. coli isolate and two intermediate isolates. These mutations resulted in the deletion of certain amino acid residues in the uhpT and glpT genes, respectively. In detail, after data alignment in the gene bank, two mutations in the murA gene, which lead to amino acid replacement (Leu 370 lle, Asp 369 Asn), were detected in two intermediate E. coli isolates. In the resistant E. coli isolate, we also detected a deletion mutation in 421 threonines encoding the uhpT gene. No mutation was detected in the cyaA gene among fosfomycin-resistant E. coli isolates (Table 5, Figure 7).

Detection of the cyaA gene by gel electrophoresis. Wells 3 to 6 are samples; wells 1, 2, 3, and 7 are the negative control, well 8 is the positive control, and well 9 is the ladder.
4.5. Evaluation of uhpT Gene Expression by Real-time PCR
According to the real-time PCR test of the uhpT gene on one fosfomycin-resistant, two intermediate, and two susceptible E. coli isolates, the expression rate of only one fosfomycin-susceptible isolate was increased by 32 times. We did not detect any increase in the expression of the uhpT gene in the intermediate and resistant bacterial isolates (Figures 8, 9A and B).

The graph of real-time polymerase chain reaction
, intermediate (I), and resistant (R) isolates; B, comparison and fold changes of <i>uhpT</i> gene expression between susceptible (S) and intermediate (I) bacterial isolates.")
Relative gene expression and fold changes of S, I, and R Escherichia coli isolates. A, relative gene expression of susceptible (S), intermediate (I), and resistant (R) isolates; B, comparison and fold changes of uhpT gene expression between susceptible (S) and intermediate (I) bacterial isolates.
5. Discussion
While some reports suggested the low incidence of drug resistance to fosfomycin, others suggested controversial results (19, 23). Moreover, in another study, the extent of resistance to other antimicrobial agents was greater in fosfomycin-resistant and intermediate E. coli isolates than in fosfomycin-susceptible strains. This study was conducted based on the significance of monitoring fosfomycin-resistant E. coli to prevent the development of cross-resistance and multidrug resistance to other antibiotics, as indicated by previous research. The current results show that resistance to fosfomycin was low (1.6%). Only one E. coli strain was found to be resistant to fosfomycin, and two strains were classified as intermediate out of 60 clinical isolates from UTIs of KTPs who were admitted to three main centers in Tehran in the current study. Also, we found a high resistance rate to ampicillin (86%), cefotaxime (80%), and cefazolin (77%) among E. coli isolates from UTIs of KTPs, which is in line with the results of previous studies conducted in Iran (24, 25). However, ESBL-producing E. coli infection is commonly associated with a significantly longer hospital stay and greater hospital costs (19), despite the hypothesis that there is evidence of a higher rate of fosfomycin resistance among ESBL-producing E. coli (20), such a relationship was not detected in this study.
Our results showed that the most frequent ESBL genes were blaTEM (55%), blaCTX-M (51%), and blaSHV (41%). In the study of Haddadi et al. from Alborz, Iran, 61% of E. coli isolates harbored blaTEM as the most frequent ESBL gene, similar to a recent study (18). Moreover, in a recent study, only a single substitution (Leu370lle, Asp369Asn) was identified in the murA gene sequence. This kind of mutation in the murA gene was identified in one of the intermediate E. coli isolates in this study (20). Furthermore, the current study is consistent with the findings of Sorlozano-Puerto et al. regarding the mutations of Asp 369 Asn and Leu 370 Ile in fosfomycin-resistant E. coli isolates MSC17327 and MSC17323 (20, 26). However, an inspection of the crystal structure of the E. coli MurA gene in complex with fosfomycin does not suggest an obvious role for Asp-369 and Leu-370 in the interaction between the protein and the inhibitor (20). In fact, fosfomycin transportation into cells is mediated by two pathways: The glycerol-3-phosphate transport system or the hexose phosphate transport system. Given this, several reports have suggested that one of the chromosomal mechanisms leading to fosfomycin resistance could be mediated through defects in the glpT or uhpT genes (20). The deletion in the coding region of the glpT gene leads to the formation of a truncated glpT gene. Other studies have also suggested that fosfomycin resistance in E. coli strains can be induced by any alteration in the chemical structure of fosfomycin caused by fosA3, a protein encoded by the fosA3 gene (20). However, when we evaluated the existence of fosA3 and fosC genes among our E. coli isolates, no alteration in fosA3 and fosC2 genes was detected. This finding contrasts the Li et al. study from China, which declared the fosA3 gene the main cause of fosfomycin resistance among E. coli isolates (20). This may be related to fewer prescriptions of fosfomycin in UTI cases in Iran.
In Ghanavati et al. study (2016 - 2017) in Iran, 92.8% of isolates were fosfomycin-susceptible, and none of the ESBL-producing Enterobacteriaceae isolates harbored any mutated or plasmid genes (24). In the study of Bahramiyan et al. in Iran, 8% of E. coli isolates from different patients, including dialysis patients, were fosfomycin-resistant (25). Although the resistance rate to fosfomycin in Enterobacteriaceae, including E. coli isolates, was low, both studies reported a higher resistance rate (almost 8%) to fosfomycin than the recent study (1.6%). Also, in Bahramiyan et al. (25) study, 76% of E. coli isolates, and in Ghanavati et al. (24) study, 42% of Enterobacteriaceae isolates were ESBL producers, which was higher than 33% of E. coli isolates in the recent study. Such differences may be related to the variety of origins and the fact that Ghanavati et al. (24) and Bahramiyan et al. (25) studies included different members of Enterobacteriaceae, whereas the current study only included E. coli isolates from UTIs of KTPs. However, a similar resistance rate to ampicillin was detected in both studies mentioned in Iran, and the highest susceptibility was observed towards imipenem, which is consistent with the current study's findings.
Different mutations in murA, glpT, and uhpT chromosomal genes were detected in a recent study among E. coli isolates from KTPs. Ghanavati et al. (24) declared that no plasmid genes or mutation in chromosomal genes were responsible for fosfomycin resistance among Enterobacteriaceae isolates. Also, Bahramiyan et al. (25) showed that fosA3 and fosC2 plasmid genes were undetected among fosfomycin-resistant E. coli isolates. Similar to the recent study, both of these studies declared no plasmid genes responsible for fosfomycin resistance among E. coli isolates. Fortunately, the absence of plasmid-borne fosfomycin-resistant genes reduces the likelihood of these genes being disseminated among bacteria.
Neither Ghanavati et al. (24) nor Bahramian et al. (25) (both from Iran) reported mutations or evaluated any fosfomycin chromosomic-resistant genes in their studies. Based on our knowledge, it is the first time that such mutations in murA, glpT, and uhpT genes among fosfomycin-resistant E. coli isolates from Tehran have been reported in the recent study. However, further studies with higher sample sizes are needed to determine the role of such chromosomal mutations.
According to Ohkoshi et al., study, higher expression of the uhpT gene in the presence of G6P was detected in fosfomycin-susceptible E. coli isolates (23). Furthermore, Kurabayashi et al. demonstrated that fosfomycin resistance in EHEC is controlled by a two-component signal transduction system called CpxAR. They demonstrated that the cpxA mutant, which lacks phosphatase activity, exhibits CpxR activity and resistance to fosfomycin (22). However, the function of the CpxAR system was not evaluated in this study. Nevertheless, it was observed that induction of susceptible isolates by G6P resulted in a 32-fold increase in uhpT expression compared to one resistant and two intermediate E. coli isolates.
In Seok et al. study from South Korea, the activity of fosfomycin in E. coli isolates from different origins was evaluated. They found that 6.7% of bacterial isolates were fosfomycin-resistant, only two isolates carried the fosA3 gene, and diverse mutations were detected in murA, uhpT, and glpT genes. Although the fosfomycin resistance rate was low in our study (1.6%) compared to 6.7% in the study by Seok et al., no fosA3 gene was detected. However, the main cause of fosfomycin resistance was mutations in three main chromosomal genes, including uhpT, glpT, and murA genes with phosphatase activity, in both studies. Similarly, amino acid substitutions or insertions in GlpT, UhpT, and MurA were found in eight, one, and two fosfomycin-resistant isolates, respectively. Only one mutation, A16T in GlpT, was identified in multiple fosfomycin-resistant E. coli isolates belonging to the same genotype. If the mutations in our samples differed from this mutation, it would suggest a different mechanism of resistance (27).
According to Garallah and Al-Jubori from Iraq, mutations in the glpT and uhpT genes act as efflux pumps and exclude fosfomycin from bacterial cells, leading to fosfomycin resistance in E. coli isolates from UTIs in their region (28). In the Bahy et al. study, similar to ours, there was no resistance to fosfomycin via plasmidic fos A and fos C2. However, over 75% of the resistance observed in this study was attributed to the presence of the fos A3 gene (29). This result encourages us to investigate the presence of the plasmid-borne fosA3 gene in our upcoming study.
5.1. Conclusions
The present study showed that ESBL producers are increasing among E. coli isolates from UTIs of KTPs, which may lead to higher treatment costs and mortality rates. Also, this study found no association between fosfomycin-resistant and intermediate E. coli isolates and ESBL production or their genes. Due to the emergence of fosfomycin resistance in E. coli isolates in this study, we recommend continuous monitoring of antibiotic resistance mechanisms, attention to infection control guidelines, use of sensitive laboratory diagnostic methods, and close relationship between physicians and laboratories.
