1. Background
The Lyssavirus genus and Rhabdoviridae family of viruses, which includes the rabies virus, are responsible for the zoonotic disease known as rabies (1). Taxonomically, lyssaviruses are categorized according to changes in nucleoprotein antigens. The first of the six genotypes is represented by the rabies virus. In more than 150 nations, rabies is expected to claim the lives of 59,000 individuals annually, with 95% of cases happening in Africa and Asia (2). Due to extensive underreporting and hazy estimations, this number probably underestimates the true burden of the disease (3).
Ninety-nine percent of human cases of rabies are brought on by dog bites, which are the disease’s most prevalent reservoir and vector. The most cost-effective method of preventing rabies in humans is by immunizing dogs (4). Iran has a vaccination program that is the first choice for containing and eradicating the rabies virus. The program is supported by other initiatives to ascertain whether it is effective, such as surveys following vaccination, bite reporting, and cold chain management, in addition to a targeted elimination program that considers animal welfare, proper veterinary medication handling, and a coordination system (5).
In affluent nations, rabies vaccinations based on MRC-5 cells, a human fibroblast cell line, Vero cells, a continuous vervet monkey kidney cell line, and baby hamster kidney fibroblasts (BHK cells), heteroploid cells, are already accessible (4). Due to their productivity for rabies virus growth and their capacity to grow in suspension in large-scale bioreactors, a number of cell lines, including the permanent BHK-21 cell line, have been regarded as promising candidates for producing efficient cell-based rabies vaccines at a reasonable cost (5, 6). Optimizing viral productivity is a different method for creating a low-cost rabies cell-culture vaccine (7). By enhancing the upstream process’ productivity, this technique increases the number of vaccine doses produced per run (8).
There are various methods that can be applied to optimize a process. The traditional optimization strategy entails individually testing each process variable (9). This necessitates the execution of numerous expensive and time-consuming experiments. One of the most important considerations in the design of experiment technique is choosing an appropriate experimental design. Numerous studies in the literature discuss the traits of the most popular experimental designs. The most popular choice for a response surface planned experiment is a central composite design (CCD).
By adding center and axial points to an existing factorial design, we can effectively estimate first- and second-order terms and model a response variable with curvature using a CCD. A central composite method, however, employs numerous progressive tests to analyze numerous elements concurrently and swiftly pinpoint the crucial ones. As an illustration, a CCD in 2016 optimized the growth and biomass production of Haemophilus influenza type B (8). The optimal combination that will result in the best performance is then predicted using these control factors. One of the advantages of cell culture-based rabies vaccines is their safety.
2. Objectives
The objective of this study was to maximize the output of an animal rabies vaccine made on BHK cells. To achieve high viral production, this study used the central composite approach to optimize cell development.
3. Methods
3.1. Cell Line and Culture Media
The BHK-21 cell line (baby hamster kidney) and 5% fetal bovine serum (FBS) (Life Technologies, USA) with Dulbecco’s Modified Eagle’s Medium (DMEM) (Life Technologies, USA) with 2.5 g/L bicarbonate were used for cell culture, which was obtained from the Cell Bank Department of Pasteur Institute of Iran. It was previously tested for the absence of mycoplasma. The inoculated cells were incubated at 37°C with 5% CO2.
3.2. Growth Assay
In this study, 250 mL spinner flasks with 200 mL of cultured cells and an initial concentration of 3 × 10⁷ cells per mL were used for the cultures, which were carried out at 37°C in an incubator with 5% CO2 and 37°C. The cells were grown in DMEM supplemented with 0.2 mM for each of serine and methionine and 10% FBS. Samples were taken daily to measure cell concentration. The stirring speed was maintained at 30 rpm.
3.3. Cell Counting
The BHK-21 cells grown in clumps were trypsinized and counted in the presence of 0.2% trypan blue. The exponential growth function was used to calculate the specific growth rate as follows:
Where X denotes the viable cell density per mL (sampling is taken every 1 hour), and t is the time points expressed in hours.
3.4. Virus Strain and Cell Infection
The PV-PARIS/BHK strain is used to create veterinary vaccines. It was developed from the PV-CEPANZO strain of stable rabies, which was first serially transmitted through young rabbits (PV-PARIS). The PV-PARIS fixed rabies virus 93127 FRA was obtained for this purpose from the Institut Pasteur in Paris, France, and used to infect BHK-21 C-13 cells. The PV-PARIS rabies virus strain was introduced into BHK-21 cells with a cell density of 1 × 10⁶ cells/mL and an infection multiplicity of 0.1 cells, and they passed the initial infection stage for 2 hours in a shaker incubator.
3.5. Bioreactor Cultures
For this purpose, a 10-liter bioreactor (Inceltech, Toulouse, France) was used, in which Spanner flask cells that have passed the initial stage of infection are injected into the bioreactor. The infection proliferation stage was carried out under the following conditions:
Temperature 37°C, pH 7.1, air saturation at 70%, and stirring conditions at 40 rpm
In this case, daily samples were collected to measure cell count and cell viability, virus titer, and infection.
3.6. Bioprocess Optimization Using Design-of-Experiments Methodology
The statistical design of the experiments was used to optimize operational parameters of viral yield for BHK cells producing rabies vaccine in a bioreactor where the parameters dissolved oxygen (DO), cell density, temperature, and pH are measured.
3.7. Rabies Virus Titration
In order to compare the production quantity of the modified virus, its titer is evaluated in comparison to the titer of the original virus. In this method, rabies virus suspension in cell culture can be measured by the focus forming assay. Therefore, in this method, the antibody attached to the fluorescent material is attached to each virus particle and can be detected within 24 hours, and the virus titer is expressed as Fluorescent Focus Units (FFU/mL). Briefly, several serial dilutions of the virus are inoculated into the cell culture in duplicate, and the number of FFU of each dilution is counted after 24 hours. In this method, first, in a cell culture flask, BSR cells are cultured, and the cell suspension is prepared with the accumulation of 1 million cells per milliliter. Additionally, successive one-tenth dilutions are prepared from the viral solution in test tubes. In an eight-well Lab-Tek slide, 200 microliters of cell suspension, equivalent to 200,000 cells, are added to each well, and then 100 microliters of each virus dilution are added to each well. The resulting slide is placed at 37 degrees for 24 hours. Then, the liquid on top of the cells is removed and poured into a waste container containing disinfectants. In the next step, Lab-Tek lamella is washed with phosphate-buffered saline (PBS). The slide is placed in a container containing cold pure acetone for 30 minutes. The amount of 25 microliters of rabies virus anti-nucleocapsid antibody conjugated with fluorescein isothiocyanate (FITC) is poured on all areas with cells and placed at 37 degrees for one hour. Finally, the slides are studied using an ultraviolet (UV) microscope. The calculation of initial virus concentration is done using the following formula:
The number of cells containing viral particles in the well × the dilution factor × 10 = The number of viruses (per milliliter of the initial solution)
3.8. Plaque Assay for Infectivity
To determine the number of plaque-forming units (PFUs), serially diluted in vitro reaction mixtures were used by standard methods (Rueckert and Pallansch, 1981). Briefly, first, BHK-21 cells are grown to confluency on 60-mm Petri dishes and, therefore, exposed to the serial dilutions of the virus that are made up of DMEM containing 2% FBS (0.25 mL) for 30 minutes at room temperature. Finally, the cells are covered with 2.5 mL of medium containing 0.6% Noble agar (prepared in a 44°C water bath), and plaques are allowed to grow at 37°C and 5% CO2 for 26 hours. The cell monolayers are stained with 0.1% crystal violet in 20% ethanol, and after washing the dishes with water, the plaques appear as transparent spots (typically 1 to 2 mm in diameter) on a blue background of cells.
3.9. Virus Harvest Inactivation
After 72 hours, the bioreactor’s supernatant containing the grown virus was collected and cleared by low-speed centrifugation for 15 minutes at 3000 g, removing cell debris. This was subsequently deactivated by beta-propiolactone (BPL) (HiMedia, India). Because the complete inactivation of the rabies virus can be achieved at this dilution without lowering the antigenicity properties of the rabies vaccine, the final concentration of the BPL used was 1/3000. Additionally, the deoxyribonucleic acid (DNA) of the remaining cell is sufficiently broken and inactivated at this dilution (Laboratory techniques in rabies).
3.10. Statistical Analysis and Model Validation
The CCD experiment generated all of the data, which were then submitted to multiple regression analysis using least squares to create the regression models. To fit the data, a second-order (quadratic) function was applied. Utilizing Design Expert 13 statistical software, several tasks, including experimental design, data analysis, interaction plotting, and factor condition optimization, were completed. Predicted responses were plotted against experimentally derived data in Excel 2019 to confirm model fits. A P-value less than 0.05 was considered significant.
4. Results
4.1. Central Composite Analysis
Several experiments were carried out using the CCD technique to examine the impact of process variables (i.e., pH, cell density, DO, and temperature) on virus yield optimization (Tables 1 and 2). According to the data in Tables 1 and 2, the amount of response PFU was also calculated, as shown in Table 3. A second-order polynomial equation of coded units was expressed based on the CCD and input variables to show relationships between the responses and independent parameters.
| Symbol | Factors | Range |
|---|---|---|
| X1 | pH | 7.17 - 7.31 |
| X2 | Temperature (ºC) | 34.70 - 36.10 |
| X3 | Dissolved oxygen (DO) (%) | 67.80 - 71.50 |
| X4 | Cell density (cell/mL) | 1.7×10⁶ - 2.50×10⁶ |
Experimental Parameters and Their Levels in a Central Composite Design
| No | Factors | |||
|---|---|---|---|---|
| pH | Temperature (ºC) | DO (%) | Cell Density (Cell/mL) | |
| 1 | 7.21 | 35.75 | 70.58 | 1.90×10⁶ |
| 2 | 7.21 | 35.05 | 70.58 | 1.90×10⁶ |
| 3 | 7.24 | 35.40 | 69.65 | 2.10×10⁶ |
| 4 | 7.28 | 35.75 | 70.58 | 1.90×10⁶ |
| 5 | 7.28 | 35.75 | 70.58 | 2.30×10⁶ |
| 6 | 7.24 | 35.40 | 67.80 | 2.10×10⁶ |
| 7 | 7.21 | 35.05 | 68.72 | 2.30×10⁶ |
| 8 | 7.28 | 35.05 | 68.72 | 2.30×10⁶ |
| 9 | 7.24 | 35.40 | 69.65 | 2.10×10⁶ |
| 10 | 7.24 | 35.40 | 69.65 | 2.10×10⁶ |
| 11 | 7.28 | 35.75 | 68.72 | 1.90×10⁶ |
| 12 | 7.24 | 35.40 | 69.65 | 1.70×10⁶ |
| 13 | 7.21 | 35.05 | 70.58 | 2.30×10⁶ |
| 14 | 7.21 | 35.05 | 68.72 | 1.90×10⁶ |
| 15 | 7.21 | 35.75 | 68.72 | 1.90×10⁶ |
| 16 | 7.28 | 35.75 | 68.72 | 2.30×10⁶ |
| 17 | 7.21 | 35.75 | 70.58 | 2.30×10⁶ |
| 18 | 7.24 | 36.10 | 69.65 | 2.10×10⁶ |
| 19 | 7.24 | 35.40 | 69.65 | 2.10×10⁶ |
| 20 | 7.28 | 35.05 | 70.58 | 1.90×10⁶ |
| 21 | 7.24 | 34.70 | 69.65 | 2.10×10⁶ |
| 22 | 7.24 | 35.40 | 69.65 | 2.10×10⁶ |
| 23 | 7.21 | 35.75 | 68.72 | 2.30×10⁶ |
| 24 | 7.28 | 35.05 | 70.58 | 2.30×10⁶ |
| 25 | 7.24 | 35.40 | 69.65 | 2.50×10⁶ |
| 26 | 7.31 | 35.40 | 69.65 | 2.10×10⁶ |
| 27 | 7.24 | 35.40 | 69.65 | 2.10×10⁶ |
| 28 | 7.17 | 35.40 | 69.65 | 2.10×10⁶ |
| 29 | 7.28 | 35.05 | 68.72 | 1.90×10⁶ |
| 30 | 7.24 | 35.40 | 71.50 | 2.10×10⁶ |
Central Composite Design Matrix
| No | Factors | Response (PFU/mL) | |||
|---|---|---|---|---|---|
| X1 | X2 | X3 | X4 (Cell/mL) | ||
| 1 | 7.21 | 35.75 | 70.58 | 1.90×10⁶ | 4.1×10⁷ |
| 2 | 7.21 | 35.05 | 70.58 | 1.90×10⁶ | 3.8×10⁷ |
| 3 | 7.24 | 35.40 | 69.65 | 2.10×10⁶ | 4.1×10⁷ |
| 4 | 7.28 | 35.75 | 70.58 | 1.90×10⁶ | 4.0×10⁷ |
| 5 | 7.28 | 35.75 | 70.58 | 2.30×10⁶ | 3.8×10⁷ |
| 6 | 7.24 | 35.40 | 67.80 | 2.10×10⁶ | 4.0×10⁷ |
| 7 | 7.21 | 35.05 | 68.72 | 2.30×10⁶ | 4.7×10⁷ |
| 8 | 7.28 | 35.05 | 68.72 | 2.30×10⁶ | 4.4×10⁷ |
| 9 | 7.24 | 35.40 | 69.65 | 2.10×10⁶ | 4.1×10⁷ |
| 10 | 7.24 | 35.40 | 69.65 | 2.10×10⁶ | 4.2×10⁷ |
| 11 | 7.28 | 35.75 | 68.72 | 1.90×10⁶ | 3.7×10⁷ |
| 12 | 7.24 | 35.40 | 69.65 | 1.70×10⁶ | 3.6×10⁷ |
| 13 | 7.21 | 35.05 | 70.58 | 2.30×10⁶ | 4.2×10⁷ |
| 14 | 7.21 | 35.05 | 68.72 | 1.90×10⁶ | 4.2×10⁷ |
| 15 | 7.21 | 35.75 | 68.72 | 1.90×10⁶ | 3.6×10⁷ |
| 16 | 7.28 | 35.75 | 68.72 | 2.30×10⁶ | 4.1×10⁷ |
| 17 | 7.21 | 35.75 | 70.58 | 2.30×10⁶ | 4.5×10⁷ |
| 18 | 7.24 | 36.10 | 69.65 | 2.10×10⁶ | 4.3×10⁷ |
| 19 | 7.24 | 35.40 | 69.65 | 2.10×10⁶ | 4.4×10⁷ |
| 20 | 7.28 | 35.05 | 70.58 | 1.90×10⁶ | 4.0×10⁷ |
| 21 | 7.24 | 34.70 | 69.65 | 2.10×10⁶ | 4.5×10⁷ |
| 22 | 7.24 | 35.40 | 69.65 | 2.10×10⁶ | 4.3×10⁷ |
| 23 | 7.21 | 35.75 | 68.72 | 2.30×10⁶ | 4.3×10⁷ |
| 24 | 7.28 | 35.05 | 70.58 | 2.30×10⁶ | 3.7×10⁷ |
| 25 | 7.24 | 35.40 | 69.65 | 2.50×10⁶ | 4.1×10⁷ |
| 26 | 7.31 | 35.40 | 69.65 | 2.10×10⁶ | 4.1×10⁷ |
| 27 | 7.24 | 35.40 | 69.65 | 2.10×10⁶ | 4.3×10⁷ |
| 28 | 7.17 | 35.40 | 69.65 | 2.10×10⁶ | 4.5×10⁷ |
| 29 | 7.28 | 35.05 | 68.72 | 1.90×10⁶ | 4.2×10⁷ |
| 30 | 7.24 | 35.40 | 71.50 | 2.10×10⁶ | 3.9×10⁷ |
Central Composite Design Matrix with Response a
4.2. Cell Infection
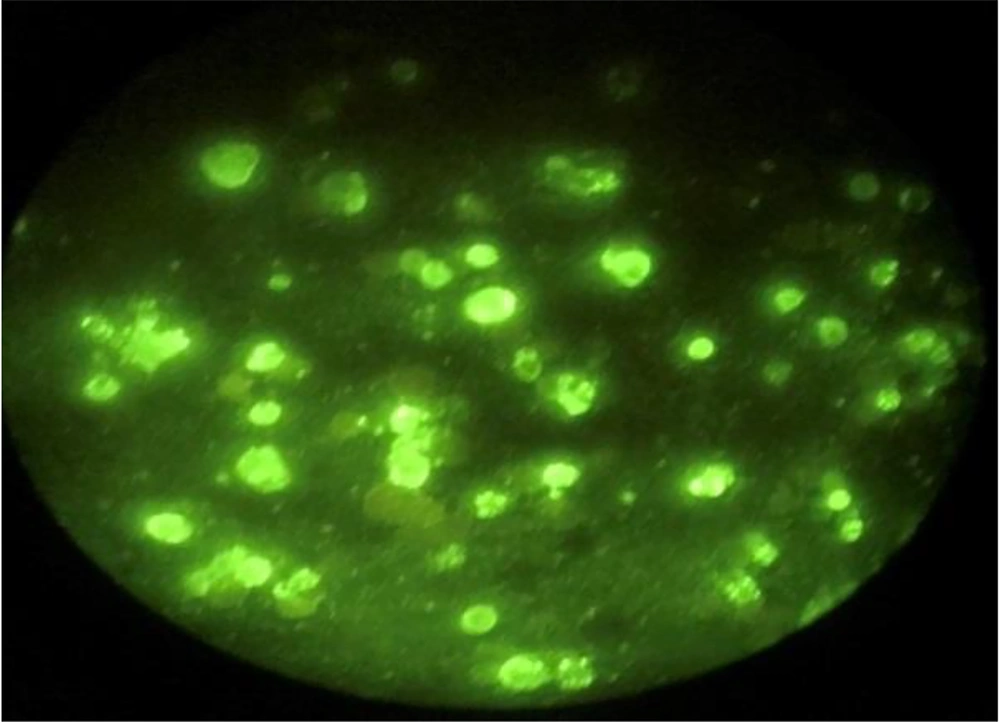
To check cell infection, the immunofluorescence method was used, and by using rabies nucleocapsid, the ratio of infected to uninfected cells was observed and reported as a percentage (Figure 1).
4.3. Analysis of Variance Parameters: Cell Density, Dissolved Oxygen, pH, and Temperature
The results of the analysis of variance for the model are shown in Table 4. The importance of each parameter is determined by the F-value and P-value. In this model, all the parameters except X1X2, X1X3, X2X4,
Lack of Fit is the other important parameter that expresses the fraction of the sum of squares remaining, which occurs due to the inefficiency of the model. A good non-fit model should have a low value. The difference with the response’s P-value of 0.7575 shows that the second-order equation suggested for this project is valid.
| Source | Sum of Squares | DF | Mean of Squares | F-Value | P-Value |
|---|---|---|---|---|---|
| Model | 2.11 | 14 | 0.15 | 13.77 | < 0.0001 |
| x1 | 0.22 | 1 | 0.22 | 20.14 | 0.0004 |
| x2 | 0.094 | 1 | 0.094 | 8.57 | 0.0104 |
| x3 | 0.070 | 1 | 0.070 | 6.43 | 0.0228 |
| x4 | 0.40 | 1 | 0.40 | 36.59 | < 0.0001 |
| x1x2 | 0.0056 | 1 | 0.0056 | 0.51 | 0.4844 |
| x1x3 | 0.031 | 1 | 0.031 | 2.80 | 0.1151 |
| x1x4 | 0.23 | 1 | 0.23 | 20.62 | 0.0004 |
| x2x3 | 0.39 | 1 | 0.39 | 35.69 | < 0.0001 |
| x2x4 | 0.016 | 1 | 0.016 | 1.43 | 0.2507 |
| x3x4 | 0.14 | 1 | 0.14 | 12.85 | 0.0027 |
| 0.0024 | 1 | 0.0024 | 0.22 | 0.4456 | |
| 0.032 | 1 | 0.032 | 2.96 | 0.1058 | |
| 0.17 | 1 | 0.17 | 15.30 | 0.0014 | |
| 0.29 | 1 | 0.29 | 26.65 | 0.0001 | |
| Residual | 0.16 | 15 | 0.011 | ||
| Lack of fit | 0.091 | 10 | 9.083E - 003 | 0.62 | 0.7575 |
| Pure error | 0.073 | 5 | 0.015 | ||
| Cor total | 2.27 | 29 |
Analysis of Variance of Quadratic Response Level
4.4. Regression Analysis
It is necessary to investigate some statistical parameters before introducing the fitting model. The correlation coefficient (R-squared [R2]) is a measure of the fitting of the predicted model with the data resulting from the experiments. The adjusted R-squared (R2Adj) or the corrected correlation coefficient, such as R2, is an indicator for showing the model’s usefulness; however, more precisely, it considers degrees of freedom. The strength of the model is predicted to be examined using the predicted residual error sum of squares (PRESS), where the lower the parameter, the more sensitive the model is to its positive data. The predicted R-squared (R2Pred), or the predicted correlation coefficient, is a combination of the PRESS and R2, and the higher the value is, the more powerful the model will be. The signal-to-noise ratio of the model, which should be greater than 4 for the model under consideration, indicates that the model is accurate enough (10).
A quadratic model has been selected to predict the response, as shown in Table 5. The high correlation coefficient (0.9278) in this model confirms that the predicted model closely matches the data.
| Model | R2 | R2Adj | R2Pred | PRESS | SD |
|---|---|---|---|---|---|
| Quadratic | 0.9278 | 0.8604 | 0.7234 | 0.63 | 0.610 |
Statistical Parameters Considered to Prove the Adequacy of the Quadratic Model
The values of R2Adj and R2Pred were accurately obtained in this model, and their closeness to 1 indicates a good relationship between the experimental results and the expected results. The anticipated model has a low PRESS value (0.63), which represents the sensitivity and power of the model. In addition, the model’s adequate precision is 15.546 > 4, which denotes a favorable signal-to-noise ratio. On the other hand, the high accuracy of the expressed model is expressed by the low value for the model’s standard deviation (0.61).
4.5. Diagnostic Tools
In addition to statistical parameters, there are several diagnostic instruments to demonstrate the suitability of the anticipated model as follows:
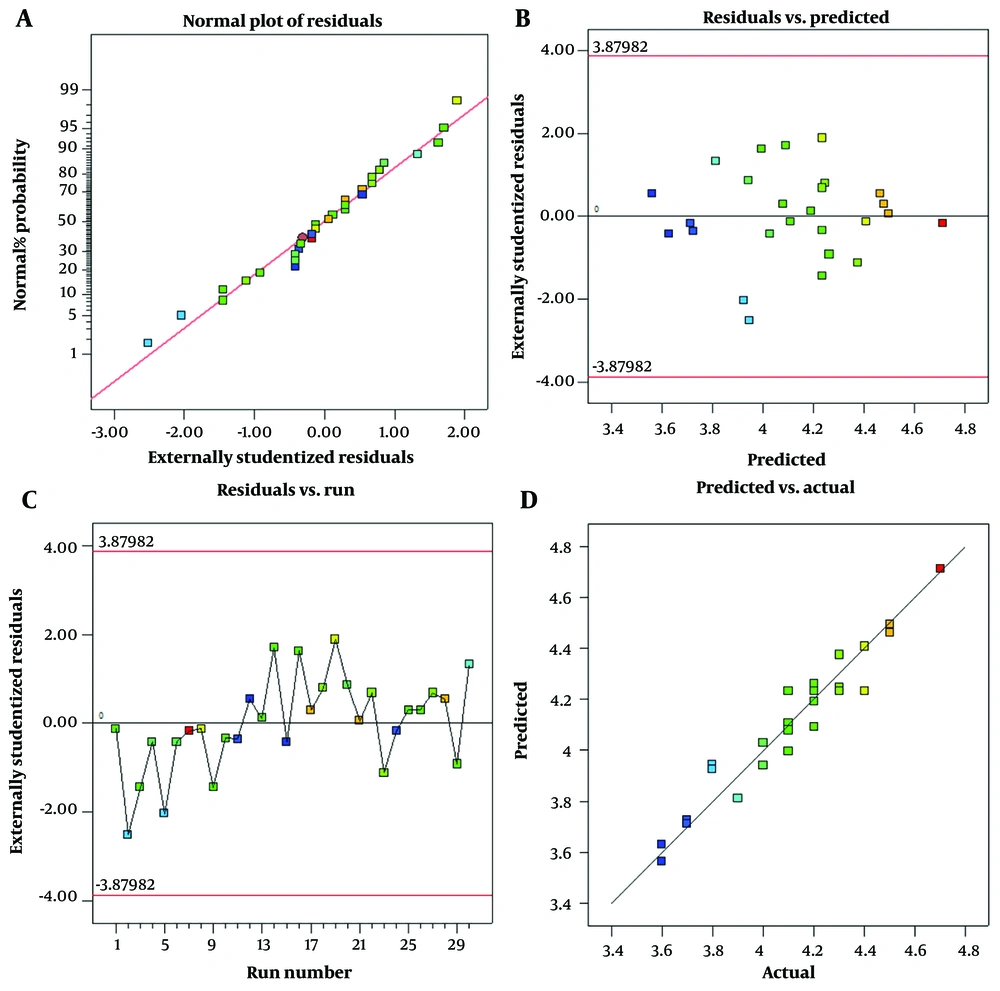
(1) Typical layout: The assumption that the error follows a standard button is a fundamental one in statistics. In order to verify this presumption, the test data are fitted with the normal probability curve. The error follows the normal distribution if the distribution is far from the S-shaped distribution. A normal probability curve is depicted in Figure 2A, in which the distribution of the residuals has a normal distribution and is relatively close to the reference line.
(2) The residuals versus expected plot aims to investigate the systematic nature or prevalence of errors. If the residuals are systematic, it is a warning to re-examine the trial and possibly repeat it. If the residuals are random, it indicates that the tests were correct. The presence of the remaining on both the positive and negative sides indicates that the experiment did not contain any systematic errors.
(3) If residuals versus run plot exhibits a specific trend (uptrend or downtrend), it is indicative of a mistake. As can be seen in Figure 1C, this plot lacks a clear pattern for the expected model.
(4) The predicted versus actual plot shows how experimental results and predicted model outcomes relate to one another; the closer the data are to the bisector model, the more significant the model’s influence is. This plot also adheres to the normal distribution, as seen in Figure 2D.
4.6. Interaction Between Parameters
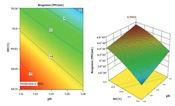
The relationships between the factors are depicted via three-dimensional (3D) and contour charts. The relationship between temperature and pH parameters has an impact on the reaction (Figure 3).
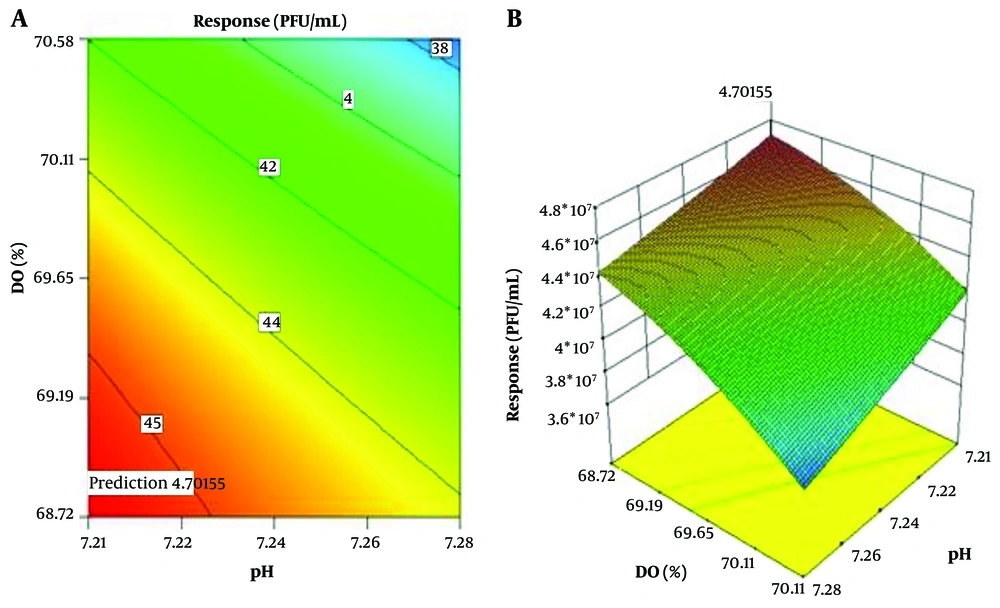
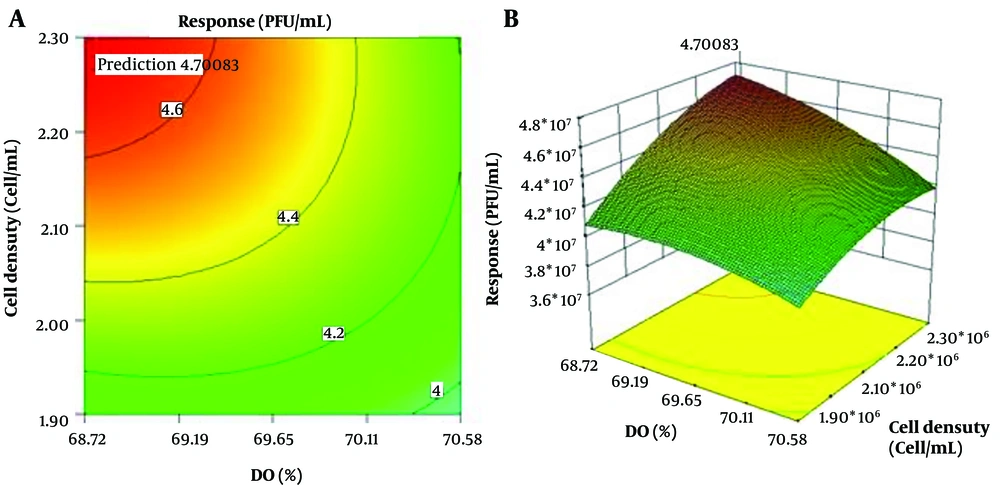
When pH and DO are held constant at their midpoints, the effect of DO (%) and cell density (cell/mL) parameters on the response is shown in Figure 4. The parameters’ contour plot shows that the highest response occurs at a cell density of 2.30 × 10⁶ cells per milliliter.
4.7. Optimization of Independent Variables and Validation Experiment
In Table 6, the ideal circumstances for a full response are listed. As can be seen, at pH 7.21, temperature 35.05ºC, DO 68.75%, and cell density 2.30 × 10⁶ cell/mL with desirability of 1, the maximum response of 4.7 × 10⁷ PFU/mL occurs (Table 6).
| Variables | Values |
|---|---|
| Optimum factor | |
| pH | 7.21 |
| Temperature (ºC) | 35.05 |
| DO (%) | 68.75 |
| Cell density (Cell/mL) | 2.30×10⁶ |
| Response (PFU/mL) | 4.7×10⁷ |
| Desirability | 1.00 |
Results for Optimization of Independent Variables and Validation of Experiments
The response was carried out four times experimentally under these conditions to determine the model’s accuracy in predicting the ideal conditions, and a value of 4.7 × 10⁷ PFU/mL was obtained. It stands for this model’s strong capacity for estimation and prediction.
5. Discussion
As previously stated, the huge public health problem posed by rabies caused by wild animals can only be resolved by educating a willing community and encouraging them to internalize and use preventative measures. The production of an effective vaccine is a key idea (11). Currently, homogenous systems, such as bioreactors, or heterogeneous systems, such as roller flasks and roller bottles, are used to produce products made from cell cultures, such as therapeutic proteins, viral vaccines, and monoclonal antibodies. The majority of the procedures are completed in batch culture mode and multiple flasks (12).
Although BHK-21 culture in bioreactors and metabolism has been the subject of numerous publications (13, 14), integrated studies evaluating different bioreactors at different DO concentrations are rarely discussed. Perrin et al. have worked on the effect of culture media compositions on the vaccine but have not worked on the pH control mode (with or without base addition) and other unspecified modules. Using a central compound approach and a small number of experiments, the present work has shown that increasing cell density while decreasing pH, temperature, and DO during cell growth significantly increases virus yield (15).
The improvement of the nutrient media is the main focus of studies on the increase of virus yield in BHK-21 cell lines. Rarely are the effects of the physical environment and other important molecule concentrations, such as oxygen, pH, temperature, and cell density, investigated for this purpose. Therefore, to circumvent specific safety and production cost issues, the present study created an experimental rabies vaccine using BHK-21 grown in a serum-free medium (MDSS2). As a result, high upstream processes also necessitate a unique design for culture medium. Without affecting cell growth, the environmental factor should provide all the nutrients required (16). The high production of lactate and ammonium, metabolites responsible for pH decrease and growth inhibition, could be the cause of the earlier drop of initial pH (7.1) in Cruz et al.’s experiment with low values of maximum cell concentration (17).
To the best of our knowledge, this is the first study in which the optimization of veterinary rabies vaccine in BHK-21 cells is applied by a CCD. The typical result of a bioprocess screening experiment is that a subset of a few essential factors is identified. Process optimization based on a statistical method called response surface methodology (RSM) is a powerful experimental design tool to recognize the performance of composite systems (18). To find a theoretically ideal condition to maximize target production, the current study used a statistical analysis service (Design-Expert software from Stat-Ease Inc., USA). Typically, four variables can affect fermentation setup production (19).
The most popular optimization designs are Box-Behnken, central composite, and three-level complete factorial designs. A complete quadratic model can be fit by CCDs (17, 18). Because they can incorporate data from a properly planned factorial experiment, they are frequently used when the design plan calls for sequential experimentation (20). With a CCD, it is feasible to find a theoretically optimal state (combination of the factors) and identify the ignorance of specific aspects (from RSM) (21). In order to work with different regression models used in biological process studies, a center-rotation composite design was used as the experimental strategy (22). An analysis of variance (ANOVA) table was prepared to evaluate the importance of each factor and interaction. The variance of each parameter was calculated (23).
When pH and DO are kept constant at their midpoints, the answer falls with raising DO. The same is true for the influence of DO and cell density on virus yield. However, the response also increased as cell density did (24). In general, it can be determined from the contour and 3D plots that the following parameters have the greatest influence on the response:
Cell density > pH > temperature > DO
Due to the current study’s limitations in checking the effective parameters in production, other modules, such as cell type and culture environment, can be used.
5.1. Conclusions
An appropriate cell substrate for producing robust rabies vaccines, which is the fundamental requirement for these vaccines’ protective effect in humans, is the permanent BHK-21/C13 cell line used to manufacture the animal rabies vaccine. The technologies for BHK-21 cell culture and production are rather simple, and a concentration phase is not necessary for the manufacturing process. Therefore, the current study’s data indicated that in order to maintain a high cell density of BHK-21 cells in the fermentor, the following parameters should be maintained:
pH = 7.21, temperature = 35.05ºC, DO = 68.75%, and cell density = 2.30 × 10⁶ cells/mL
