1. Background
The agent of severe acute respiratory syndrome (SARS), the human coronavirus (HCoV), is an enveloped positive single stranded RNA virus from Coronaviridae family, which has a genome size of about 29.7 kb (1-4). Fever, cough, and progressive breath failure associated with respiratory complication are the main terrible manifestations of SARS infection. High prevalence of hospitalization and mortality risk (> 15%), in addition to the lack of prophylactic vaccines and therapeutic protocols, comprise serious challenges of SARS at times of global outbreaks (5-8). The genome of SARS encodes 2 polyproteins namely ppla and pplb, with molecular weights of 450 and 750 KD, respectively. These polyproteins are cleaved to different functional proteins of spike, membrane, envelop, nucleoprotein, replicase, and polymerase (9-11). This process is performed by a chymotrypsin-fold proteinase of 33KD molecular mass. This proteinase is called main protease (Mpro) or 3C-like protease (3CLpro) because of its similarity to protease picornavirus 3C in its folding and function (12-14).
As a homodimer with optimum activity at pH 7.5 and 42°C, the coronavirus Mpro, EC: 3.4.22.69, is highly conserved among Coronaviridae members exhibiting about 40% - 44% of sequence homology (15, 16). The Mpro has 3 structural domains; domain I (residues 8 - 101) and domain II (residues 102 - 184) both have beta barrel motifs representing chymotrypsin catalytic domain and domain III (residues 185 - 200) with a helical structure participates in dimerization of protein and active enzyme production (17, 18). Located at the interface between domains I and II, the 2 conserved residues His41 and Cys145 form the catalytic dyad of Mpro (2, 19, 20). Unlike other viral proteases, Mpro uses Cys residue of the catalytic dyad instead of Ser for nucleophilic attacks (16, 17).
Given its vital role in polyprotein processing and virus maturation, Mpro is considered to be a suitable target for viral inhibitor development as an approach toward SARS treatment (21-23). On the other hand, HIV-1 protease inhibitors are widely reported to be able to deactivate Mpro and hence their nomination as potential drugs against SARS infection (24, 25).
This study has therefore been undertaken to study the molecular interaction of HIV-1 protease inhibitors with Mpro through docking/molecular dynamic (MD) experimentation in order to understand the underlining mechanisms to be used in designing more effective drugs for SARS infection.
2. Methods
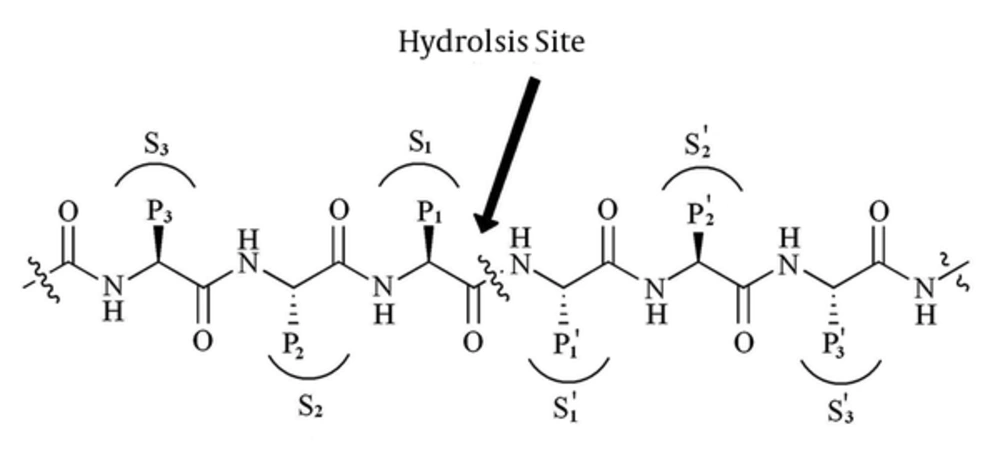
Substrate Construction: It is well documented that Mpro may cleave polyproteins substrate at more than 10 conserved motif containing Leu-Gln↓ (Ser,Ala,Gly) sequences. This means that the preferred substrate should contain Leu at P2 and Gln at P1 position (see Figure 1: the cleavage site is indicated by↓) (25, 26).
Figure 1 represents standard nomenclatures for polypeptide substrates and the corresponding binding site cavity (27). In order to find the enzyme binding site, we constructed a substrate with TVLQSGFR sequence in Argus-Lab 4.0.1 Software (http://www.arguslab.com) and docked this substrate to optimized coordinate structure of Mpro in Hex software version 5.1 (http://www.loria.fr/~ritchied/hex/) (28).
Enzyme coordinate structure: the crystal structure of Mpro with PDBID of 1UK3 was used as a starting structure throughout this study. Obtained by the X-Ray diffraction method and refined at the resolutions of 2.4Å, the structure was retrieved from the protein data bank (http://www.rcsb.org/pdb). The structure was optimized to lower than 300 KJ/Mol of total energy using the GROMACS software via the same method used in MD settings. A short equilibration run of MD was then followed for 2ns at 37°C, neutral pH, and 1 atmosphere of pressure. After removing the PBC effects, solvent, as well as other heteroatoms, the structure was then saved in the PDB format.
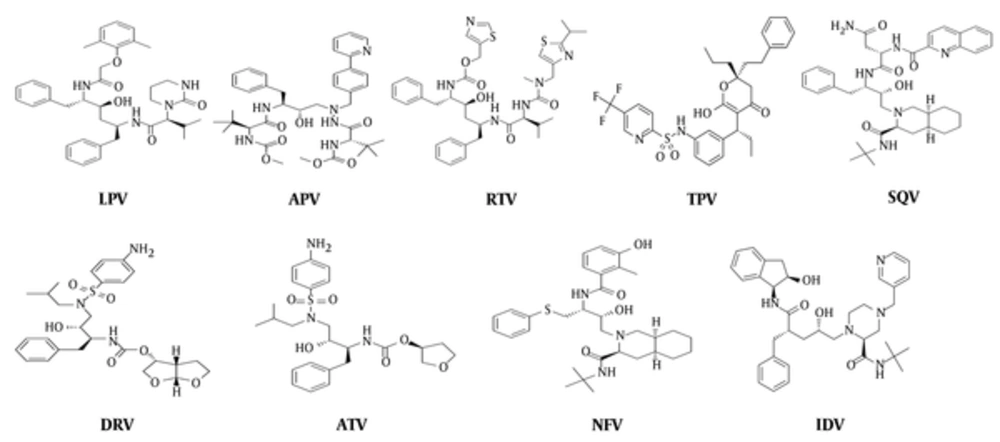
Docking experiments: approved inhibitors of HIV-1 protease including tipranavir (TPV), saquinavir (SQV), ritonavir (RTV), nelfinavir (NFV), lopinavir (LPV), indinavir (IDV), darunavir (DAR), atazanavir (ATV), and amprenavir (APV) were constructed and optimized in the ArgusLab software (Figure 2).
The structures of the substrate and inhibitors were docked to the optimized structure of Mpro in the Hex software version 5.1 (http://www.loria.fr/~ritchied/hex/). The blind docking algorithm was used to study the physical fitness of inhibitors to their binding site. Docking results were then scored based on their energy and the first 200 solutions were collected and statistically analyzed. The binding site residues of each ligand were extracted by the Argus-Lab software separately.
2.1. Molecular Dynamic Simulation Setting
The best enzyme-inhibitors complex with maximum binding energy was selected for MD simulations. These complexes were placed in the center of a rectangular box (6.97 × 8.95 × 8.71 nm) filled with SPC water molecules. Molecular dynamic simulations were performed using the double-precision MPI version of GROMACS 4.5.5 installed on UBUNTU version 14.04 and 53A5 force field. The net charge of simulated systems was analyzed by preprocessor engine of GROMACS package. System neutralization was done by adding an equivalent number of positive ions of sodium. Total energy of hydrogen atoms, ions, and water molecules were minimized in 1500 steps using the steepest descent method to under 300 kJ/mol. The other MD setting was as reported before at a neutral pH (29, 30).
3. Results
In order to determine the binding energy and fitness of the inhibitors to the enzyme active site and to extract their preferred binding site, we carried out a serial docking experiment as mentioned above, each in triplicate. Our data (Table 1) indicated that binding energies of inhibitors fitness are as follow: LPV > SQV > TPV > RTV > IDV > ATV > DAR > NFV > APV. To extract the binding site residues of each inhibitor, the best corresponding complex was analyzed by Argus-Lab 4.0.1 software and the amino acid content was compared to that of the substrate. The amino acid content similarity of binding sites of each inhibitor to the substrate was calculated and presented in Table 1. As tabulated, given a high similarity between the substrate and the inhibitors’ binding sites, drugs such as LPV, APV, RTV, TPV, and SQV represent the strongest rivals of the polyproteins to bond to the enzyme active site. Therefore, we selected LPV, APV, RTV, TPV, and SQV as potent inhibitors for further experimentation. No significant correlation was found between binding energies (as in Table 1) and molecular weights of inhibitors (data not shown).
| Inhibitor | Binding Energyb | Binding Site Similarity, % | MW |
|---|---|---|---|
| LPV | -413.99 ± 29.31 | 66.67 | 628.81 |
| APV | -331.23 ± 20.26 | 55.56 | 505.62 |
| RTV | -381.93 ± 43.17 | 55.56 | 720.94 |
| TPV | -398.55 ± 43.36 | 51.85 | 602.66 |
| SQV | -400.87 ± 27.66 | 51.85 | 670.84 |
| DAR | -360.75 ± 31.22 | 33.33 | 547.66 |
| ATV | -361.45 ± 38.45 | 33.33 | 704.85 |
| NFV | -354.25 ± 29.88 | 0 | 567.78 |
| IDV | -372.61 ± 30.21 | 0 | 613.79 |
aThe binding site contents were extracted by the ArgusLab software.
bValues are expressed as mean ± SD.
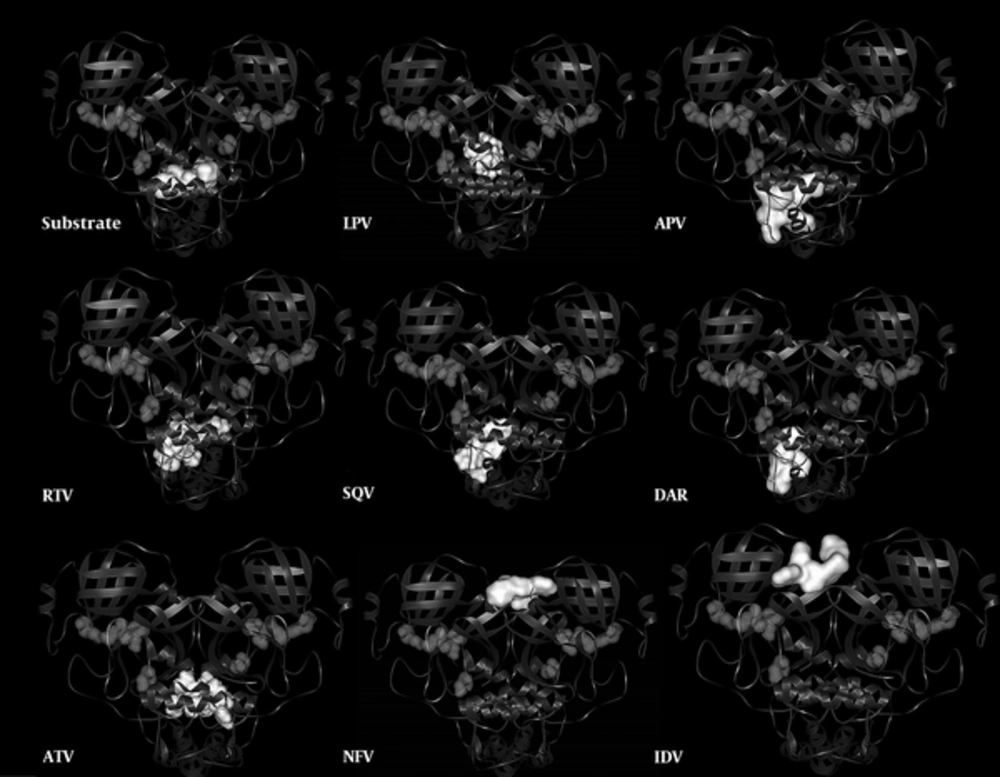
Figure 3 illustrates the locations of inhibitors binding sits in contrast to the substrate binding site to provide a holistic understanding on the subject.
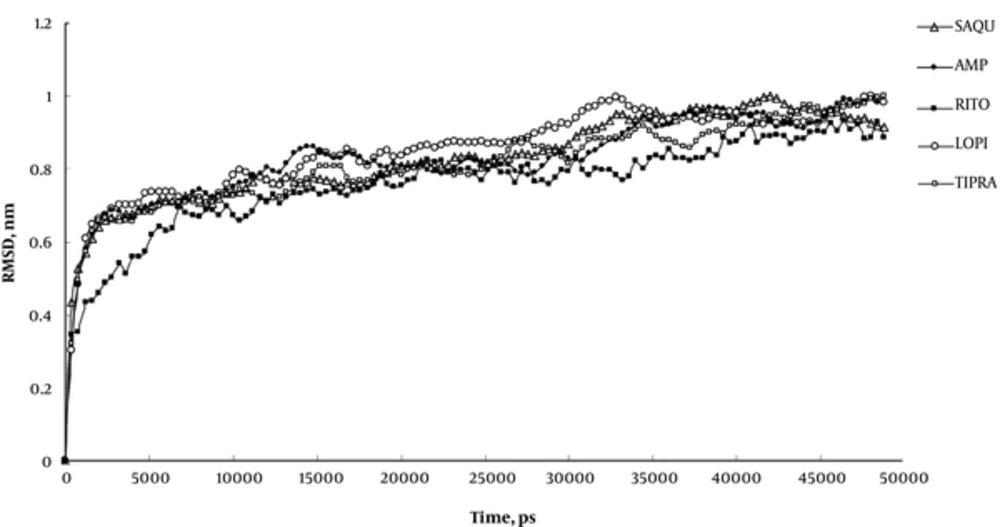
Root mean square displacement (RMSD) of MD experiments (Figure 4) indicates that 50ns period of simulation completely covers all changes induced by inhibitors in the Mpro structure. This figure conveys that our systems experience structural alterations during simulation as manifested in increased RMSD to about 1 nanometer. The extents of these alterations are high enough to be attributed to all structural alterations induced by inhibitors. The final 30ns trend of RMSD curve is indicative of the prevalence of the equilibration state with less than 0.2 nm fluctuation in RMSD curve.
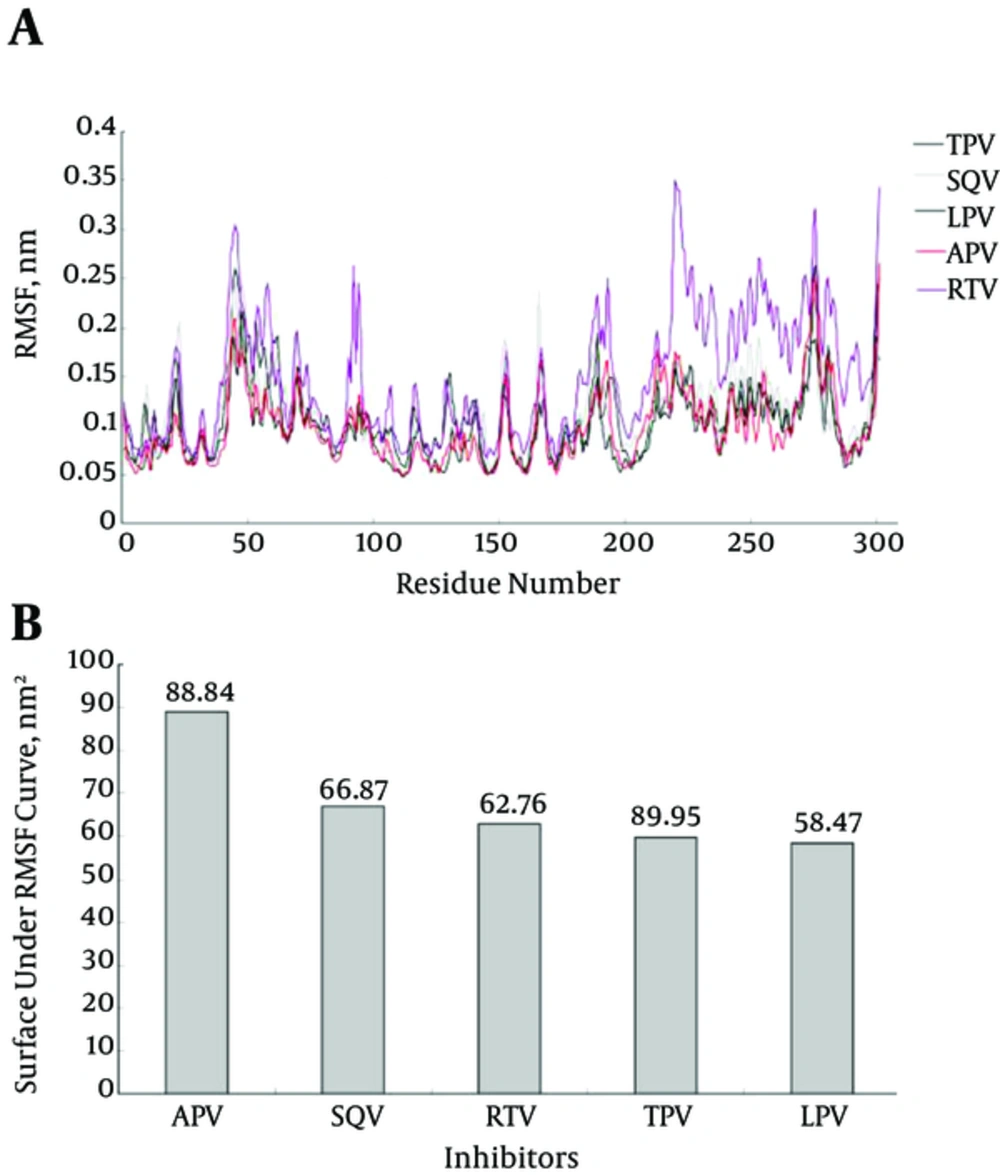
Structural flexibility is one of the important physical properties that affect protein conformation and function. Whereas high increase in kinetics energy and protein flexibility can disrupt non covalent interactions as in thermal denaturation; a sharp decrease in flexibility can also cause protein denaturation as seen in cold denaturation. Therefore, proteins need an essential amount of flexibility to carry out their native function at physiological conditions. In this context, an inhibitor by binding to a protein can alter its flexibility and decrease its enzymatic activity. As indicated in Figure 5A and 5B, LPV reduces Mpro flexibility more effectively than TPV and other inhibitors. This may be attributed to the tighter attachment of LPV to Mpro enzyme, which results in a stronger inhibitory effect.
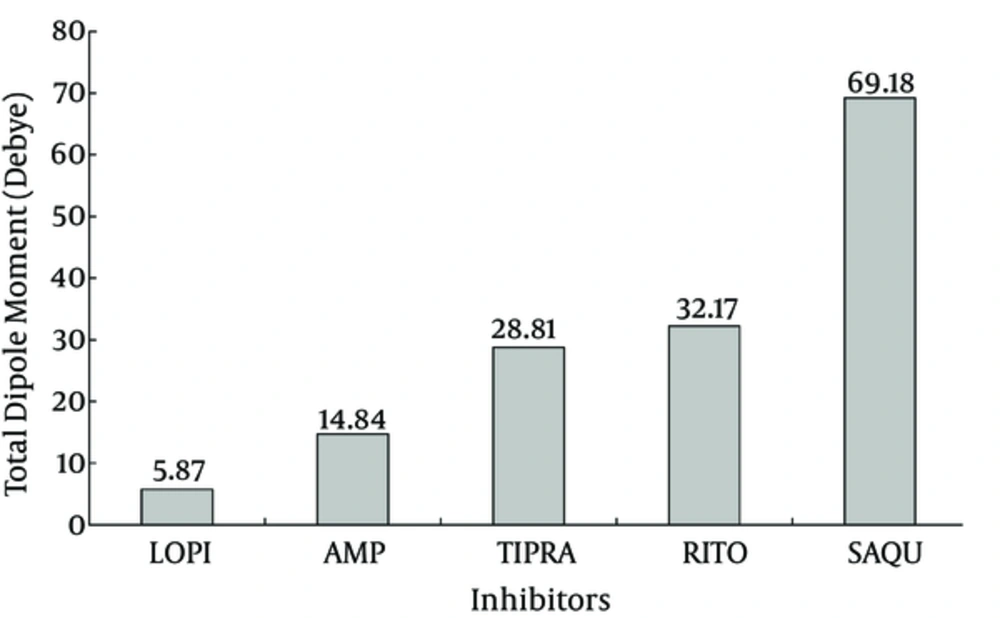
The g_dipol command in GROMACS package calculates the dipole moment of inhibitors in the Debye unit during the simulation period (Figure 6). The dipole moment of an inhibitor is a physical property determined by their chemical structure and affected by surrounding conditions of solvent, solutes, and temperature. The dipole moment provides a good index for inhibitor polarity during simulation. Figure 6 indicates that LPV and SQV show the lowest and the highest dipole moments, respectively. The lower dipole moment for LPV conveys its more hydrophobic property that facilitates its interaction with the hydrophobic core of Mpro compared to other inhibitors.
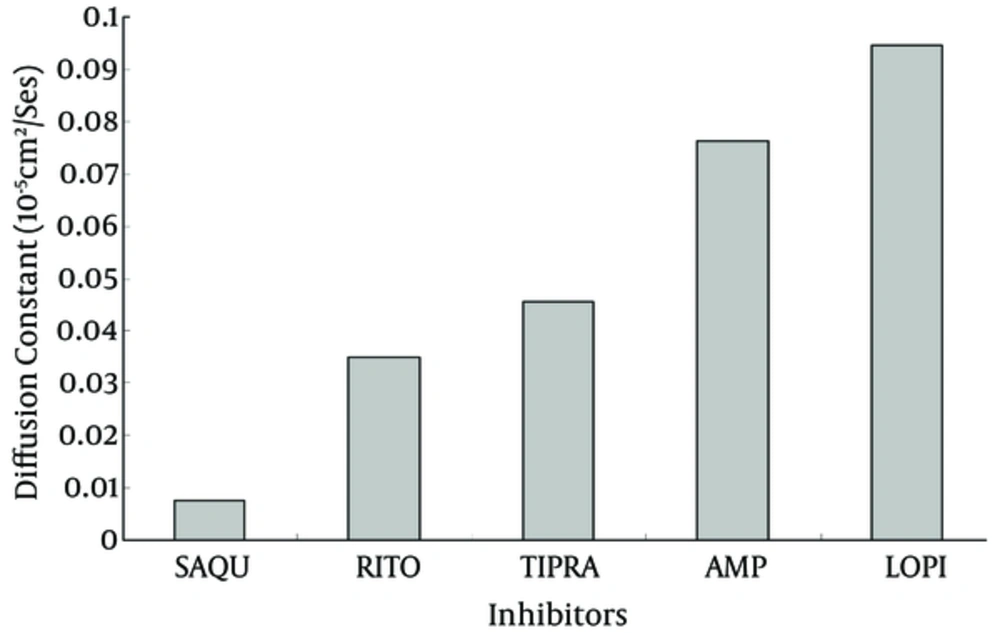
Diffusion constant for inhibitors during simulation is another useful parameter, which indicates the extent to which inhibitors penetrate inside Mpro protein. This parameter could be pulled out from the slope of MSD curve obtained by g_msd commands of the GROMACS package (Figure 7). As expected from the dipole moment, LPV and SQV showed the highest and the lowest diffusion constants, respectively. This finding reconfirms the hypothetic higher inhibitory potency of LPV.
4. Discussion
Efforts are globally underway to create an efficient vaccine or drug for prevention or treatment of the SARS infection (31-33). In this context, many reports showed that Mpro is an ideal target for drug design and development (34-36). The well-characterized inhibitors of Mpro can be classified into 2 classes based on their chemical structures. The first class includes a peptide chain with an ending reactive group. This kind of inhibitor fits the catalytic site of the enzyme by making a covalent link with Cys145 via its reactive group and therefore it blocks the substrate entry to the active site (37, 38).
The 2nd class involves small organic compounds that bind to the enzyme active site groups and/or to groups in its vicinities so that they competitively prevent a substrate entrance to the active site cavity. Anti-protease inhibitors approved for viral infection treatment are interesting examples in this connection. Recently, these inhibitors are screened for their capability to inhibit Mpro and treat SARS infection using in vivo, in vitro, and in silico experiments (34-39). The clinical trial of LPV showed a significant decrease in virus titer, reduced rate of death, and improved clinical recovery (40-42). In this direction, it deemed appropriate to study in detail the molecular interactions between Mpro coordinate structure and HIV-1 protease inhibitors using femtosecond snapshots of MD simulations trajectories. Accordingly, this study primarily aimed to draw a detailed prospective from HIV-1 protease inhibitors-Mpro complexes to help design more effective inhibitors for the SARS infectious.
Our data indicated that among the 9 tested inhibitors, 5 could bind to sites that resemble their preferred active sites with more than 50% similarities (Table 1). Our structural inspection revealed that there are 2 factors affecting inhibitors’ binding efficacy. The first factor is the extent of similarity of the inhibitor specific binding site to Mpro active site, e.g. the more similarity exists the more effective inhibition of enzyme occurs. The 2nd important factor is Mpro structural complexity and spatial accommodation required for inhibitors binding. Therefore, adopting a complex structure of maximum similarity to its specific binding site upon interaction with Mpro, LPV causes maximum decrease in RMSF (Figure 5B) and maximum inhibitory effect.
Although, LPV showed the highest binding energy (-413.99 ± 29.31KJ/Mol) and maximum similarity (66.67%) to the enzyme active site, no significant correlation was found between binding energy and binding site similarity or molecular weight for other tested inhibitors. These findings reveal that the binding energy of inhibitors is not merely determined by binding site similarity or by inhibitors molecular weight. Instead, it is likely determined by the mode of spatial binding of inhibitors to enzyme binding site and the arrangement of their functional groups to their counter groups on the enzyme active site.
The same change in RMSD curves of inhibitors (Figure 4) assures that the systems experience equal conformational changes; therefore, it could be used for a comparative study. As indicated, only LPV reduces the total RMSF of protein to its minimum amount, which means that LPV is the strongest inhibitor of Mpro (42, 43). Figure 5A plots the average fluctuation of each alpha carbon during 50ns period of simulation. Alpha carbons, with high fluctuation comprise hot points or flexible points for Mpro protein. The high fluctuating curve for Mpro, in the presence of certain inhibitors, indicates that the inhibitor does not restrict or limit protein flexibility (weak inhibitor). Conversely, a strong inhibitor is expected to restrict enzyme flexibility with lower average of fluctuation for the enzyme active site (Figure 5B). Inhibitor hydrophobicity was calculated in situ as a dipole moment of inhibitors by g_dipol command of the GROMACS software. According to these data (Figure 6), in contrast to other inhibitors, LPV expresses more hydrophobic property. This results in effective binding of LPV to Mpro and therefore, a steeper decrease in RMSF of LPV (Figure 5B). As expected, among other inhibitors, LPV shows the highest diffusion constant, which reconfirm its efficient inhibition character (Figure 7).
While RMSF and dipole moment are inversely proportional to inhibitory potency and diffusion coefficient of inhibitors, the hydrogen bonds formed between binding site groups and the level of their residual similarity are directly proportional to inhibitory power (Table 2). Each set of data were normalized and averaged for each inhibitor as an inhibitory index. The data show that inhibitory potency or the index for inhibitors are as follow: LPV < RTV < APV < TPV < SQV, in which LPV and SQV have the highest and the lowest potency for Mpro inhibition.
| APV | SQV | RTV | TPV | LPV | |
|---|---|---|---|---|---|
| RMSF | 88.83 | 66.87 | 62.76 | 59.94 | 58.46 |
| Dipole Moment | 14.83 | 69.18 | 32.17 | 28.81 | 5.87 |
| Binding site Hydrophobicity | 13.4 | 7.2 | 13.3 | 16.4 | 21.7 |
| Diffusion Coefficient | 0.076 | 0.007 | 0.035 | 0.045 | 0.094 |
| H.Bond | 3 | 1 | 6 | 2 | 5 |
| Binding Site Similarity | 55.56 | 51.85 | 55.56 | 51.58 | 66.67 |
| Shape Energy | -331.23 | -400.87 | -381.93 | -398.55 | -413.99 |
| Index | 0.58 | 0.48 | 0.64 | 0.51 | 0.76 |
Reports on in vivo and in vitro applications of LPV in SARS treatment provided evidence that LPV and RTV may improve the Ribavarin effect on SARS infections in a dose dependent manner and reduce the death rate by about 20% - 30% (43, 44). Also, NFV, an anti HIV-1 protease, showed to prevent coronavirus replication and limit its cytotoxic effect on host cells (31-33, 44).
4.1. Conclusions
Taking into consideration our findings and the available clinical evidences on the usefulness of anti HIV-1 protease inhibitors for SARS infection treatment, tested inhibitors can be ranked based on their inhibitory potency as follows: LPV < RTV < APV < TPV < SQV. In the absence of even a single effective drug for SARS treatment, our findings represent a promising pharmaceutical perspective for the disease therapy via Mpro inhibition.

