1. Background
Severe acute respiratory syndrome coronavirus 2 (SARS-CoV-2) is the pathogen causing coronavirus disease 2019 (COVID-19) (1). Since its discovery in December 2019, due to its extremely high infectivity (2-4), by the end of Dec 2023, the number of confirmed COVID-19 patients in the world has exceeded 770 million, more than 6.9 million deaths (5). It is the most influential acute infectious disease in this century. Shenzhen is a city with a population of more than 17 million in South China, and there were 504 confirmed patients in the first half of 2020 (6). We continuously monitored some convalescent patients and found that there were widely re-detectable positive (RP) patients, and some patients even were multiple-re-detectable positive (M-RP).
There have been many literature reports on the RP phenomenon of COVID-19 patients during recovery (7-11); however, the causes and influencing factors of RP remain unclear, and most reports focus on the clinical features and epidemiological data analysis of RP (10, 11), with limited research on lymphocyte subsets, T-lymphocyte activation indicators, and levels of specific antibodies. Therefore, in this study, a total of 66 convalescent patients (44 RP and 22 non-re-detectable positive [NRP] patients) and 11 healthy controls (HCs) were collected. Flow cytometry was used to analyze lymphocyte subsets, and the SARS-CoV-2 anti-spike protein receptor-binding domain immunoglobulin G (S-RBD-IgG) antibody was detected by chemiluminescence. Lymphocyte subsets, T-lymphocyte activation indicators, and S-RBD-IgG antibody titer were analyzed for the COVID-19 convalescent patients in whole blood samples that could be collected, and the results are discussed in the subsequent sections.
2. Objectives
This study aimed to analyze the immunological characteristics of RP and NRP patients among convalescent patients from post-discharge COVID-19 patients, exploring immunological factors related to RP.
3. Methods
3.1. Study Subjects
The data for 11 HCs and 66 COVID-19 convalescent patients were obtained. All of these patients’ data were obtained within February 1 and May 5, 2020, and were asymptomatic after treatment at Shenzhen Third People’s Hospital. Moreover, nasopharyngeal swabs tested negative for SARS-CoV-2 ribonucleic acid (RNA) by real-time reverse transcriptase polymerase chain reaction (RT-PCR) for two consecutive days before discharge. Patients discharged from the hospital should be transferred to the isolation ward for 14 days and tested for nucleic acid on days 1, 3, 7, and 14. Isolation was completed when the nucleic acid test results were two consecutive negatives on the 7th and 14th days.
During the isolation period, COVID-19 convalescent patients with confirmed positive SARS-CoV-2 RNA (cycle threshold [CT] value ≤ 40) by RT-qPCR at any of the above-mentioned 4 time points or during follow-up were included in the RP patients, and these patients were readmitted for further medical observation until they meet the discharge criteria again and could be discharged. After re-discharge, if the SARS-CoV-2-RNA test result was re-positive, the patient was defined as a M-RP. Through the above-mentioned systematic monitoring, among the 66 convalescence patients from whom anticoagulant whole blood samples could be collected, 44 RP patients (23 of them were M-RP patients) and 22 NRP patients were detected.
Information on patient age, gender, clinical severity, the number of days in hospital, and days from hospital discharge to RP was obtained from electronic medical records. During the epidemic prevention and control period, no samples of other healthy people could be obtained; therefore, the HCs in this trial were all laboratory staff (SARS-CoV-2 RT-qPCR detection is negative every day).
The subsequent sequencing analysis verified that all the above-mentioned cases were infected with the first-generation strain of SARS-CoV-2. The results of this study do not represent the RP rate. The diagnostic criteria for symptom grading were based on the “Diagnosis and Treatment Guidelines for Novel Coronavirus Pneumonia in China (12)”, categorizing the clinical severity at the first hospitalization into asymptomatic, mild, moderate, and severe. Based on this criterion, the patients were classified into mild and below and severe and above.
3.2. Instruments
3.2.1. Nucleic Acid Testing
On the day of sample collection, a commercial reagent kit (Zhongshan Daan Biotec) was used for real-time RT-qPCR detection of the N and Orf1ab genes of SARS-CoV-2. The kit includes an endogenous internal standard for monitoring specimen collection, nucleic acid extraction, and PCR amplification processes. Additionally, 1 group of positive quality control and 3 groups of negative quality control were set in the test to avoid the occurrence of false positive results. After 45 cycles, the Ct value of N and Orf1ab genes ≤ 40 was considered positive. If a single gene is positive, the test needs to be repeated, and if the Ct value of the repeated test is still ≤ 40, it is judged positive.
3.2.2. Flow Cytometry
Becton Dickinson (BD, New Jersey, USA) flow cytometric analysis kits were used as follows: Multitest CD4-FITC/CD38-PE/CD3-PerCP/HLA-DR-APC (Cat No. 340573), Multitest 6-color TBNK (Cat No. 662967) CD45-PerCP-Cy5.5, CD3-FITC, CD4-PE-Cy7, CD8-APC-Cy7, CD19-APC, CD16 and CD56-PE. Anticoagulated blood samples from the study subjects were tested within 12 hours using the BD FACS Canto II Flow Cytometry System and analyzed using Diva software (version 6). The percentages of CD3+/CD45, CD4+/CD3, CD8+/CD3, CD4+CD38+/CD4 T cells, CD4+HLA-DR+/CD4 T cells, CD19+/CD45 B cells, and CD16+CD56+/CD45 NK cells (%) were analyzed.
3.2.3. Antibody Detection
Immunoglobulin G in the receptor-binding domain of the spike protein on the surface of SARS-CoV-2 was detected by chemiluminescence microparticle immunoassay (CMIA) technology (Caris200 automatic chemiluminescence instrument, Beijing Wantai Biotech), and determined by cut-off index (COI). The cut-off value for seropositivity is set according to the manufacturer’s instructions, and samples with a COI of > 1 are considered positive. The test has been certified by the National Medical Products Administration of China as an in vitro diagnostic reagent.
3.3. Data Analysis
The data from flow cytometry were analyzed using Diva software 6 and FlowJo software 10.6.2. The data were integrated using Microsoft Excel 2019, statistically analyzed using IBM SPSS Statistics 26.0 (IBM Corp, Armonk, NY, USA), and plotted using R (version 4.1.3). Quantitative data were reported as median and interquartile range (IQR), and qualitative data were reported as percentages. Comparison between the two groups was performed by using a two-tailed unpaired Student’s t-test and Mann-Whitney-U test. The Spearman correlation test was used for correlation analysis, and analysis of variance was used for comparison between the three groups.
The S-W test was used to test the normality of continuous data. The percentages of CD3, CD4, CD8, and CD38 met the normality distribution, and the comparison between the two groups was compared by bilateral unpaired Student’s t-test. Analysis of variance (ANOVA) test was used between the three groups, and the least significant difference (LSD) was used for the post-hoc multiple comparison. The percentages of natural killer (NK) cells, B cells, CD4+HLA-DR+, and RBD-IgG titer did not satisfy normality, and the Mann-Whitney-U test was used for comparison between the two groups. The Kruskal-Wallis test was used for comparison between the three groups, and the significance values were adjusted by the Bonferroni correction method for multiple tests. Differences were considered significant at the P < 0.05 level.
3.4. Ethical Considerations
The experimental protocol was established according to the ethical guidelines of the Helsinki Declaration and was approved by the Ethics Committee of Shenzhen CDC (QS2020070048).
4. Results
4.1. Baseline Characteristics of Subjects
A total of 77 subjects were included in this study (Table 1). The median age of the HC group was 35 years (IQR: 31.25 - 44.50), with 4 (36.4%) males and 7 (63.6%) females. The median age of NRP patients was 38 years (IQR: 28.5 - 60.5), with 9 males (40.9%) and 13 females (59.1%). The median age of RP patients was 36 years (IQR: 20.0 - 52.0), with 19 males (43.2%) and 25 females (56.2%). There was no significant difference in age or gender among the three groups. The frequency distribution of clinical symptoms into mild and below symptoms and moderate and above symptoms was 8 (36.4%) and 14 (63.6%) in NRP patients and 24 (57.1%) and 18 (42.9%) in RP patients, respectively. According to the frequency distribution, it could be seen that the mild and below clinical symptoms of the RP patients accounted for the majority; however, there was no significant difference between the RP and NRP patients.
| Characteristics | HC (n = 11) | NRP (n =22) | RP (n = 44) | P-Value |
|---|---|---|---|---|
| Age, median (IQR) | 35 (31.25 - 44.50) | 38 (28.50 - 60.50) | 36 (20.00 - 52.00) | 0.471 |
| Gender, No. (%) | 0.917 | |||
| Male | 4 (36.4) | 9 (40.9) | 19 (43.2) | |
| Female | 7 (63.6) | 13 (59.1) | 25 (56.2) | |
| Clinical severity on first admission, No. (%) | 0.114 | |||
| Mild and below | NA | 8 (36.4) | 24 (57.1) | |
| Moderate and above | NA | 14 (63.6) | 18 (42.9) | |
| Hospitalization days, median (IQR) | NA | 27 (22 - 32) | 24 (16.5 - 33.5) | 0.623 |
| Discharge to first RP days, median (IQR) | NA | NA | 8 (7 - 15) | NA |
Abbreviations: HC, healthy control; RP, re-detectable positive; NRP, non-re-detectable positive; IQR, interquartile range.
The median time between discharge and first RP was 8 days (IQR: 7 - 15). It should be noted that the average CT value detected by RT qPCR in RP patients was 36.6; however, the average CT value of COVID-19 patients in the same period was 31 (5). The viral load of RP patients was significantly lower than that of COVID-19 patients.
4.2. Flow Cytometric Analysis of Lymphocyte Subsets
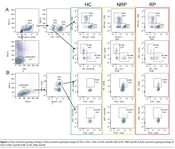
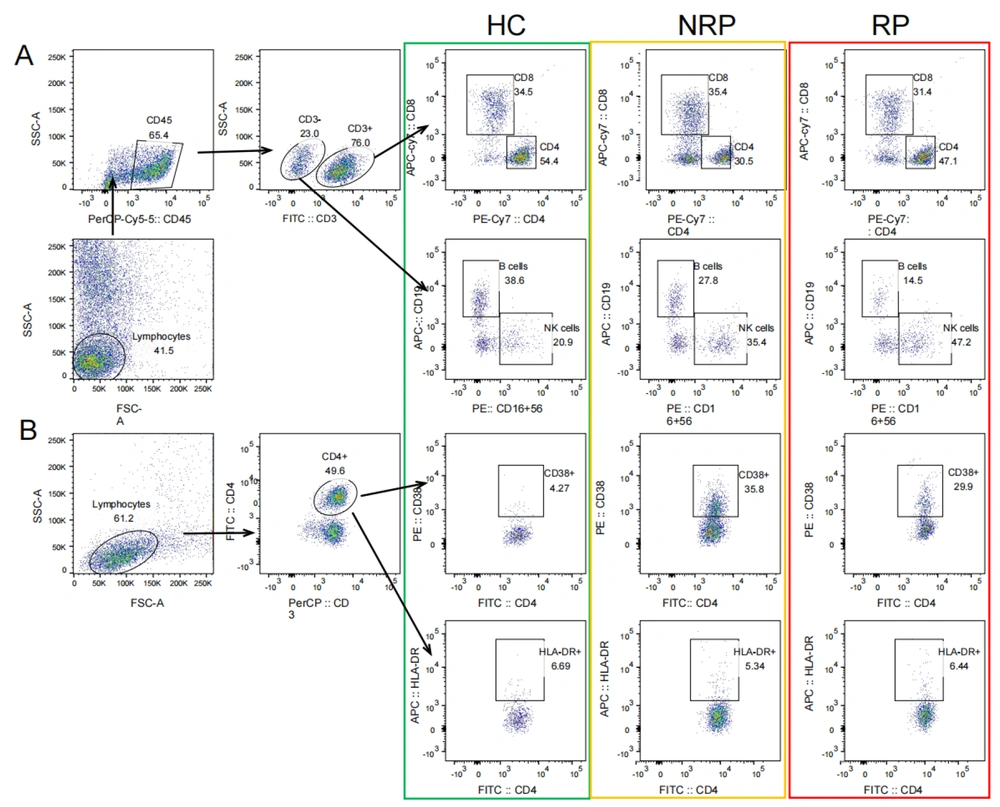
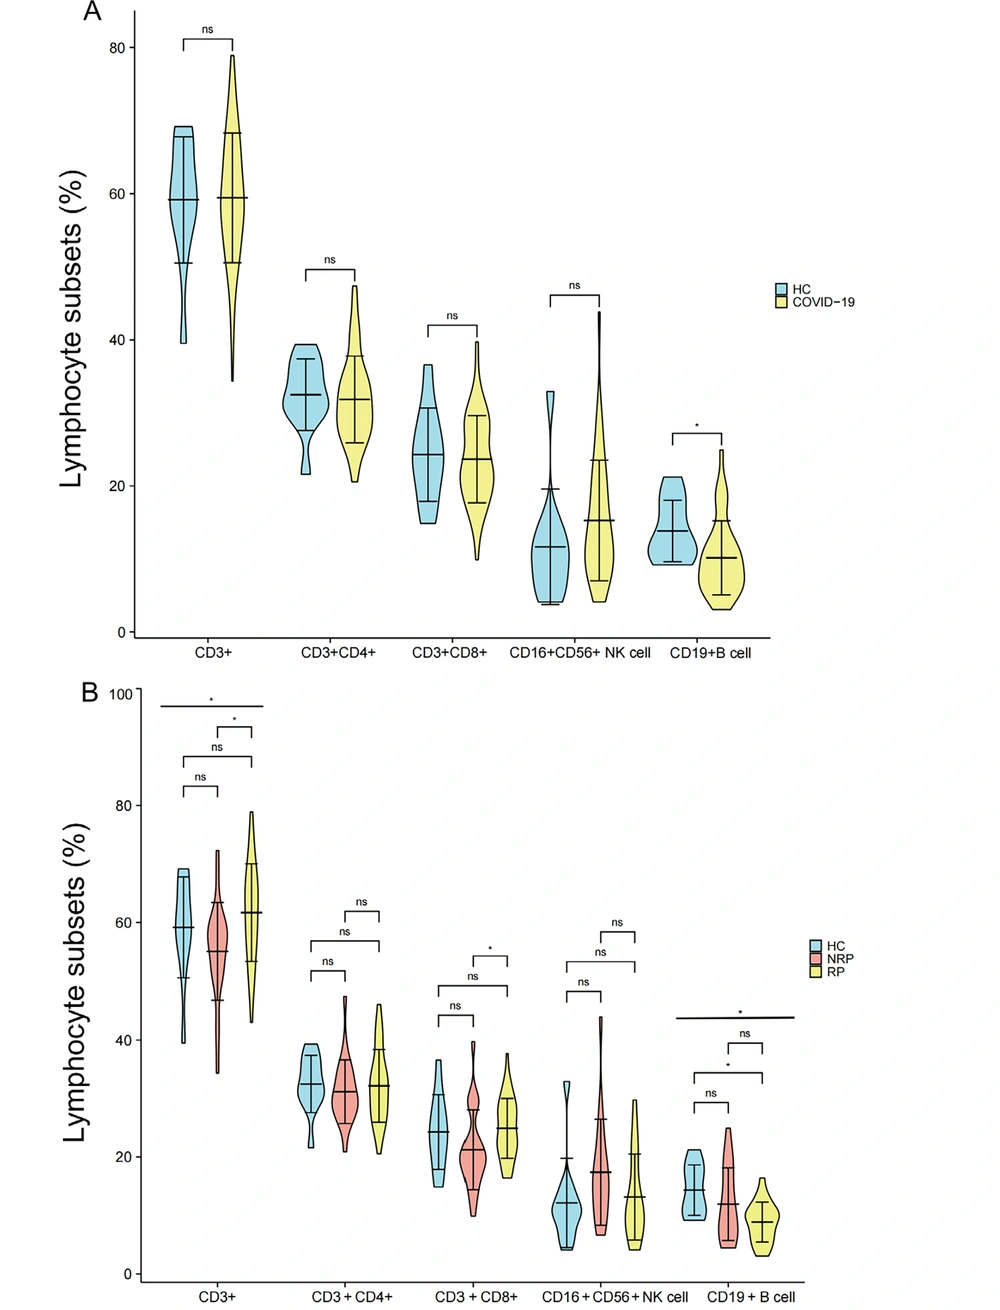
The flow cytometry gating strategy of lymphocyte subsets of HC, NRP, and NR is shown in Figure 1, and the difference analysis of each lymphocyte subset is shown in Figure 2. The convalescent cases of COVID-19 included RP and NRP. The results of flow cytometry showed that only the B cells (%) were significantly lower in convalescent patients than in the HC group (P = 0.017), with no differences in CD3+, CD4+, CD8+ T cells, and NK cells (%) (Figure 2A). The results of the analysis of differences among the three groups of HC, NRP, and RP showed significant differences in B cells (%) and CD3+ T (%) cells (P = 0.017 and 0.014, respectively), and the B cells (%) regularly decreased in the three groups (Figure 2B). The differences among the three groups were as follows:
CD3+ and CD8+ T lymphocytes (%) in the RP group were considerably higher than that in the NRP group (P = 0.004 and 0.019, respectively), and there was no difference between the RP and HC group (Figure 2B); nonetheless, B cells (%) in the RP group were significantly lower than that in the HC group (P = 0.014), and there was no significant difference between the NRP and HC groups (Figure 2B). Natural killer cells (%) and CD4+ T cells (%) were not significantly different between HC, NRP, and RP groups (Figure 2B).
Comparison of differences in CD3+, CD4+, CD8+, NK, and B cells (%) in COVID-19 convalescent patients, HCs, NRP, and RP groups. A, comparison of differences in CD3+, CD3+CD4+, CD3+CD8+ T cells (%) (HCs = 11, COVID-19 = 65), CD16+CD56+ NK cells (%), and CD19+ B cells (%) (HCs = 11, COVID-19 = 38) between COVID-19 convalescent patients and HC group; B, comparison of differences in CD3+, CD3+CD4+, CD3+CD8+ T cells (%) (HCs = 11, NRP = 22, RP = 43), CD16+CD56+ NK cells (%) and CD19+ B cells (%) (HCs = 11, NRP = 17, RP = 21) in HC, NRP, and RP groups. Significance levels were expressed as follows: Ns, no significance, * P < 0.05, ** P < 0.01, and *** P < 0.001.
4.3. Immune Activation Index CD38+ and HLA-DR+
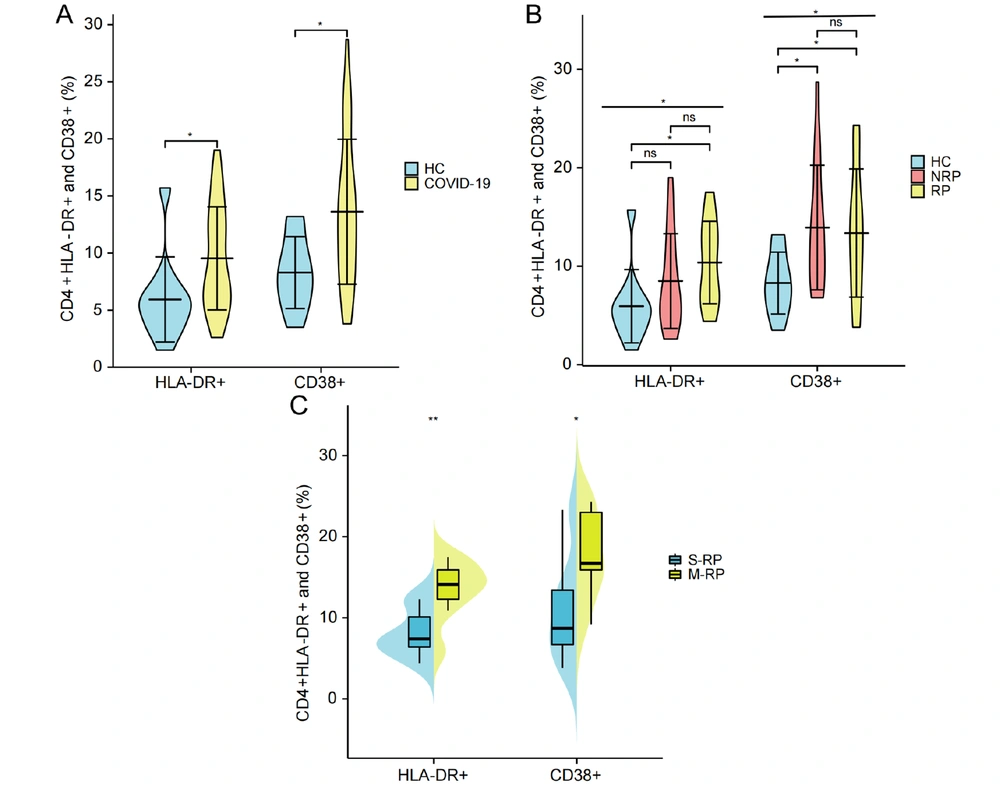
To compare the expression of CD4+HLA-DR+ and CD38+ T cells in the HC group and COVID-19 convalescent patients, the results showed that CD4+ HLA-DR+ and CD38+ T cells (%) in COVID-19 convalescent patients were significantly higher than those in HC group (P = 0.02 and 0.01, respectively) (Figure 3A). The results of the analysis of differences among the three groups of HC, NRP, and RP showed a significant difference in both CD4+CD38+ and HLA-DR+ T cells (%) (P = 0.037 and 0.015, respectively). Moreover, CD4+HLA-DR+ T cells (%) in the three groups increased in sequence (Figure 3B). Pairwise comparisons between the three groups showed that CD4+HLA-DR+ T cells (%) in the RP group were significantly higher than that in the HC group (P = 0.013) but not noticeably higher than that in the NRP group. Moreover, there was no difference between NRP patients and the HC group (Figure 3B). The CD4+CD38+ T cells (%) in both the RP and NRP groups were significantly higher than that in the HC group (P = 0.017 and 0.025, respectively); nevertheless, there was no substantial difference between the NRP and RP patients (Figure 3B). In addition, both CD4+CD38+ and HLA-DR+ T cells (%) in the M-RP group were significantly higher than those in the single re-detectable positive (S-RP) group (P = 0.040 and 0.006, respectively) (Figure 3C).
Comparison of differences in CD4+CD38+ and HLA-DR+ (%) in HCs, NRP, RP, S-RP, and M-RP. A, comparison of differences in CD4+HLA-DR+ and CD38+ T cells (%) between HC group (n = 11) and COVID-19 convalescent patients (n = 38); B, comparison of differences in CD4+HLA-DR+ and CD38+ T cells (%) in HC group (n = 11), NRP group (n = 17), and RP group (n = 21); C, difference in CD4+HLA-DR+ and CD38+ T cells percentage between S-RP group (n = 7) and M-RP group (n = 9). Significance levels were expressed as follows: Ns, no significance, * P < 0.05, ** P < 0.01, and *** P < 0.001.
4.4. CD4+HLA-DR+ T Cells (%) and RBD-IgG Titers
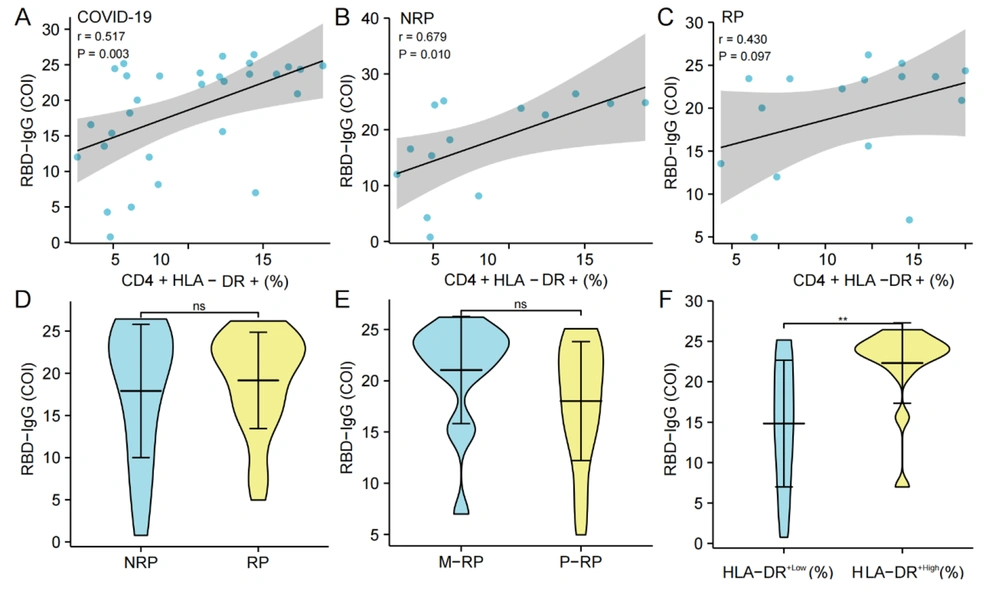
The analysis of SARS-CoV-2 RBD-IgG antibody titers showed that there was no significant correlation between T- lymphocyte subset (CD3+, CD4+, and CD8+ T cells) (%), NK cells (%) and B cells (%)) and RBD-IgG titers in COVID-19 convalescent patients. However, there was a substantial positive correlation between CD4+HLA-DR+ T cells (%) and the COI value of RBD-IgG in convalescence patients (P = 0.003, r = 0.517) (Figure 4A). Furthermore, there was also a significant correlation between NRP patients (P = 0.010, r = 0.679) (Figure 4B) but not in RP patients (Figure 4C). Meanwhile, there was no significant difference in the RBD-IgG titers between the NRP and RP groups and between the S-RP and M-RP groups (Figure 4D and E). The COVID-19 convalescent patients were grouped into HLA-DR+ high expression group (HLA-DR+High) and low expression group (HLA-DR+Low) according to the average percentage of CD4+HLA-DR+ T cells, and the COI value of RBD-IgG in the HLA-DR+High group was notably higher than that in the HLA-DR+Low group (P = 0.005) (Figure 4F).
Correlation and differentiation analysis of CD4+HLA-DR+ T cells (%) and RBD-IgG titers. A-C, the correlation between CD4+HLA-DR+ T cells (%) and RBD-IgG (COI) in the convalescent group (n = 30), NRP group (n = 14), and RP group (n = 16), respectively; D, comparison of the difference of RBD-IgG (COI) between the NRP group (n = 18) and RP group (n = 37); E, comparison of the difference of RBD-IgG (COI) between the S-RP group (n = 14) and the M-RP group (n = 23); F, comparison of the difference in RBD-IgG (COI) between the HLA-DR+High group (n = 15) and the HLA-DR+Low group (n = 15) in COVID-19 convalescent patients. Significance levels were expressed as follows: Ns, no significance, * P < 0.05, ** P < 0.01, and *** P < 0.001.
5. Discussion
Previous studies on the characteristics of innate and adaptive immune responses in SARS-CoV-2 infection helped us understand the potential pathogenesis of COVID-19 (13-15). Although most studies have focused on the peripheral immune responses in clinical cases, especially in severe COVID-19 patients (16, 17), there was limited research on the immune features of RP patients and whether the reasons for RP are related to differences in the immune function of COVID-19 convalescent patients needs confirmation. Currently, most studies have focused on the clinical features and epidemiological data analysis of RP (10, 11). Therefore, in this study, COVID-19 convalescent patients were divided into NRP and RP, with HCs as controls. The immune characteristics of the three groups were compared, and the correlation between RBD-IgG titers and CD4+ T cell activation markers in the case group was analyzed.
Compared to NRP, the B cells (%) were lower in RP. Previous studies have shown that T lymphocyte subsets participate in the specific immune response to SARS-CoV-2. B lymphocytes were associated with the production of specific antibodies and were a key component of the human immune system’s fight against SARS-CoV-2 (15, 18, 19). This study showed that in the three groups of HCs, NRP, and RP, the B cells (%) decreased sequentially, with the B cells (%) in RP significantly lower than in HCs (Figure 2B). Additionally, the B cells (%) in COVID-19 convalescent patients were also significantly lower than in HCs (Figure 2A). Savchenko et al. (20) demonstrated that, compared to HCs, patients at different stages of infection showed varying degrees of decrease in B cell numbers, with hospitalized patients having lower B cell numbers than convalescent patients. By combining the above-mentioned results, it is speculated that the percentage of B cells in RP was lower than in NRP, which might be related to the RP of convalescent patients.
The CD4+CD38+ and CD4+HLA-DR+ T cells (%) in RP showed significant differences, compared to HCs and NRP. The CD4+CD38+ and HLA-DR+ T cells (%) in COVID-19 patients increased significantly after infection (21-23). This finding is consistent with the results of the present study (Figure 3A). However, the difference analysis of the two activation indicators among the three groups of HCs, NRP, and RP has not been reported.
This study indicated that the CD4+CD38+ cells (%) in both RP and NRP were higher than those in HCs, and the CD4+CD38+ cells (%) in M-RP were also higher than those in S-RP (Figure 3C). Furthermore, the CD4+HLA-DR+ T cells (%) in RP was significantly higher than in HCs, and it was higher in M-RP than in single recurrent cases. Additionally, the CD4+HLA-DR+ (%) increased sequentially in the four groups of HCs, NRP, S-RP, and M-RP (Figure 3). Li et al. (24) and Zhang et al. (25) also demonstrated that peripheral blood in recurrent patients exhibits a higher inflammatory immune response. This finding suggests that, compared to NRP, CD4+ T cells in RP remain in a highly activated state.
There was a significant positive correlation between the CD4+HLA-DR+ T cells (%) and RBD-IgG titer in COVID-19 convalescent patients. Previous studies showed a significant correlation between SARS CoV-2-specific CD4+T Cell (%) and RBD-IgG (26), and the CD4+ T cells (%) was significantly higher in the RBD-IgG antibody response group than in the non-response group (27). Therefore, we analyzed the correlation between immune cell subsets and RBD-IgG titers in COVID-19 convalescent patients, RP and NRP. The results showed a significant positive correlation between the RBD-IgG titer and the CD4+HLA-DR+ T cells (%) in both the COVID-19 convalescent patients and NRP (Figure 4A and B). In the COVID-19 convalescent patients, the RBD-IgG titers in the HLA-DR+High group were significantly higher than that in the HLA-DR+Low group, suggesting that activated CD4+ T cells might play a crucial role in the specific antibody response.
5.1. Conclusions
This study demonstrated that B cells (%) decreased and CD4+HLA-DR+ T cells (%) increased sequentially in HC, NRP, and RP groups. This finding indicates that these two indicators might be helpful for screening potential RP patients and reducing the risk of continued transmission. Meanwhile, it was observed that the high expression of CD4+HLA-DR+ T cells was significantly correlated with the higher RBD-IgG titer in the COVID-19 convalescent patients, suggesting that activated CD4+ T cells might play a crucial role in the specific antibody response. These findings have practical implications for the surveillance of RP patients in COVID-19 convalescent patients. Unfortunately, the blood samples were not collected from RP patients during their initial hospitalization, and it was impossible to make a comprehensive longitudinal comparison of the immune characteristics of patients at the time of RP and hospitalization.
