


1. Background
The SARS-CoV-2 pandemic represents an unprecedented global health challenge that continues to generate significant concern worldwide (1, 2). The initial case cluster emerged in Wuhan, Hubei province, with Chinese authorities reporting an outbreak of severe pneumonia to the World Health Organization (WHO) on December 31, 2019 (1). The pathogen was subsequently designated as "Novel Coronavirus-2019" by WHO on January 21, 2020, and later renamed SARS-CoV-2 (1). The unprecedented transmission dynamics prompted WHO to designate the outbreak as a global pandemic (3). The virus rapidly transcended international borders, evolving from a localized outbreak in China into a worldwide crisis that has precipitated profound disruptions across healthcare systems, economies, social structures, and political frameworks (4, 5). The escalating transmission of this pathogen globally has led to a dramatic surge in case numbers, placing unprecedented strain on national healthcare systems. Epidemiological data from WHO indicates that by November 5, 2020, more than 47.9 million confirmed infections and approximately 1.2 million fatalities had been documented (6). The disease burden has been disproportionately distributed across global regions, with nations including the United States, India, Brazil, Russia, several European countries, and Iran bearing the most severe impact of the pandemic (6). The United States, India, Brazil, Russia, France, Spain, Argentina, Colombia, the United Kingdom, Mexico, Peru, Italy, South Africa, and Iran are among the regions most severely affected by the Corona epidemic (6). Iran’s initial confirmed COVID-19 cases were identified in Qom, with the infection rapidly disseminating across all 31 provinces from February 20, 2017. World Health Organization surveillance data through November 5, 2020, documented over 646,000 confirmed cases and approximately 37,000 mortalities within Iran (6). The causative agent belongs to the Coronaviridae family, a group of pathogens capable of inducing a spectrum of illnesses ranging from mild upper respiratory infections to severe acute respiratory syndromes (SARS), potentially leading to fatal complications including pneumonia (7, 8). SARS-CoV-2, along with SARS-CoV and MERS-CoV, are classified within the betacoronavirus subgroup. Genomic analyses have revealed that SARS-CoV-2’s genetic sequence shares 79% identity with SARS-CoV and 50% with MERS-CoV (9). These viruses possess single-stranded, positive-sense RNA genomes and, characteristic of RNA viruses, exhibit substantial genetic diversity and recombination potential, facilitating their rapid transmission across human and animal populations (10, 11). While the initial viral emergence involved animal-to-human zoonotic transmission, the subsequent efficient human-to-human transmission rapidly became the primary driver of widespread community transmission (12). Although many coronaviruses exist asymptomatically in animal reservoirs, genetic recombination events in intermediate hosts can generate highly virulent strains capable of causing severe human disease (13). Among the observed complications, non-thyroidal illness syndrome (NTIS) has emerged as a significant manifestation, characterized by distinct alterations in thyroid hormone profiles among euthyroid patients with acute or chronic systemic conditions. These alterations typically present as decreased serum total triiodothyronine (TT3), elevated rTT3, and fluctuating circulating T4 levels. Despite recognition of these patterns, consensus regarding optimal therapeutic management of NTIS remains elusive (14). The NTIS presents with characteristic alterations in thyroid hormone profile, specifically showing reduced TT3 levels, elevated rTT3 levels, variable T4 serum concentrations (ranging from normal to low), and decreased serum thyrotropin (15, 16). The syndrome’s pathophysiology involves complex metabolic adaptations, particularly affecting cellular hormone activity. This metabolic adaptation is significant because TT3 plays a crucial role in thyroid hormone genomic actions and mitochondrial function regulation (17). In this condition, T4, which normally serves as the intracellular precursor to TT3, shows altered conversion patterns (16), while rTT3 remains metabolically inactive. The reduction in circulating TT3 levels, coupled with increased rTT3, primarily results from enhanced type 3 deiodinase (DIO3) activity affecting T4 metabolism (18). However, this may also reflect reduced thyroidal TT3 secretion. Clinical studies have established significant correlations between NTIS and various malignancies (19). The increased DIO3 activity affects TT3 metabolism, leading to the formation of 3,3'-T2, a metabolically inactive compound. Additionally, 3,5-T2, which can originate from thyroidal secretion or peripheral conversion in NTIS, has been implicated in cardiac complications (20) and central nervous system malignancies (21). These metabolic alterations are typically reflected in the characteristic thyroid function test profile observed in NTIS. Extensive research has documented the multisystemic impact of COVID-19, affecting various organs and systems including the immune system, gastrointestinal tract, circulatory system, liver, kidneys, and thyroid gland (22-30). While these effects have been well-documented, the precise mechanisms underlying thyroid dysfunction remain to be fully elucidated. The observation of renal dysfunction in SARS caused by a different coronavirus variant (27) suggests that the thyroid gland may be similarly vulnerable to SARS-CoV-2 infection. The thyroid gland synthesizes two interconnected hormones: Thyroxine and triiodothyronine. These hormones function through specific thyroid hormone receptors and are crucial for cellular differentiation during developmental phases while maintaining thermogenic and metabolic equilibrium in adult physiology (31). The regulation of thyroid function is primarily controlled by thyroid stimulating hormone (TSH), produced by anterior pituitary thyrotrophs. The TSH serves as the key physiological marker of thyroid hormone activity and follows a pulsatile secretion pattern with diurnal variations, peaking during nocturnal hours. Notably, TSH secretory fluctuations are less pronounced compared to other pituitary hormones, partially attributed to its extended plasma half-life of approximately 50 minutes. This characteristic enables reliable assessment through single-point measurements using highly sensitive and specific immunoradiometric assays (32). Thyroid disorders, particularly hypothyroidism and hyperthyroidism, are prevalent in adult populations and carry significant clinical implications. These conditions can be precisely diagnosed through laboratory evaluation and typically respond well to therapeutic intervention (33, 34). Thyroid dysfunction manifests through diverse clinical presentations that vary according to individual characteristics and disease severity. These manifestations typically develop gradually and are often non-specific, which poses challenges for clinical diagnosis (34). The spectrum of symptoms encompasses dermatological changes (dry hair), mood disorders (depression and irritability), cognitive impairment (dementia), sleep disturbances (insomnia), neuromuscular symptoms (tremors, muscle cramps, myalgia, muscle weakness), cardiovascular signs (edema, dyspnea, bradycardia, palpitations), and gastrointestinal and reproductive disorders (constipation, menstrual irregularities, and infertility) (28). Significant risk factors in personal history include: Previous thyroid conditions (goiter, thyroid surgery, radiotherapy), autoimmune diseases (diabetes, vitiligo, pernicious anemia), and specific medication use (lithium and iodine compounds). Family history should be evaluated for thyroid diseases, autoimmune disorders, and adrenal insufficiency (35). The TSH blood level assessment stands as a cornerstone diagnostic tool in detecting thyroid disorders, offering both remarkable precision and economic efficiency (35). Although highly effective in detecting primary thyroid insufficiency, this method proves inadequate for secondary (centrally-originated) dysfunction cases, where TSH concentrations fluctuate from diminished to slightly increased values. Such scenarios necessitate simultaneous blood-free thyroxine (FT4) evaluation. Various thyroid hyperactivity conditions – encompassing Graves’ disease, functioning adenomas, nodular enlargement, subacute inflammatory states, iodine-induced overactivity, and excessive exogenous hormone intake – consistently demonstrate marked TSH suppression (35). While evidence indicates renal system involvement in COVID-19 infection, its thyroid implications remain to be fully understood. Comparable kidney dysfunction patterns have emerged in other coronavirus-induced SARS cases. Contemporary research highlights significant thyroid-COVID-19 interactions (28-30, 36). The current understanding of thyroid pathology recognizes viral infections as crucial triggers in both subacute inflammatory conditions and autoimmune disorders. Research has revealed specific viral correlations: Inflammation-associated viruses (HFV, mumps) in subacute cases; autoimmune-linked viruses (HTLV-1, HFV, HIV, SV40) in Graves’ disease; and multiple viral agents (HTLV-1, enterovirus, rubella, mumps, HSV, EBV, parvovirus) in Hashimoto’s condition (36).
2. Objectives
The present study aims to conduct a thorough analysis of COVID-19’s impact on thyroid functionality, examining multiple determinants including clinical presentation, hospital stay length, chronological factors, sex distribution, and illness intensity.
3. Methods
This retrospective cohort study was conducted from March 2021 to September 2021 and approved by the Clinical Research Ethics Committee of Sirjan School of Medical Sciences (IR.SIRUMS.REC.1400.005).
3.1. Study Population and Design
We consecutively enrolled n = 167 adult patients (≥ 18 years) hospitalized at Imam Reza Hospital, Sirjan, Kerman province, who tested positive for SARS-CoV-2 by RT-PCR within 48 hours of admission according to WHO guidelines (37). The inclusion criteria were: (1) Laboratory-confirmed COVID-19; (2) Admission within 48 hours of symptom onset; (3) No prior history of thyroid disease or use of thyroid-modulating medications.
Exclusion criteria included pregnancy and any documented thyroid dysfunction before hospitalization.
3.2. COVID-19 Severity Classification
Patients were categorized as mild, moderate, or severe according to the WHO COVID-19 clinical management guidelines (37):
- Mild: Symptoms of COVID-19 without evidence of viral pneumonia or hypoxia (SpO2 ≥ 90% on room air).
- Moderate: Clinical signs of pneumonia (fever, cough, dyspnea, fast breathing) on imaging, with SpO2 ≥ 90% on room air and respiratory rate ≤ 30 breaths/min.
- Severe: At least one of the following: Respiratory rate > 30 breaths/min; SpO2 < 90% on room air; severe respiratory distress; or lung infiltrates involving > 50% of the lung fields on chest imaging within 24 - 48 h. Based on oxygen saturation (SpO2), respiratory rate, and chest CT findings per WHO guidelines. Mild cases included those admitted for close monitoring of comorbidities despite minimal symptoms.
3.3. Sample Size and Statistical Power
A priori power calculation indicated that 167 subjects provided > 80% power (α = 0.05) to detect a 15% difference in TSH abnormality between severity groups.
3.4. Data Collection
Demographic (age, sex) and clinical data (comorbidities, CT severity scores) were extracted from the electronic medical record by two independent reviewers using a standardized case report form. The CRP levels were measured on admission, and all hormone assays were performed within 72 hours.
3.5. Statistical Analysis
Data were analyzed using SPSS version 20 and MATLAB 2017b. Continuous variables are presented as mean ± standard deviation (SD) or median (interquartile range, IQR) as appropriate; categorical variables are reported as counts and percentages. The Shapiro-Wilk test was used to assess normality. As most hormone and CRP distributions were non-normal, the Kruskal-Wallis test was applied for multi-group comparisons (e.g., disease severity in Table 1), and the Wilcoxon rank-sum test for two-group comparisons (e.g., gender in Table 2). Pearson’s correlation coefficient was calculated for associations between continuous, normally distributed clinical variables (age, duration of hospitalization) and thyroid hormones (Table 3). Spearman’s rank correlation coefficient (rho) was used to assess relationships between CRP and thyroid hormone levels due to non-normal distributions. A two-tailed P < 0.05 was considered statistically significant.
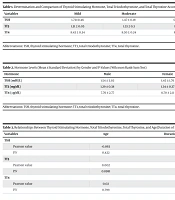
| Variables | Mild | Moderate | Severe | P-Value |
|---|---|---|---|---|
| TSH | 1.73±0.46 | 1.47 ± 0.19 | 0.94 ± 0.28 | 0.0491 |
| TT3 | 1.31 ± 0.05 | 1.33 ± 0.3 | 1.15 ± 0.07 | 0.0197 |
| TT4 | 8.43 ± 0.34 | 8.30 ± 0.24 | 8.57 ± 0.69 | 0.0893 |
Determination and Comparison of Thyroid Stimulating Hormone, Total Triiodothyronine, and Total Thyroxine According to Disease Severity (Kruskal-Wallis Test)
| Hormone | Male | Female | P-Value |
|---|---|---|---|
| TSH (mIU/L) | 1.54 ± 3.03 | 1.45 ± 1.76 | 0.2273 |
| TT3 (ng/dL) | 1.29 ± 0.38 | 1.34 ± 0.37 | 0.3969 |
| TT4 (µg/dL) | 7.76 ± 2.77 | 8.70 ± 2.11 | 0.0249 |
Hormone Levels (Mean ± Standard Deviation) by Gender and P‑Values (Wilcoxon Rank‑Sum Test)
| Variables | Age | Duration of Hospitalization |
|---|---|---|
| TSH | ||
| Pearson value | -0.063 | 0.013 |
| P.V | 0.422 | 0.869 |
| TT3 | ||
| Pearson value | 0.002 | -0.142 |
| P.V | 0.8981 | 0.067 |
| TT4 | ||
| Pearson value | 0.02 | -0.049 |
| P.V | 0.799 | 0.530 |
Relationships Between Thyroid Stimulating Hormone, Total Triiodothyronine, Total Thyroxine, and Age/Duration of Hospitalization (Pearson’s Correlation)
3.6. Thyroid Function Testing
Serum TT3, total thyroxine (TT4), and TSH levels were measured by ELISA (Statfax; Nouyan kit). Normal reference ranges (Table 4) were defined as:
- Total thyroxine: 5.0 - 11.0 µg/dL
- Total triiodothyronine: 70 - 190 ng/dL
- Thyroid stimulating hormone: 0.4 - 4.2 mIU/L
| Variables | Lower Limit | Upper Limit |
|---|---|---|
| TT4 (µg/dLit) | 5 | 11 |
| TT3 (mg/dLit) | 70 | 190 |
| TSH (mu/dLit) | 0.4 | 4.2 |
The Normal Range of Total Thyroxine, Total Triiodothyronine and Thyroid Stimulating Hormone According to Harrison’s Principles
4. Results
In this study, 167 people were examined. The mean age of patients was 51.18 ± 18.48 years. The number of women was 99 (59.3%), which was more than men, who numbered 68 (40.7%). In terms of disease severity, 49 patients (29.3%) were classified as mild, 101 patients (60.5%) as moderate, and 17 patients (10.2%) as severe. A total of 155 patients (92.8%) recovered, while 12 patients (7.2%) died. The mean duration of the disease was 5.52 ± 3.90 days. In Table 5, the frequency of underlying diseases in the studied samples is illustrated.
| Underlying Diseases | No. (%) |
|---|---|
| CAV | 2 (1.2) |
| Diabetes | 10 (6) |
| Hyper pressure | 15 (9) |
| Kidney problems | 4 (2.4) |
| Pulmonary problems | 4 (2.4) |
| Heart problems | 3 (1.8) |
Distribution of Underlying Diseases in Study Patients
Table 5 presents the frequency of underlying diseases in the studied samples. In this study, 1.2% of individuals had coronary artery vascular disorders (CAV), 6% were diagnosed with diabetes, 9% had hypertension, 2.4% experienced kidney problems, 2.4% had respiratory issues, and 1.8% suffered from cardiac problems. The normal range of TT4, TT3 and TSH is shown in Table 4.
Table 4 demonstrates the reference ranges and clinical significance of thyroid parameters in endocrine evaluation. These reference intervals encompass total thyroxine (TT4; 5 - 11 µg/dL), total triiodothyronine (TT3; 70 - 190 ng/dL), and thyroid-stimulating hormone (TSH; 0.4 - 4.2 mIU/L). Total thyroxine, synthesized exclusively by the thyroid gland, functions as the fundamental regulator of systemic metabolic pathways. Total triiodothyronine, representing the biologically dominant form, mediates critical cellular and tissue responses. The TSH, elaborated by the anterior pituitary, maintains precise control over thyroid hormone biosynthesis and release through complex feedback mechanisms. These standardized ranges enable comprehensive assessment of thyroid function and facilitate therapeutic decision-making.
According to the levels of TSH, TT3, and TT4, 36.53% of participants (61 people) had abnormal thyroid function parameters, including 17.96% (30 people) with low TSH, 5.4% (9 people) with high TSH, 1.8% (3 people) with low TT3, 1.8% (3 people) with high TT3, 6% (10 people) with low TT4, and 3.59% (6 people) with high TT4. Among participants, 24% (40 people) were severe and 76% (127 people) were moderate. The mean values and variance of TSH, TT3, TT4, and P-value for each parameter are compared for three groups: Severe, moderate, and mild (Table 4).
Table 1 presents the mean and SD values of TSH, TT3, and T4 hormones based on disease severity in three groups of patients with mild, moderate, and severe conditions. As shown in the table, the mean TSH levels in patients with mild, moderate, and severe disease severity were 1.73 ± 0.46, 1.47 ± 0.19, and 0.94 ± 0.28, respectively, indicating a significant decrease in TSH levels in patients with severe disease (P = 0.0491). Additionally, regarding TT3, patients with mild and moderate disease severity had values of 1.31 ± 0.05 and 1.33 ± 0.3, respectively, which were significantly higher than those in patients with severe disease (1.15 ± 0.07) (P = 0.0197). These results indicate that TT3 levels are significantly lower in patients with severe disease compared to other groups. For T4, the mean values in the mild (8.43 ± 0.34), moderate (8.30 ± 0.24), and severe (8.57 ± 0.69) groups did not show a significant difference (P = 0.0893).
In the next step, the relationships between age and duration of hospitalization and TSH, TT3, and T4 are investigated by Pearson value as shown in Table 1. As it is evident, there is a meaningful relationship between TT3 and the duration of hospitalization.
Table 3 examines the relationship between TSH, TT3, and T4 hormone levels with patients’ age and length of hospital stay. For TSH, a coefficient of -0.063 for age and 0.013 for the length of stay was obtained, indicating no significant relationship with age (P = 0.422) or length of stay (P = 0.869). Regarding TT3, the coefficients were 0.002 for age and -0.142 for the length of stay, which also showed no significant relationship with age (P = 0.8981) or length of stay (P = 0.067), although the relationship between TT3 and length of stay was close to significance. Finally, for T4, the Pearson coefficients were 0.02 for age and -0.049 for the length of stay, indicating no significant relationship with age (P = 0.799) or length of stay (P = 0.530).
4.1. Gender Differences in Thyroid Hormones
The relationship between gender and thyroid hormone levels was assessed using the Wilcoxon rank-sum test. As shown in Table 2, the mean values of TSH and TT3 were slightly different between males and females; however, these differences did not reach statistical significance (P = 0.2273 and P = 0.3969, respectively). In contrast, TT4 levels were significantly higher in females compared to males (P = 0.0249), indicating a modest gender-related difference in total thyroxine concentration.
These findings suggest that while TSH and TT3 levels do not significantly differ between sexes, TT4 is significantly elevated in females, which may reflect sex-based physiological or hormonal influences on thyroxine regulation during COVID-19 illness.
4.2. Clinical Thyroid Diagnoses
Using standard endocrinology definitions from the American Thyroid Association, we classified the 61 patients with any hormone abnormality into five diagnostic groups (Table 6):
- Non-thyroidal illness syndrome: Low TT3 with normal TSH and TT4
- Subclinical hypothyroidism: Elevated TSH with normal TT3 and TT4
- Overt hypothyroidism: Elevated TSH with decreased TT3 and/or decreased TT4
- Subclinical hyperthyroidism: Decreased TSH with normal TT3 and TT4
- Overt hyperthyroidism: Decreased TSH with elevated TT3 and/or elevated TT4
| Diagnosis | Definition | No. (%) |
|---|---|---|
| Non‑thyroidal illness syndrome | Low TT3, normal TSH & TT4 | 28 (16.77) |
| Subclinical hypothyroidism | ↑ TSH, normal TT3 & TT4 | 7 (14.19) |
| Overt hypothyroidism | ↑ TSH, ↓ TT3 and/or ↓ TT4 | 5 (2.99) |
| Subclinical hyperthyroidism | ↓ TSH, normal TT3 & TT4 | 12 (7.19) |
| Overt hyperthyroidism | ↓ TSH, ↑ TT3 and/or ↑ TT4 | 5 (2.99) |
Clinical Thyroid‐Function Diagnoses in COVID‑19 Patients (n = 167)
4.3. Inflammatory Markers and Thyroid Function
The CRP was measured in all 167 patients. The mean CRP level was 28.95 mg/L with a SD of 32.85 mg/L. The CRP levels increased significantly with disease severity (mild: 4.88 mg/L; moderate: 27.13 mg/L; severe: 85.35 mg/L; P < 0.001, Kruskal-Wallis test). Correlation analyses between continuous variables (e.g., CRP and hormone levels) were performed using Spearman’s rho due to non-normal distributions. Coefficients are reported as decimal values between -1 and +1, with corresponding P-values.
We then assessed correlations between CRP and thyroid hormones using Spearman’s rank correlation (Table 7). The corrected coefficients are as follows: (1) Thyroid stimulating hormone vs. C-reactive protein: Rank correlation coefficient = -0.103 (P = 0.1855; 95% CI not computed); (2) total thyroxine vs. C-reactive protein: Rank correlation coefficient = -0.073 (P = 0.3460; 95% CI not computed); (3) total triiodothyronine vs. C-reactive protein: Rank correlation coefficient = +0.068 (P = 0.3851; 95% CI not computed).
Although the observed correlations between CRP and thyroid hormones were weak and statistically non-significant, the directional trends — particularly the inverse relationship with TSH — align with known patterns of thyroid suppression during systemic inflammation.
| Hormone | Spearman’s rho | 95% CI | P-Value |
|---|---|---|---|
| TSH | -0.205 | -0.325 to -0.071 | 0.011 |
| TT4 | -0.083 | -0.191 to +0.042 | 0.184 |
| TT3 | -0.178 | -0.298 to -0.036 | 0.028 |
Spearman’s Rank Correlation Coefficients Between C-reactive Protein and Thyroid Hormones a
As shown in Table 7, CRP levels exhibited a significant inverse correlation with TSH (rho = -0.205, P = 0.011) and TT3 (rho = -0.178, P = 0.028), supporting the pattern of thyroid suppression observed in NTIS. Total thyroxine levels showed a weak, non-significant inverse trend (rho = -0.083, P = 0.184).
5. Discussion
The present study demonstrated that thyroid function in COVID-19 patients hospitalized at Imam Reza Hospital, Sirjan, was affected by the disease, with 36.53% of the examined patients exhibiting abnormal thyroid function parameters. Low TSH levels were observed in 17.96% of patients, while high TSH levels were found in 5.4%. Additionally, abnormal levels of TT3 and TT4 were identified in a smaller proportion of patients. These findings indicate the potential impact of COVID-19 on thyroid function, which may result from direct viral effects on the thyroid gland or systemic inflammatory responses.
The NTIS, also known as euthyroid sick syndrome, is a well-recognized phenomenon where systemic illnesses without intrinsic thyroid disease cause alterations in thyroid hormone levels. Commonly observed changes include reduced TT3, TT4, and TSH. Several factors such as severe infections, malignancies, malnutrition, and organ failure can contribute to this syndrome (38). Recent research on COVID-19 suggests that SARS-CoV-2 infection may trigger NTI-like patterns, potentially due to both direct viral injury and cytokine-induced suppression of the hypothalamic-pituitary-thyroid (HPT) axis. High expression of ACE2 and TMPRSS2 in thyroid tissue may also facilitate direct viral entry (30).
Several prior studies have reported similar findings. A study by Zakerkish et al. noted significant reductions in TSH and TT3 levels in COVID-19 patients compared to controls, with lower levels associated with increased disease severity. They also observed transient increases in TT4 levels (39). Our study corroborates these findings by demonstrating significantly decreased TSH and TT3 levels in patients with greater disease severity, while TT4 levels remained statistically unchanged across groups. Furthermore, a study involving 89 COVID-19 patients reported that 61.9% maintained normal thyroid function, while the remaining exhibited abnormalities predominantly in TT3 and TSH, particularly in severe cases (29). Similarly, another study found suppressed TSH in 56% of COVID-19 patients, often accompanied by reduced TT3, reinforcing the likelihood of HPT axis dysfunction during acute SARS-CoV-2 infection (28). Our study’s findings are consistent with these reports regarding the decline in TSH and TT3 with increasing disease severity, though TT4 appeared relatively stable, mirroring observations from previous studies.
Recent systematic reviews have also highlighted that thyroid dysfunction in COVID-19 predominantly presents as NTI, characterized by reduced TT3 and TSH levels in acute phases, occasionally followed by transient thyrotoxicosis or hypothyroidism in the recovery period (40). Consistent with this, our study found no cases of overt thyrotoxicosis or hypothyroidism during hospitalization, supporting the predominance of NTI patterns in hospitalized COVID-19 patients. Additionally, we observed a significant relationship between gender and TT4 levels, with females demonstrating higher TT4 values than males. While prior studies have noted sex-related differences in thyroid hormone physiology, few have examined this relationship in the context of COVID-19, making this an area warranting further investigation.
5.1. Conclusions
This study demonstrated that COVID-19 can cause significant alterations in thyroid hormone levels, particularly reductions in TSH and TT3, consistent with NTIS patterns. These abnormalities were more pronounced in patients with severe disease and elevated inflammatory markers. Based on these findings, we recommend that hospitalized COVID-19 patients, particularly those with moderate to severe illness or high CRP levels, undergo routine thyroid function monitoring during hospitalization. This should include at minimum TSH and TT3/TT4 measurements, and FT4 where available. In severe COVID-19 patients, we propose TSH and FT4 monitoring every 48 hours to guide supportive care decisions and enable early detection and management of NTIS. Endocrinology consultation should be considered for cases presenting with marked thyroid dysfunction. Future multicenter studies with larger sample sizes, control groups, and long-term follow-up are warranted to better define the natural course and clinical implications of thyroid dysfunction in COVID-19 survivors.
5.2. Limitations
This study has several limitations. First, it was conducted in a single referral hospital in Sirjan, which may limit the generalizability of our findings to other populations and healthcare settings. Second, we did not perform longitudinal follow-up to determine whether thyroid abnormalities persisted after discharge or normalized during recovery. Furthermore, the absence of a non-COVID-19 control group restricts our ability to definitively attribute observed thyroid dysfunction patterns solely to SARS-CoV-2 infection, as similar changes may occur in other critical illnesses. Third, potential confounders — such as concomitant medications, nutritional status, and unrecognized subclinical thyroid disease — could not be fully controlled. Additionally, FT4 levels were not measured due to resource constraints, limiting the full characterization of NTIS. Finally, thyroid autoantibodies and ultrasound evaluations, which could elucidate underlying thyroid pathology, were not included. A non-COVID-19 control group was not feasible due to ethical and logistical constraints during the pandemic surge; instead, comparisons were made against established historical reference ranges and published normative data. Future multicenter studies with comprehensive thyroid panels (including FT4 and autoantibody assays), imaging, and long-term follow-up are recommended to validate and extend these results.
