


1. Background
Cardiovascular disease (CVD) exemplifies a major medical problem as it is the most considerable cause of morbidity and mortality globally (1). The seriousness of CVD has resulted in sustained and extensive efforts in recent years that have helped to define the most common CVD risk factors. The imperative of CVD reduction has further been highlighted with the recent novel coronavirus COVID-19 pandemic. This is because CVD was found to be the primary underlying condition causing deaths associated with COVID-19 (2, 3).
Several modifiable CVD risk factors are well-recognized with the most profound of these modifiable risk factors being smoking, hypertension, dyslipidemia followed by physical inactivity (4). Numerous preventative measures have been proposed that can limit the expansion of CVD. In this regard, exercise occupies a central role in the prevention of CVD. Traditionally, aerobic activities have been prescribed in the prevention of CVD, despite evidence that resistance training (RT) may be equally or more beneficial than aerobic forms of exercise (5-7). More recently, public health guidelines have been updated to include RT as an essential component in the prevention and rehabilitation of CVD (5, 8, 9).
However, the oversimplification of RT design for CVD reduction and subsequent blunting of responses have resulted in cardio-centric CVD prevention and rehabilitation training programs (10). Just as aerobic training can take the guise of long slow distance training, interval training, etc., RT can take the guise of strength training, power training, hypertrophy training, and muscular endurance training (11). While sport conditioning specialists understand and differentiate these RT subtypes on athletic performance, this distinction is less clear for health professionals when designing CVD risk-reduction exercise programs (5). Thus, due to the various physical and functional adaptations induced by the various modes of RT, such as amplified muscular strength and muscle mass, as well as enhanced neuromuscular control and coordination, it is essential to understand which mode of RT is most effective at reducing CVD risk (12). In this context, we hypothesized that hypertrophy and muscular endurance RT would have varying effects on CVD risk factors in sedentary males.
2. Objectives
This study investigated and compared the effects of hypertrophy and muscular endurance RT on CVD risk in sedentary males.
3. Methods
3.1. Participants
A sample of 45 sedentary male smokers aged between 18 and 30 years were randomly assigned to either an eight-week hypertrophy RT group (HTG) (n = 15), muscular endurance RT group (METG) (n = 15) or a non-exercising control group (CON) (n = 15). Participants were required to be sedentary, weigh stable six months prior to the study and current cigarette smokers. Prior to participation, all volunteers gave written informed consent. The study was approved by the relevant Institutional Review Boards of the University of Johannesburg, South Africa.
3.2. Procedures
Each participant completed a five-day smoking recall form at both pre- and post-testing (13). All participants underwent a nine- to twelve-hour fast prior to completing their pre- and post-tests (14). Resting systolic (RSBP) and diastolic blood pressure (RDBP) was measured following a five-minute supine rest using a sphygmomanometer and a stethoscope (Littmann, Classic II S.E, 3M Healthcare, USA) (14). Resting heart rate (RHR) was measured using a heart rate monitor (Polar FT2 Heart Rate Monitor, USA). Mean arterial pressure was determined using the following equation: MAP = DBP + [0.33 + (HR × 0.0012)] (14).
Capillary finger prick blood was used to determine total cholesterol (TC), high-density cholesterol (HDL-C), and triglycerides (TG). Low-density lipoprotein cholesterol (LDL-C) was calculated using the Friedewald method: LDL-C = TC - HDL-C + [TG/5] (6) and TC: HDL-C, LDL-C: HDL-C, and non-HDL-C (n-HDL-C) were calculated using the data obtained from the Reflotron® system (Roche Products Pty Ltd, Randburg, South Africa). The reliability of the tests has previously been confirmed (15).
To assess body composition, each participant was required to wear no shoes and minimal clothing during the body composition evaluation. Body mass (BM) was measured on a medical scale (Trojan BSA16056v, Duteck Industrial co. ltd, Taiwan), while stature was measured using a stadiometer (Seca Stadiometer, 216, Seca, USA). Body mass index (BMI) was calculated by dividing body weight (kg) by stature squared (m²) (16).
Cardiorespiratory fitness (VO2max) was estimated using the Queen’s College Step Test (17, 18). During this test, the participant stepped up and down a 41.3 cm step for 3 min. Participants completed 22 steps/minute in time with a metronome to maintain tempo. The recorded heart rate was substituted into the following equation to calculate VO2max: VO2max (mL.kg.min-1) = 111.33 – 0.42 x heart rate (bpm).
3.3. Intervention Program
While the CON participants were required to maintain their normal daily activities, the HTG and METG participated in their respective one-hour training programs thrice weekly (non-consecutively) for eight weeks (11, 13, 19, 20). Each HTG and METG session began and concluded with a five-minute cycle at an HR of less than 100 bpm (13). Following the warm-up, the HTG and METG engaged in eight 30-second stretching exercises (12). The HTG and METG performed the following RT exercises: shoulder press, triceps extension, chest press, dumbbell shoulder shrug, latissimus dorsi pull-downs, bicep curl, horizontal leg press, calf raises, leg extensions, prone hamstring curl, and abdominal crunches (13, 19, 20). However, while the HTG completed three sets of 6 - 10 repetitions at 75 - 85% one-repetition maximum (1-RM) and a 30 - 60 s rest between sets, the METG completed three sets of 15 repetitions at 65 - 67% 1-RM and a rest of less than 30 s between sets (11).
3.4. Statistical Analysis
Statistical analyses were performed using the statistical package for the social sciences (SPSS) version 25.0 for Windows (SPSS-25) (IBM Corporation, Armonk, NY). Data were reported as means ± standard deviations (SD), while the pre- and post-test comparisons within groups were performed using paired t-tests. Levene’s test was utilized to determine the homo- or heterogeneity of the measured variables at pre-test, followed by a Hochberg or Dunnet T3 post-hoc test completed at post-test level. A confidence level of P ≤ 0.05 was considered statistically significant.
4. Results
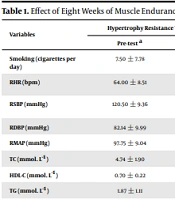
From the initial 45 participants, 42 completed the study and were included in the final analysis (HTG: n = 13; METG: n = 15; CON; n = 14) (Table 1). Three participants were unable to attend the post-test. At pre-test, all three groups were found to be homogenous (P > 0.05) for number of cigarettes smoked daily (P = 0.149), RSBP (P = 0.762), RDBP (P = 0.737), RMAP (P = 0.971), TC (P = 0.596), HDL-C (P = 0.198), TG (P = 0.115), LDL-C (P = 0.808), HDL-C: LDL-C ratio (P = 0.494), n-HDL-C (P = 0.429), body mass (P = 0.654), BMI (P = 0.853), and VO2max (P = 0.166). However, the three groups were heterogeneous at pre-test for RHR (P = 0.016), and TC: HDL-C ratio (P = 0.011).
| Variables | Hypertrophy Resistance Training Group (HTG) (N = 13) | Muscular Endurance Resistance Training Group (METG) (N = 15) | Non-Exercising Control Group (CON) (N = 14) | ||||||
|---|---|---|---|---|---|---|---|---|---|
| Pre-test a | Post-test a | P-Value | Pre-test a | Post-test a | P-Value | Pre-test a | Post-test a | P-Value | |
| Smoking (cigarettes per day) | 7.50 ± 7.78 | 10.50 ± 14.85 | 0.656 | 7.41 ± 4.69 | 3.26 ± 2.43 | 0.037b | 10.00 ± 2.67 | 10.40 ± 12.35 | 1.000 |
| RHR (bpm) | 64.00 ± 8.51 | 64.14 ± 7.86 | 0.922 | 67.53 ± 15.45 | 62.20 ± 10.26 | 0.084 | 64.38 ± 7.04 | 64.85 ± 8.62 | 0.894 |
| RSBP (mmHg) | 120.50 ± 9.36 | 116.29 ± 10.23 | 0.200 | 117.47 ± 10.99 | 109.80 ± 10.02 | 0.002b | 120.23 ± 9.86 | 116.62 ± 9.29 | 0.365 |
| RDBP (mmHg) | 82.14 ± 9.99 | 76.50 ± 7.89 | 0.130 | 79.20 ± 8.91 | 72.93 ± 6.46 | 0.006b | 80.85 ± 9.55 | 77.69 ± 9.69 | 0.433 |
| RMAP (mmHg) | 97.75 ± 9.04 | 92.69 ± 8.44 | 0.024b | 94.99 ± 9.16 | 87.87 ± 7.17 | 0.000b | 96.90 ± 8.91 | 93.59 ± 8.62 | 0.373 |
| TC (mmol. L-1) | 4.74 ± 1.90 | 4.49 ± 1.88 | 0.573 | 5.34 ± 2.16 | 4.03 ± 0.85 | 0.010b | 5.31 ± 2.88 | 4.60 ± 0.68 | 0.300 |
| HDL-C (mmol. L-1) | 0.70 ± 0.22 | 0.56 ± 0.14 | 0.027b | 0.70 ± 0.32 | 0.48 ± 0.12 | 0.026b | 0.54 ± 0.21 | 0.52 ± 0.18 | 0.671 |
| TG (mmol. L-1) | 1.87 ± 1.11 | 1.33 ± 0.45 | 0.161 | 3.23 ± 2.78 | 1.31 ± 0.40 | 0.010b | 2.18 ± 1.60 | 1.94 ± 1.04 | 0.517 |
| LDL-C (mmol. L-1) | 4.65 ± 2.24 | 4.16 ± 1.78 | 0.375 | 5.28 ± 2.39 | 3.81 ± 0.91 | 0.007b | 5.28 ± 3.03 | 4.47 ± 0.87 | 0.227 |
| TC: HDL-C | 6.82 ± 1.90 | 8.03 ± 1.59 | 0.009b | 8.02 ± 2.55 | 9.05 ± 3.20 | 0.173 | 11.36 ± 8.58 | 10.08 ± 4.48 | 0.401 |
| HDL-C: LDL-C | 0.17 ± 0.05 | 0.14 ± 0.04 | 0.038b | 0.17 ± 0.04 | 0.13 ± 0.05 | 0.018b | 0.13 ± 0.07 | 0.12 ± 0.06 | 0.954 |
| n-HDL-C | 4.04 ± 1.75 | 3.93 ± 1.76 | 0.790 | 4.64 ± 1.94 | 3.55 ± 0.87 | 0.010b | 4.77 ± 2.85 | 4.08 ± 0.77 | 0.295 |
| Body Mass (kg) | 80.22 ± 13.08 | 80.43 ± 12.62 | 0.777 | 79.25 ± 14.57 | 78.60 ± 15.32 | 0.498 | 78.87 ± 9.92 | 79.25 ± 10.11 | 0.418 |
| BMI (kg.m-2) | 25.89 ± 2.24 | 28.07 ± 8.38 | 0.333 | 27.04 ± 3.25 | 26.83 ± 3.74 | 0.529 | 25.33 ± 2.77 | 25.44 ± 2.71 | 0.428 |
| VO2max (ml.kg-1.min-1) | 46.47 ± 9.04 | 48.09± 6.94 | 0.255 | 46.37 ± 7.66 | 63.62 ± 7.86 | 0.001b | 44.81 ± 5.57 | 44.58 ± 6.16 | 0.873 |
Effect of Eight Weeks of Muscle Endurance and Hypertrophy RT on Cardiovascular Disease Risk in Sedentary Males
The HTG were found to have significant changes in RMAP (P = 0.024), HDL-C (P = 0.027), TC: HDL-C (P = 0.009) and HDL-C: LDL-C (P = 0.038) (Table 1). In turn, the METG observed significant changes in smoking (P = 0.037), RSBP (P = 0.002), RDBP (P = 0.006), RMAP (P = 0.000), TC (P = 0.010), HDL-C (P = 0.026), TG (P = 0.010), LDL-C (P = 0.007), HDL-C: LDL-C (P = 0.018), n-HDL-C (P = 0.010), and VO2max (P = 0.001)
Post-hoc ANOVA analysis revealed no significant difference in efficacy between the HTG and METG for RMAP (P = 0.138), HDL-C (P = 0.359), and HDL-C: LDL-C (P = 0.664).
5. Discussion
This study found that while the hypertrophy RT resulted in improvements in three of the 15 variables, the muscular endurance RT improved 10 of the 15 variables. While exercise is thought to be an effective aid for smoking cessation due to its ability to reduce cigarette craving and withdrawal symptoms, its benefits appear to be highly variable (21-23). Furthermore, little research has examined the effect of exercise on smokers and focused exclusively on aerobic modes of exercise (23). In this study, muscular endurance RT reduced the number of cigarettes smoked daily as it may have proven to be effective at reducing anxiety sensitivity and dysphoria (24). The novelty of this finding demonstrates the clinical importance of engaging the correct RT modality to offset the risk of tobacco smoking.
Research on the effect of RT on RSBP is contradictory (25-29), and the findings of this study support this contradiction as muscular endurance RT proved superior to hypertrophy RT at reducing RSBP. This is because RT’s effect on blood pressure may be determined by the degree of isometric contraction, the load lifted (intensity), number of repetitions, and/or muscle fiber activation (26). However, it must still be noted that even a 3 mmHg reduction in RSBP can decrease coronary death by between 5 - 9% and general morbidity by 4% (25). While RT has previously been demonstrated to reduce RDBP (25, 27, 29), this study found that RDBP was only decreased in the METG, as this mode may be better able to evoke stimulation of sensory nerve endings in response to increased muscle and metabolic activity (26). Importantly, in this study, both modes of RT improved RMAP demonstrating their efficacy at enhancing blood perfusion (25). This was contrary to the findings of Elliot et al. (30). This contradiction could be related to the hormonal influences on RMAP arising due to gender differences of participants.
Research on the effect of RT on TC are contradictory (31). Similarly, this study only found improvements in TC following muscular endurance RT. Since HDL-C is seen to exhibit anti-atherogenic, cardio-protective effects, the deleterious decrease in HDL-C following both modes of RT in this study are concerning. This may be due to the present study utilizing RT with insufficient intensity to elevate the synthesis and secretion of LPL (25). This finding further adds to the ambiguity in research on the role of RT on HDL-C (30, 32-37). Research on the effect of RT on TG is indecisive (6, 29, 30, 35, 37). This study only demonstrated changes following MET and not HT, which was likely due to the varying intensity (37). Low-density lipoprotein cholesterol catalyzes CVD development (38). Newly, this study demonstrated that muscular endurance RT and not hypertrophy RT decreased LDL-C. This is in opposition to much of the research, which demonstrates that RT has no effect on LDL-C (30, 39-42). This study further revealed that TC: HDL-C increased following hypertrophy RT, while previous studies have demonstrated decreases (7) and others no changes (36). Despite the deleterious decreases in HDL-C following both modes of RT, this study revealed that both modes still decreased HDL-C: LDL-C. In contrast, Shaw and Shaw (36) revealed that 16 weeks of RT failed to elicit any change in HDL-C: LDL-C. This study also revealed that only muscular endurance RT decreased non-HDL-C. This is an important finding in that n-HDL-C is a clinical marker of the small, dense LDL (36). On the contrary, Shaw and Shaw (36) demonstrated that 16 weeks of RT failed to produce an improvement in n-HDL-C.
Traditionally, the maintenance or loss of body mass requires both limiting calorie consumption while increasing calorie expenditure (43). However, calorie restriction may lead to the loss of lean body mass (LBM) instead of fat mass (43). If RT is added to the exercise routine, LBM may at least be maintained or increased (43). This could explain the reason for body mass remaining unchanged in this study and in similar studies (32, 44-46). Only a few studies have indicated that RT can reduce body mass (12, 47). Since BMI’s anthropometric measures are directly proportional to body mass (48), it is not unexpected that none of the RT programs in this study, and that of Shaw and Shaw (12), Yavari et al. (42), and Schjerve et al. (46) improved BMI.
Increased VO2max is associated with a decreased prevalence of morbidity and mortality of CVD and CVD-associated risk factors (6). While aerobic training is unequivocally the preferred mode of exercise to improve VO2max, this study’s muscular endurance RT program and previous research has demonstrated improvements in VO2max following RT (6, 28, 29, 44, 49). In addition, this study also supports the finding that RT does not always improve VO2max (6, 50). The findings of this study support the supposition that the duration of a RT program may not be a critical factor in altering VO2max, but rather other design and non-design factors (42).
5.1. Limitations
The present study had some limitations. While there are challenges with using smoking self-report measures as a tool to track tobacco use, this measure will continue to be the popular approach due to the lack of more objective means of assessment. Furthermore, it is unclear whether a longer intervention period would result in positive improvements since the effect of exercise may require a certain time of latency (as such required on HDLC) before the changes can be proved.
5.2. Conclusions
In conclusion, this study’s finding that muscular endurance RT is superior to hypertrophy RT when attempting to mitigate CVD risk factors simultaneously has demonstrated an urgent need to determine and compare the effects of the various modes of RT on CVD risk. Importantly, this comparison will allow health professionals to understand which mode of RT is most effective in reducing the specific risk factors associated with CVD.
