


1. Background
The running stage in a triathlon competition has the greatest impact on the athlete’s final ranking (1, 2). An important parameter affecting the ability to run more economically and, therefore, faster is myotendinous stiffness. Myotendinous stiffness is related to the collagen content of the muscle and tendon and can be estimated during running by changes in vertical stiffness (kvert) of the lower body and by the spatiotemporal organization of the running step (3-7). Kvert describes the vertical displacement of the center of mass (COM) in response to the vertical ground reaction force (Fv). An increased kvert has been related to greater neuromuscular adaptions and superior running performance (7-9), indicating that in runners with greater kvert, the bounce is optimized, meaning a greater contribution of tendons relative to muscle within muscle-tendon units (10).
The spatiotemporal organization of the running step is characterized by two asymmetries of the rebound (3, 10): (1) the on-off ground asymmetry; and (2) the landing-takeoff asymmetry. Based on the vertical oscillation of the COM, the on-off ground asymmetry divides the step period into two parts: the effective contact time (tce) during which the Fv is greater than body weight (BW), and the effective aerial time (tae) during which Fv is lower than BW (11). At low speeds of running tce is equal to tae, (symmetric rebound); meanwhile, at high speeds, tae is greater than tce (asymmetric rebound) (11). On the other hand, the landing-takeoff asymmetry divides the tce into two parts: the push time (tpush), period during which muscles perform positive work, and the brake time (tbrake), period during which muscles perform negative work. At low and intermediate running speeds, there is a difference between the duration of negative (tbrake) and positive work (tpush), where tpush > tbrake (i.e. a landing-takeoff asymmetry) (4). The fact that tpush > tbrake suggests an important contribution of the contractile machinery to the work production (5, 12, 13). However, at speeds above ∼ 3.9 m.s−1 tpush ≈ tbrake, likely as a result of increased muscle activation and the substitution of the work contribution from the contractile machinery by the spring storage and recovery by tendons.
As speed increases, Fv and kvert increase (14). The higher kvert results in an asymmetric on–off ground rebound, which has an antagonistic effect on the landing–takeoff asymmetry, as indicated by the enhanced spring-like mechanism of running (4). This spring function depends on the elastic properties of the musculoskeletal system, of which the structural proteins, titin, and collagen in the extracellular matrix (15), and the myotendinous junction (the connection between the muscle and tendon) play a prominent role in the resistance to elongation of the muscle (4), establishing the stiffness of the limb structure. It is relevant to consider that kvert is the resultant of the entire limb structure, like bone, muscle, tendons, and ligaments (14).
The function of the musculoskeletal tissues depends on the structure given by the collagen-rich extracellular matrix (ECM). The turnover of ECM is influenced by the physical activity and collagen synthesis, inducing an increase of mechanical load. This issue plays an important role in the force transmission in the muscle fiber (16). Previous studies have shown that supplementation with amino acids found in collagen, such as proline, glycine, and hydroxyl proline, combined with ascorbic acid, improve collagen synthesis (16-18), potentially resulting in improved mechanical strength and stiffness (19). However, to our knowledge, whether hydrolyzed collagen (HC) supplementation affects the mechanical stiffness of the lower body during running, in turn modifying the bouncing mechanism has not been assessed.
2. Objectives
Therefore, the aim of this study was to determine if HC supplementation modifies the bouncing mechanism of running. Based on the previously documented impact of HC supplementation on strength and muscle stiffness, we hypothesized that HC supplementation would result in increased kvert and an optimized rebound during running in triathletes, reflected by a smaller tce/tae ratio and a greater tbrake/tpush ratio in the CollG as compared to CG.
3. Methods
3.1. Participants
Nine active male triathletes were recruited (see Table 1 for individual characteristics of the CollG group and the CG group). Participants signed an informed consent form, and the study was approved by the Finis Terrae University Ethics Committee (resolution 36/2018) and performed according to the Helsinki declaration.
| Variables | CollG (n 5) | CG (n 4) | 95% Confidence Interval for the Difference | d (Cohen) | |
|---|---|---|---|---|---|
| Lower | Upper | ||||
| Age (y) | 33.6 ± 3.3 | 30 ± 4.1 | -0.1 | 7.3 | -1.03 |
| Weight (kg) | 66.4 ± 3.8 | 70.6 ± 6.1 | -7.8 | 0.4 | 0.85 |
| Height (cm) | 171.7 ± 6.7 | 172.5 ± 4.5 | -3.7 | 3.6 | 0.15 |
| BMI (kg.m-2) | 22.5 ± 2.1 | 23.7 ± 1.6 | -4.8 | 2.5 | 0.63 |
| VO2max (L.min-1) | 3.5 ± 0.2 | 3.7 ± 0.2 | -3.9 | 3.4 | 1.00 |
| VO2max (mL.kg-1.min-1) | 53.2 ± 1.9 | 53.2 ± 3.2 | -3.5 | 3.8 | 0.00 |
| Training per week (h) | 16.6 ± 2.1 | 17.3 ± 1.4 | -4.3 | 3.1 | 0.38 |
Individual Characteristics in Collagen Group (CollG) and Control Group (CG) a
3.2. Study Design
In the first visit to the laboratory, maximum oxygen uptake (VO2max) was evaluated for each participant. The VO2max was determined by a breath-by-breath pulmonary gas exchange system (Ergocard, Medisoft, Belgium) during an incremental treadmill test. The starting speed was 8 km/h, with speed increments of 1 km/h every 60 s, without slope. A test was considered maximal when three of the following criteria were fulfilled: (1) VO2 plateau at peak exercise; (2) respiratory exchange ratio ≥ 1.10; (3) peak HR ≥ 90% of the theoretic maximal HR (220-age); and (4) indication of maximal exhaustion by the athlete. VO2max was defined as the highest 30 s average in oxygen uptake.
In the second visit to the laboratory (48 hours later), all athletes performed a 10-minute warm-up, including running on the treadmill at ~ 2.8 m.s−1. After the warm-up, the participants ran on an instrumented treadmill (treadmill: Hp/Cosmos, Germany; force platform: Arsalis, Belgium) at three different speeds (3.9, 4.4 and 5.0 m.s-1) for 30 seconds, with a 2-minute rest between each speed to avoid a possible fatigue effect. Laboratory room temperature was set to 23ºC. Air humidity was in the 50 - 55% range. Hydration status was not recorded previous to testing, but participants were encouraged to maintain an adequate liquid intake a day previous to testing. All rocedures were performed at the same time of day.
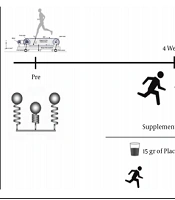
3.3. Supplement Intake
The participants were then randomly assigned to either the collagen group (CollG, n = 5) or the control group (CG, n = 4); the athletes were supplemented 3 times per week for 4 weeks. One hour after consumption of their respective supplement, participants performed 4 repetitions of 100 m sprints on the track to increase the mechanical demand of the lower body, as exercise acutely stimulates collagen synthesis (Figure 1) (20). All beverages were delivered in a double-blind manner. The participants in the CollG received 15 g powder of HC (Great lakes gelatin, Grayslake, IL, USA, the content it’s 36 mg of sodium, 12 g of collagen hydrolysate, and 43 kcal per 12 g serving). This was diluted in 500 mL of water. The participants in the CG received 15 g of maltodextrin (Chile Chemicals, Santiago, Chile) diluted in 500 mL of water.
.")
Study design (HC, hydrolyzed collagen).
3.4. Measurements of the Bouncing Mechanism of Running
Division of the steps. Steps were divided according to the Fv–time (Figure 2) The effective contact time (tce) was defined as the period during which Fv ≥ BW, and the effective aerial time (tae) was defined as the period during which Fv < BW (11). The contact time (tc) was defined as the period during which Fv > 10 N, and the aerial phase (ta) was defined as the period during which Fv ≤ 10 N. The work done to move the COM was computed from the ground reaction forces (GRF) using a similar method as described by Gosseye (21). The period tpush and tbrake were defined as the duration of the positive and of the negative work phases, respectively.
, vertical displacement of the center of mass (S<sub>v</sub>, dotted line), vertical velocity of the center of mass (V<sub>v</sub>, dashed line), effective contact time (t<sub>ce</sub>, left arrow), effective aerial time (t<sub>ae</sub>, right arrow) during running at 4.44 m.s<sup>-1</sup>.")
Representative figure for the vertical acceleration (av, solid line), vertical displacement of the center of mass (Sv, dotted line), vertical velocity of the center of mass (Vv, dashed line), effective contact time (tce, left arrow), effective aerial time (tae, right arrow) during running at 4.44 m.s-1.
Vertical stiffness. At each step, the second peak [the “active” peaks, Pmax, (22)] of Fv was measured. The vertical displacement of the COM (Sv) was computed by double time integration of Fv/m, as described by Dewolf et al. (13). The maximum vertical displacement of Sv during stance (Δy) was then measured. Finally, the vertical stiffness kvert was computed as kvert = Pmax/Δy, as in Butler, Crowell, & Davis (2003) (23).
3.5. Statistical Analysis
For each variable, the normality of the data was checked using the D’Agostino-Pearson test. Two-way ANOVAs and post-hoc Fisher’s LSD corrections were performed to compare pre-and post-conditions for both groups. The variables considered were the speeds (4.44 m.s-1, 5.55 m.s-1, and 6.66 m.s-1) and the groups CollG and CG. All statistical analysis was performed using GraphPad Prism 6 software (USA). Alpha levels were set at 0.05. The effect size intragroup was determined by calculating Cohen’s d values (Cohen, 1977). Cohen’s d thresholds for small, moderate, and large effects were 0.2, 0.5, and 0.8, respectively. By intergroup post condition effect size, Hedges' g value was used (Hedges, 1981).
4. Results
4.1. Maximal Oxygen Uptake
The VO2max was not modified between the two groups and over time during the 4 weeks of supplementation (time P-value 0.377, group P-value 0.718, and interaction P-value 0.641) (Table 1).
4.2. Vertical Stiffness
In the CollG, kvert at 4.44 m.s-1 speed was 26.7 ± 8.8 N/m and 24.7 ± 2.7 N/m pre- and post-condition, respectively (CI -3.2 to 7.19) (ES = 0.21). In the CG, kvert was 26.2 ± 1.8 N/m and 25.1 ± 1.8 N/m pre- and post-condition, respectively (CI -4.7 to 6.8) (ES = 0.43). At 5.55 m.s-1 speed, kvert in the CollG was 27.4 ± 12.7 N/m and 32.8 ± 3.6 N/m (CI -15.1 to 4.4) pre-and post-condition, respectively (ES = -0.30). In the CG, kvert was 34.2 ± 1.8 N/m and 33.2 ± 3.7 N/m pre- and post-condition, respectively (CI -9.9 to 11.9) (ES = 0.40). At 6.66 m.s-1 speed, kvert in the CollG was 41.56 ± 28.6 N/m and 53.7 ± 16.5 N/m pre- and post-condition, respectively (CI -26 to 1.6) (ES = 0.36). In the CG, kvert was 49.7 ± 9.4 N/m and 49.8 ± 9.4 N/m pre- and post-condition, respectively (CI-15.5 to 15.4) (ES = 0). The effect size post-condition intergroup was -0.17, -2.52, and 2.21 at 4.44, 5.55, and 6.66 m.s-1 speeds, respectively.
No significant interaction between time and group was observed regarding kvert (Figure 3). Also, for Pmax there were no significant interaction (P-value 0.996), speed (P-value 0.807) and group effects (P-value 0.519) and no significant time effect (pre vs post; see Table 2) in either group. The Sv was affected by the speed (P-value 0.002), but no significant interaction (P-value 0.0998), group effect (P-value 0.878), and time effect (pre vs post; see Table 2) were found.
 (*significant difference in function of increase speed).")
Mean and standard deviation of the vertical stiffness (kvert) (*significant difference in function of increase speed).
| Speed (m.s-1) | Sv | Pmax | ||||||||||
|---|---|---|---|---|---|---|---|---|---|---|---|---|
| Pre (cm) | Post (cm) | Change (%) | 95% Confidence interval for the difference | d (Cohen) | Pre ( N/Bw ) | Post ( N/Bw ) | Change (%) | 95% Confidence interval for the difference | d (Cohen) | |||
| Lower | Upper | Lower | Upper | |||||||||
| 4.44 | ||||||||||||
| CollG (n 5) | 8.1 ± 1.7 | 8.5 ± 1.7 | 4.9 | -1 | 0.2 | 0.16 | 2.8 ± 0.0 | 2.8 ± 0.3 | 2.7 | -0.2 | 0 | 0 |
| CG (n 4) | 8.1 ± 0.5 | 8.6 ± 0.3 | 6.7 | -1.2 | 0.1 | 0.85 | 2.7 ± 0.0 | 2.8 ± 0.1 | 4.4 | -0.2 | 0 | 1 |
| 5.55 | ||||||||||||
| CollG (n 5) | 7.1 ± 1.6 | 7.6 ± 1.6 | 7.4 | -1.1 | 0.1 | 0.22 | 2.8 ± 0.4 | 2.8 ± 0.4 | 1.3 | -0.1 | 0 | 0 |
| CG (n 4) | 7.1 ± 0.3 | 7.5 ± 0.3 | 6.9 | -1.1 | 0.2 | 0.94 | 2.7 ± 0.0 | 2.8 ± 0.1 | 6.6 | -0.3 | 0 | 1 |
| 6.66 | ||||||||||||
| CollG (n 5) | 5.9 ± 1.3 | 6.3 ± 1.6 | 6.5 | -0.7 | 0 | 0.19 | 2.7 ± 0.4 | 2.9 ± 0.4 | 3.5 | -0.4 | 0.1 | 0.35 |
| CG (n 4) | 5.9 ± 0.3 | 5.9 ± 0.3 | -0.3 | -0.4 | 0.4 | 0 | 2.7 ± 0.1 | 2.9 ± 0.2 | 5.8 | -0.4 | 0.1 | 0.89 |
Average Range of the Maximum Vertical Displacement (Sv) and Average Second Peak (Pmax) of Vertical Ground Reaction Force of the Center of Mass (COM) During One Running Step in Collagen Group (Collg) and Control Group (CG) a
4.3. The Asymmetries of the Rebound
No significant main effect or interaction were found between time and group regarding tce and tae (pre vs. post; see Table 3). However, as speed increased, tce was affected in both groups (P-value < 0.0001) meaning that the rebound became more and more asymmetric (tce < tae). The ratio of tce/tae did not change in the CollG (0.65 ± 0.05 in pre-condition and 0.64 ± 0.04 in post-condition; ES = -0.15), and the CG (0.64 ± 0.05 in pre-condition and 0.64 ± 0.04 in post-condition; ES = 0) (F = 0.05; P-value 0.981) (Figure 4).
| Speed (m.s-1) | tce | tae | ||||||||||
|---|---|---|---|---|---|---|---|---|---|---|---|---|
| Pre (s) | Post (s) | Change (%) | 95% Confidence Interval for the Difference | d (Cohen) | Pre (s) | Post (s) | Change (%) | 95% Confidence Interval for the Difference | d (Cohen) | |||
| Lower | Upper | Lower | Upper | |||||||||
| 4.44 | ||||||||||||
| CollG (n 5) | 0.137 ± 0.01 | 0.136 ± 0.01 | -0.7 | -0.008 | 0.01 | 0.07 | 0.196 ± 0.02 | 0.201 ± 0.02 | 2.6 | -0.015 | 0.004 | 0.17 |
| CG (n 4) | 0.136 ± 0.01 | 0.142 ± 0.00 | 4.4 | -0.016 | 0.004 | 0.6 | 0.196 ± 0.00 | 0.203 ± 0.00 | 3.6 | -0.018 | 0.003 | 0.35 |
| 5.55 | ||||||||||||
| CollG (n 5) | 0.12 ± 0.01 | 0.124 ± 0.01 | 3.3 | -0.013 | 0.004 | 0.28 | 0.187 ± 0.02 | 0.195 ± 0.02 | 4.3 | -0.018 | 0.001 | 0.28 |
| CG (n 4) | 0.119 ± 0.00 | 0.122 ± 0.00 | 2.5 | -0.012 | 0.007 | 0.03 | 0.186 ± 0.00 | 0.192 ± 0.00 | 3.2 | -0.017 | 0.004 | 0.05 |
| 6.66 | ||||||||||||
| CollG (n 5) | 0.104 ± 0.01 | 0.105 ± 0.01 | 1.0 | -0.006 | 0.005 | 0.07 | 0.175 ± 0.02 | 0.181 ± 0.02 | 3.4 | -0.012 | 0 | 0.21 |
| CG (n 4) | 0.104 ± 0.01 | 0.106 ± 0.00 | 1.9 | -0.007 | 0.005 | 0.2 | 0.175 ± 0.00 | 0.173 ± 0.00 | -1.1 | -0.005 | 0.009 | -0.02 |
Average Range of the Effective Contact Time (tce) and the Effective Aerial Time (tae) During One Running Step in Collagen Group (Collg) and Control Group (CG) a
 and control group (CG).")
A, mean and standard deviation of the ratio tce/tae; B, of the ratio tbrake/tpush of collagen group (CollG) and control group (CG).
4.4. Landing-Takeoff Asymmetry
No significant main effect of time and group and interaction were observed regarding tpush and tbrake (pre vs post; see Table 4). However, as speed increased, tbrake (P-value 0.0027) and to a greater extent tpush (P-value 0.0004) were affected in both groups (P-value < 0.0027). As a result, at fast speeds, the difference between tpush and tbrake (the landing-takeoff asymmetry) was reduced. The ratio of tbreak/tpush had a non-significant decrease of 12.6% in CollG (1.59 ± 0.03 in pre-condition and 1.41 ± 0.08 in post-condition; ES = -2.10), meanwhile in the CG it had a non-significant increase of 6% (1.62 ± 0.04 in pre-condition and 1.71 ± 0.37 in post-condition; ES = -0.24) (F = 2.192; P-value 0.13) (Figure 4).
| Speed (m.s-1) | tpush | tbrake | ||||||||||
|---|---|---|---|---|---|---|---|---|---|---|---|---|
| Pre (s) | Post (s) | Change (%) | 95% Confidence Interval for the Difference | d (Cohen) | Pre (s) | Post (s) | Change (%) | 95% Confidence Interval for the Difference | d (Cohen) | |||
| Lower | Upper | Lower | Upper | |||||||||
| 4.44 | ||||||||||||
| CollG (n 5) | 0.72 ± 0.02 | 0.73 ± 0.01 | 1.4 | -22.9 | 21 | 0.44 | 0.1005 ± 0.01 | 0.09634 ± 0.01 | -4.1 | -14.3 | 22.7 | -0.31 |
| CG (n 4) | 0.66 ± 0.01 | 0.76 ± 0.01 | 15.2 | -34.6 | 14.4 | 7.07 | 0.1006 ± 0.01 | 0.09746 ± 0.01 | -3.1 | -17.5 | 23.8 | -0.24 |
| 5.55 | ||||||||||||
| CollG (n 5) | 0.57 ± 0.01 | 0.64 ± 0.01 | 12.3 | -18.2 | 3.8 | 4.95 | 0.08982 ± 0.01 | 0.09037 ± 0.01 | 0.6 | -36.1 | 35.1 | 0.7 |
| CG (n 4) | 0.56 ± 0.01 | 0.61 ± 0.01 | 8.9 | -17.6 | 7 | 3.53 | 0.08772 ± 0.01 | 0.1247 ± 0.06 | 42.2 | -76.8 | 2.7 | 0.6 |
| 6.66 | ||||||||||||
| CollG (n 5) | 0.5 ± 0.01 | 0.55 ± 0.01 | 10.0 | -11.1 | 2.4 | 3.53 | 0.07544 ± 0.00 | 0.07287 ± 0.00 | -3.4 | -4.6 | 9.7 | -0.27 |
| CG (n 4) | 0.46 ± 0.01 | 0.45 ± 0.01 | -2.2 | -6.9 | 8.3 | 0.7 | 0.07396 ± 0.00 | 0.07961 ± 0.01 | 7.6 | -13.7 | 2.4 | 0.51 |
Average Range of the Time of Push (tpush) and the Time of Brake (tbrake) During One Running Step in Collagen Group (Collg) and Control Group (CG) a
5. Discussion
The aim of this study was to determine if HC supplementation increased the bouncing mechanism of running in recreational triathletes. Our results show that four weeks of intermittent HC supplementation does not modify kvert nor the spatiotemporal parameters of the running step at speeds of 4.44, 5.55, and 6.66 m.s-1 in recreational triathletes. However, a significant increase in kvert was observed as speed increased, leading to a greater on-off ground asymmetry (tce < tae) and a smaller landing takeoff asymmetry (tpush ≈ tbrake), confirming the hypothetical link between vertical stiffness and the spatiotemporal organization of the steps proposed by Cavagna et al. (2009).
Even though there was no significant effect of the treatment in the CollG compared with the CG, it seems relevant to analyze the ES of the ratios tbrake/tpush and tce/tae. The decrease of 12.6% (ES = 2.10) of tbrake/tpush in the CollG reflects the possibility of a greater incorporation of tendons relative to muscle within muscle-tendon units compared to the CG (increase of 6%, ES = -0.24) (10). According to Cavagna et al. (12) we could speculate that during running, the CollG used a better rebound by the contribution between tendons and muscle, compared to the CG. However, da Rosa et al. (7) suggest that the asymmetry of tbrake/tpush isn’t sensitive enough to represent the bouncing mechanism of running and propose the ratio tce/tae as a better measurement. We observed small ES in both groups tce/tae without change in kvert. Future studies should consider the use of the two asymmetries of the bouncing step to investigate the spring-mass behavior with the running performance, instead of other spatiotemporal parameters usually used in the literature (9).
We employed a protocol of four repetitions of 100-meter sprints after supplementation as a functional means to stimulate collagen synthesis over a period of four weeks, to induce an increase in lower limb stiffness without effect. In previous studies, collagen synthesis was increased in response to acute exercise (19, 20, 24, 25), e.g., Miller et al. (25) reported an increase of 0.077%.h-1 of fractional synthetic rate (FSR) in tendon collagen after 1 h of one-legged kicking exercise at 67% of maximum workload. This suggests that collagen synthesis is sensitive to resistance exercise. Regarding endurance training, Langberg et al. (24) evidenced an increase of type I collagen in peritendinous tissue after 3 h of running (36 km). Further, there’s evidence that supports that collagen synthesis is increased in response to prolonged training; specifically, Langberg et al. (26) reported an increased turnover of collagen type I in local connective tissue of the peritendinous Achilles' region after 4 and 11 weeks of physical training. However, it should be considered that this is the first study to date, which investigates the effect of exercise and supplementation of HC on lower limb stiffness.
With respect to the HC supplementation, Paxton et al. (19) reported an increase in collagen content, strength, and modulus of the sinew after treatment with ascorbic acid and proline (an amino acid found at a great amount in HC). Otherwise, Zdzieblik et al. (27) reported that supplementing a total of 1260 g of HC over 12 weeks combined with physical exercise (three times a week) increases muscle strength, fat-free mass, bone mass and decreases fat mass in elderly people. Also, Shaw et al. (18) declared that the supplementation of gelatine plus jumping road is effective in the increased collagen synthesis and modulus (stiffness) of the ligaments. It seems that the low volume, despite the high mechanical impact generated by sprint running used in our study, may not be sufficient to stimulate collagen synthesis and therefore induce an increase on stiffness. This means that the high impact of the stretch-shortening cycle (SSC) induced by jumping may be necessary to increase lower body stiffness as achieved in studies employing either a plyometric training program (28), or a muscular power exercise program (29).
We acknowledge that the current study has limitations. First, we did not perform anthropometric measurements on the participants. It is possible that changes in body composition could affect running mechanics; however, both groups had no changes in BW and responded similar to the supplementation protocol. Therefore, it is highly unlikely that this could affect the current findings. We also acknowledge that the present study has a small sample size, potentially leading to the null effects observed on lower-body stiffness. Future research should use a greater number of participants and associate the mechanical variables with body composition, especially skeletal muscle mass.
5.1. Conclusions
In conclusion, we showed that four weeks of 15 g of HC supplementation did not change kvert nor spatiotemporal organization of the running step in recreational triathletes. Future studies are still required to better understand the potential use of HC supplements for running performance enhancement.
