1. Background
Soccer, also known as football, is classified as a high intensity intermittent team sport where players experience many maximal or near-maximal sprints of short duration followed by brief recovery periods (1, 2). During a soccer match, about 90% of energy provision is derived from the aerobic energy system (3). Hence it is crucial for elite soccer players to have high aerobic endurance fitness to be able to play for 90 minutes and to recover between high-intensity sprints (4).
One of the best measures of cardiorespiratory fitness and endurance capacity performance is the maximal aerobic power, denoted by VO2max (5). It is defined as the maximum rate of oxygen consumption during exhaustive exercise while breathing air at sea level (6) and reflects the functional limit of the oxygen transport system in individuals (7-9). Previous studies have shown that there is a meaningful correlation between VO2max and the total running distance during a match (10). The VO2max of elite male soccer players is commonly between 50 - 75 mL.kg-1.min-1 (11, 12). Individual values higher than 70 mL.kg-1.min-1 are also reported in the literature. This range is significantly higher than the average male (with a VO2max of approximately 35 to 40 mL.kg-1.min-1), but is similar to those found in other team sports. However, it is lower than the VO2max of elite athletes in endurance sports, where values close to 90 mL.kg-1.min-1 are not uncommon. Based on past studies, a VO2max of 60 to 65 mL.kg-1.min-1 represents a threshold for acceptable performance of elite male soccer players (13).
The first and second ventilatory threshold (VT1 and VT2 respectively) are two other common measures of cardiorespiratory fitness. VT1 characterizes the point during exercise at which the breathing rate begins to increase, surpassing the normal ventilation rate. VT1 of an average male is between 50 and 75% of VO2max, but athletes have higher values (14). VT2, also known as the anaerobic or lactate threshold, is defined as the VO2 above which blood lactate surpasses resting concentrations during incremental exercise and reflects a transition from the predominance of aerobic to anaerobic metabolism. In theory, a higher lactate threshold shows that a player can sustain a higher average intensity in an activity, without accumulation of lactate (15).
Previous studies such as Tønnessen et al. (16), Gil et al. (17), and Davis et al. (18) have analyzed the relationship between VO2max and factors such as age, performance level, and player position in professional male soccer players. However, these previous studies do not address variation in such factors with respect to changes in other measures of cardiorespiratory fitness, notably VO2rest, VT1, and VT2. Moreover, these previous studies are mainly focused on players in European national or league teams in countries such as Hungary (11), Norway (16, 19), England (18) and Kosovo (20), and African teams (e.g., Cameroon (21) and Algeria (22)). Few previous studies (e.g. Al-Hazzaa et al. (23)) have examined cardiorespiratory fitness measures such as VO2max amongst Middle Eastern and Asian players. Furthermore, as indicated by Tønnessen et al. (16) and still true today, previous studies are mostly based on small samples.
2. Objectives
The purpose of this study is to address the above-described gaps by quantifying VO2max, first ventilatory thresholds (VT1 and VT2), and ventilatory efficiency at rest (VO2rest) as a function of weight, height, age, body mass index (BMI), body fat percentage (BFP), team performance and player position for a large number of professional male soccer players affiliated with clubs in the Iranian soccer league system. Iran has long been a major soccer power in Asia and the Middle East, and the current study contributes to the growing body of scientific literature in the field of modern soccer by being one of the first to specifically analyze cardiorespiratory fitness of soccer players in an Asian top League.
3. Methods
This study is based on data obtained in June 2016 from pre-competition medical assessments, performed annually in ‘Iran Football Medical Assessment and Rehabilitation Center’ (IFMARC). IFMARC is certified as a FIFA medical excellence center in the Middle East and presents a standard medical assessment and rehabilitation facility for Iranian national team players as well as a large number of clubs across the country. Subjects include 213 professional male soccer players from all 16 clubs in the highest division of the Iranian soccer league system known as the Persian Gulf Pro League. Each of the teams that took part in this study reported to IFMARC on separate days. All players in a team were assessed on the same day. This study was approved by the ethical committee of Iran University of Medical Sciences. The exclusion criteria were as follows: (1) unwillingness to participate in the research; (2) failure to complete the tests, due to reasons such as sports injuries that might be exacerbated by the tests; and (3) displaying symptoms that necessitate termination of the exercise testing.
Upon entering IFMARC, the test procedure was explained to the athletes, and they were asked to sign an informed consent before the medical assessment. Each player’s weight and height were then recorded. Body weight was measured to 0.1 kg and height to 1.0 cm using a standard balance and stadiometer (Balas, Iran), with the athletes wearing light clothing and no shoes. BMI was calculated as the weight in kilograms divided by the height in meters squared. Questionnaires were then used to determine factors such as age, player position, and athlete's team affiliation on the day of the tests. VO2max, VT1, VT2, and VO2rest were subsequently measured for each player. To estimate players’ aerobic capacity, an incremental maximal exercise test based on Bruce protocol (24) on a motor-driven treadmill (HP Cosmos medical running machine, model CE 0123) was administered.
The Bruce test protocol has been considered as the standard test for research; given its accuracy and reliability. The Bruce protocol test was continued until at least one of the following conditions of termination occurred: (1) chest pain and any symptoms of angina, systolic blood pressure ≤ 10 mmHg with an increase in test intensity, or decreased systolic blood pressure to less than pre-test levels; (2) no increase in heart rate with increasing test intensity; (3) emergence of severe fatigue, shortness of breath, dizziness, wheezing, cramp, claudication, nausea, imbalance, cyanosis, pallor, significant changes in the heart rhythm, and ST segment depression more than 1 mm, to the degree that the participant requests for the test to be discontinued (25).
To perform the test, the initial conditions of the treadmill were set at 10% grade with a speed of 1.7 mph. The speed of running was subsequently increased to 2.5 mph, 3.4 mph, 4.2 mph, 5.0 mph, and 5.5 mph at 3-minute intervals throughout the test. Also, the inclination of the treadmill was enhanced by 2% for each stage of test according to the Bruce protocol. The test was considered maximal when oxygen consumption reached a plateau and did not increase with increased exercise intensity or the subject asked to terminate the test due to maximal exertion. Respiratory gas samples (VO2 and VCO2) were recorded breath-by-breath. The flow and gas concentration sensors were analyzed with a Metalyzer 3B-R3 (Cortex, Germany) that was calibrated prior to each working day. Throughout the tests, the expired gases were initially averaged at 10-second intervals and later consolidated minute-by-minute for further analysis. VO2max was marked by the highest oxygen uptake value attained, expressed in mL.kg-1.min-1. All the tests were performed between 9 AM and 2 PM in ambient temperature ranging between 22 and 25 degrees of Celsius (°C).
Anthropometric data were measured by a bioelectric impedance analyzer (BIA) (TANITA, BC 418 segmental body model, Japan) immediately before the CPET and after emptying their bladder. The athletes were asked to put aside their metal objects with their feet making contact with the surface of the electrodes. The measurement takes on average, about 30 seconds. BIA output variables included total lean body mass, appendicular lean body mass (sum of appendicular lean mass of both upper extremities and lower extremities), lean body mass of trunk, skeletal muscle mass, skeletal muscle index (appendicular lean mass/ height2), and BFP.
The data was then analyzed using appropriate statistical tests, as described in the following. Normality of the data distribution were initially checked using Kolmogorov-Smirnov test. The distribution of height, weight, and body percentage fat were normal, but the rest of the data was not normally distributed. Since not all the data distributions were normal, we performed nonparametric test to analyze the data. Accepting the 5% significant level, nonparametric Spearman’s correlation test was performed to check for correlations. Team performance was evaluated based on ranking from 1st to 16th place in the subsequent 2016 - 17 Persian Gulf Pro League. Players were also classified into the following groups based on common practice in research literature [e.g. Tønnessen et al., (16)]: forwards or attackers (N = 36), midfielders (N = 85), defenders (N = 65), and goalkeepers (N = 23).
4. Results
Cardiorespiratory fitness measures (VO2max, VT1, VT2, and VO2rest) and the physical characteristics of the subjects, including age, height, weight, BMI, and BFP are summarized by mean, standard deviation and range in Table 1. In terms of mean ± standard deviation, the 213 male players participating in this study have VO2max = 55.3 ± 5.4 mL.kg-1.min-1, VT1 = 57.3 ± 4.2 (% max), VT2 = 92.6 ± 3.4 (% max) and VO2rest = 7.1 ± 1.4 mL.kg-1.min-1.
| Physical Characteristics | Test Subjects | ||
|---|---|---|---|
| Mean | Standard Deviation | Range | |
| Age (y) | 25 | 5 | 17-39 |
| Height (cm) | 181.2 | 6.8 | 164.0-200.0 |
| Weight (kg) | 76.1 | 8.1 | 59.7-98.8 |
| BMI (kg/m2) | 23.1 | 1.4 | 19.7-27.4 |
| BFP | 11.3 | 3.1 | 4.5-20.4 |
| VO2max (mL.kg-1.min-1) | 55.3 | 5.4 | 38-70 |
| VT1 (% max) | 57.3 | 4.2 | 42-73 |
| VT2 (% max) | 92.6 | 3.4 | 63-102 |
| VO2 rest (mL.kg-1.min-1) | 7.1 | 1.4 | 2-12 |
Physical Characteristics of the Subjects
The Spearman's rank correlation coefficient (rs) and probability value (P-value denoted as P) between cardiorespiratory fitness measures and physical characteristics of the subjects are presented in Table 2. As demonstrated, the association between VO2max and age, height, weight and BMI is considered statistically significant, but VO2max and BFP are uncorrelated. The three other measures of cardiorespiratory fitness (VT1, VT2, and VO2rest) have no statistically significant correlation with the physical characteristics of the soccer players.
| Variables | Height | Weight | BMI | Age | BFP |
|---|---|---|---|---|---|
| VO2max | rs = -0.34; P = 0 a | rs = -0.42; P = 0 a | rs = -0.30; P = 10-5 a | rs = -0.23; P = 10-3 a | rs = -0.11; P = 0.12 |
| VT1 | rs = 0.08; P = 0.24 | rs = 0.07; P = 0.29 | rs = 0.03; P = 0.64 | rs = 0.08; P = 0.25 | P = -0.01; P = 89 |
| VT2 | rs = 0.05; P = 0.46 | rs = 0.04; P = 0.59 | rs = 0.06; P = 0.43 | rs = 0.06; P = 0.38 | rs = 0.06; P =0 .37 |
| VO2rest | rs = -0.07; P = 0.32 | rs = -0.03; P = 0.71 | rs = 0.02; P = 0.74 | rs = 0.01; P = 0.92 | P = 0.00; P = 0.99 |
Spearman's Rank Correlation Coefficient (rs) and Probability Value (P) Between Cardiorespiratory Fitness Measures and Physical Characteristics of the Subjects
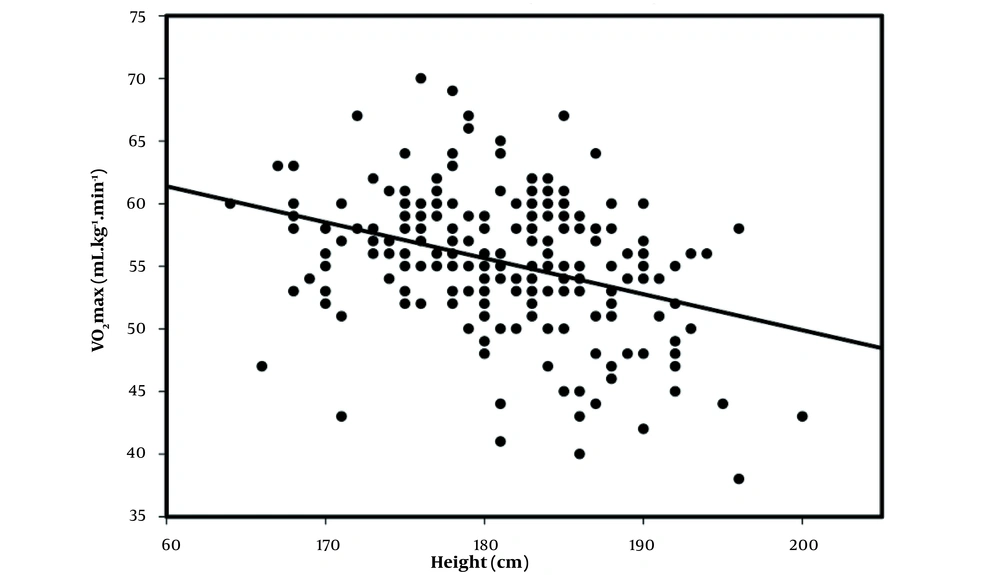
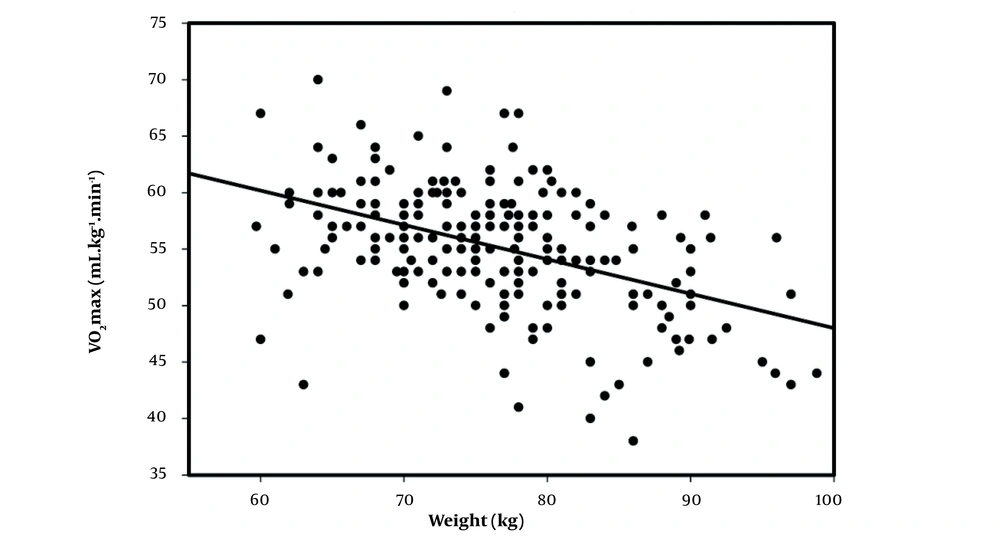
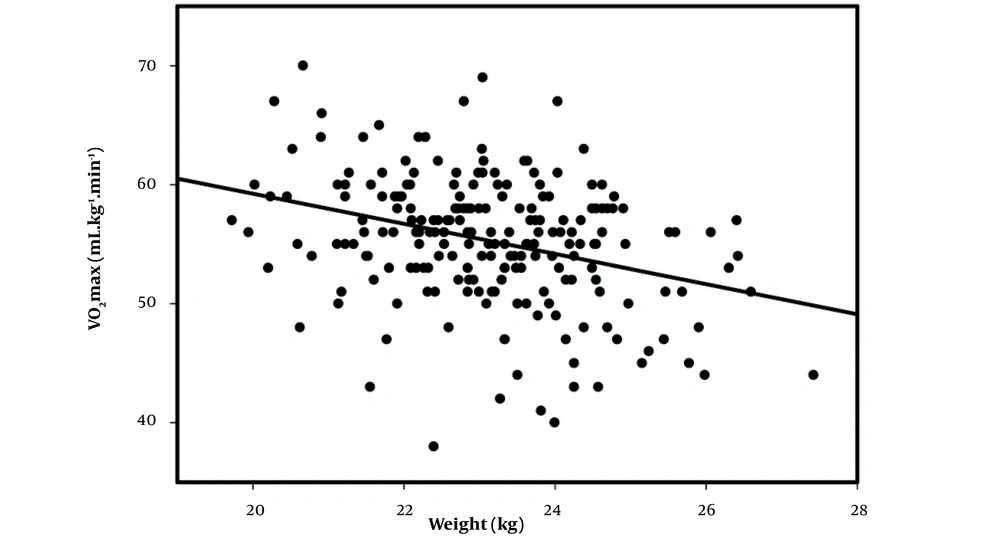
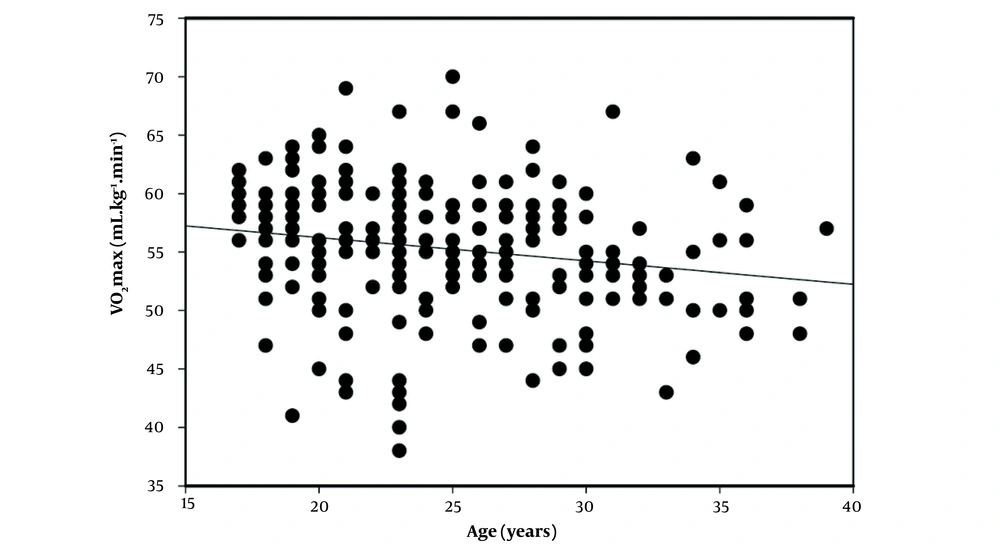
Figure 1 shows the correlation between VO2max and height. For this case, rs was -0.34, and the P-value was approximately zero. Figure 2 shows the correlation between VO2max and weight, for which rs was -0.42 and P-value was close to zero. Figure 3 shows the correlation between VO2max and BMI, where rs was -0.30 and P-value was 10-5. Since VO2max has correlation with weight and height, it is expected to also be in correlation with BMI. Figure 4 demonstrates the correlation between VO2max and age, for which rs = -0.23 and P = 10-3. Similar figures are not shown for uncorrelated pairs of variables.
Players from all 16 teams featured in the 2016 - 17 Persian Gulf Pro League participated in the tests, however as showed in Table 3, the number of participants differed for the various teams. Table 3 demonstrates 95% confidence intervals of VO2max, VT1, VT2, and VO2rest values as a function of team ranking. No correlation is observed between VO2max and team performance. All 16 teams had mean VO2max values between 49 and 58 mL.kg-1.min-1 with statistically insignificant differences. VT1, VT2, and VO2rest do not seem to be related to team performance either.
| Rank | Club Name (Abbreviation) | N a | VO2max (mL.kg-1.min-1) | VT1 (%) | VT2 (%) | VO2rest (mL.kg-1.min-1) | ||||
|---|---|---|---|---|---|---|---|---|---|---|
| LCI 95% | UCI 95% | LCI 95% | UCI 95% | LCI 95% | UCI 95% | LCI 95% | UCI 95% | |||
| 1 | Perspolis (pers) | 9 | 51.1 | 58.5 | 54.7 | 63.8 | 82.2 | 98.7 | 6.5 | 9.0 |
| 2 | Esteghlal (est1) | 17 | 51.2 | 56.3 | 54.6 | 59.8 | 89.9 | 93.5 | 5.8 | 7.6 |
| 3 | Teraktor Sazi (ter) | 14 | 53.4 | 57.6 | 57.5 | 61.8 | 92.3 | 95.4 | 6.1 | 8.1 |
| 4 | Zob Ahan (zb) | 14 | 55.9 | 59.7 | 53.7 | 58.7 | 89.8 | 94.6 | 6.2 | 7.5 |
| 5 | Sepahan (sep) | 19 | 54.2 | 61.6 | 54.5 | 57.3 | 91.5 | 94.1 | 6.5 | 7.3 |
| 6 | Peykan (pay) | 15 | 54.3 | 59.4 | 56.0 | 60.2 | 91.7 | 94.1 | 6.7 | 8.2 |
| 7 | Esteghlal Khuzestan (est2) | 10 | 53.6 | 58.4 | 55.3 | 60.9 | 90.5 | 93.5 | 5.7 | 7.3 |
| 8 | Gostaresh Foolad (gos) | 18 | 51.9 | 57.7 | 56.5 | 60.1 | 90.1 | 91.9 | 6.7 | 8.0 |
| 9 | Naft Tehran (naf) | 16 | 51.3 | 57.8 | 54.2 | 57.8 | 92.0 | 95.2 | 6.3 | 7.9 |
| 10 | Foolad (ful) | 27 | 53.8 | 57.0 | 55.4 | 58.4 | 91.8 | 93.5 | 6.7 | 8.0 |
| 11 | Padideh (pad) | 10 | 51.5 | 61.1 | 53.9 | 61.1 | 92.4 | 95.8 | 6.1 | 8.1 |
| 12 | Sanat Naft (san) | 14 | 50.3 | 56.0 | 53.4 | 60.0 | 92.1 | 93.8 | 6.1 | 7.6 |
| 13 | Saipa (sai) | 14 | 50.4 | 57.5 | 53.1 | 57.7 | 91.9 | 93.5 | 6.8 | 8.1 |
| 14 | Siah Jamegan (sia) | 8 | 52.0 | 61.0 | 53.9 | 60.8 | 90.2 | 96.8 | 6.6 | 8.6 |
| 15 | Saba Qom (sab) | 3 | 32.4 | 66.2 | 48.0 | 66.0 | 91.2 | 94.1 | 7.0 | 7.0 |
| 16 | Machine Sazi (mash) | 5 | 43.3 | 60.3 | 55.4 | 63.0 | 90.6 | 93.8 | 4.7 | 7.3 |
| P-value | 0.157 | 0.315 | 0.384 | 0.560 | ||||||
95% Confidence Intervals of Mean Values for Relative Maximal Aerobic Power (VO2max), First, and Second Ventilatory Thresholds (VT1 and VT2), and Ventilatory Efficiency at Rest (VO2rest) As a Function of Team Ranking
Based on the 95% confidence intervals of Table 4, the difference between VO2max of players in different positions is statistically significant. However, VT1, VT2, and VO2rest do not seem to be related to player position as the difference between mean values of the various positions is statistically insignificant.
| Position | N a | VO2max (mL.kg-1.min-1) | VT1 (%) | VT2 (%) | VO2rest (mL.kg-1.min-1) | ||||
|---|---|---|---|---|---|---|---|---|---|
| LCI 95% | UCI 95% | LCI 95% | UCI 95% | LCI 95% | UCI 95% | LCI 95% | UCI 95% | ||
| Goalkeeper | 23 | 47.1 | 52.4 | 54.4 | 58.0 | 91.4 | 93.8 | 5.9 | 6.9 |
| Defender | 65 | 53.5 | 55.9 | 56.8 | 58.7 | 92.3 | 93.5 | 6.9 | 7.6 |
| Forward | 36 | 54.2 | 57.8 | 56.3 | 59.0 | 92.1 | 94.0 | 6.6 | 7.5 |
| Midfielder | 85 | 55.9 | 57.9 | 56.1 | 58.1 | 91.3 | 93.1 | 7.0 | 7.6 |
| P-value | 1.40 × 10⁻⁷ | 0.430 | 0.521 | 0.047 | |||||
95% Confidence Intervals of Mean Values for Relative Maximal Aerobic Power (VO2max), First, and Second Ventilatory Thresholds (VT1 and VT2), and Ventilatory Efficiency at Rest (VO2rest) as a Function of Position
5. Discussion
The results of this study provide an overview of the cardiorespiratory fitness of soccer players in an Asian top league. Our analysis of a large number of soccer players demonstrates that there is significant correlation between VO2max and key physical characteristics of the subjects, notably age, height, weight, and BMI. VO2max is also correlated with player position. However, there is no statistically significant correlation between VO2max and team ranking, or between VT1, VT2, or VO2rest and the physical characteristics, player position, or team ranking. The physical characteristics and cardiorespiratory fitness measures of players in the Iranian soccer league are very similar to those reported for European countries, including England [Davis et al. (18)], Norway [Tønnessen et al. (16); Wisloeff et al. (19)], Hungary [Apor (11)], and Kosovo [Gjonbalaj et al. (26)]; and African countries such as Cameroon [Fomini Tendonkeng et al. (21)], and Algeria [Mohammed et al. (22)].
In a review of literature, Stolen et al. (27) have concluded that with some exceptions, junior soccer players have lower VO2max (< 60 mL.kg-1.min-1) than seniors. Tønnessen et al. (16) observed no differences in VO2max across age groups, except that players younger than 18 years had higher VO2max than players who were 23 to 26 years old. Our study shows that VO2max is negatively correlated with player age, but the same conclusion cannot be drawn for VT1, VT2, and VO2rest.
Our analysis also illustrates that VO2max has negative correlation with weight. In the interpretation of these results note that expressing VO2max in units of mL.kg-1.min-1 results in overestimation of work capacity in light individuals, and underestimation in heavy individuals (14). Correlation between VT1, VT2, and VO2rest and weight groups is not significant, as confirmed by P-values of Table 3. The similarly negative correlations between VO2max and height are related to those of weights, as there is a high correlation between the weight and height of players with a correlation coefficient equal to 0.82.
The relationship between VO2max and team performance is highly debated in the literature. Some studies have argued that there is a high correlation between VO2max and performance. Examples include a study by Apor (11) regarding four teams in the Hungarian top soccer division and the study by Wisloeff et al. (19) with respect to the Norwegian elite division and the meta-analysis of Slimani et al. (28). Haugen et al. (29) indicate that VO2max is a distinguishing variable that separates female players of different standards. These studies suggest that VO2max may be useful in differentiating between teams, because better performing teams in a league possess higher VO2max (10). However, some studies have produced results contrary to this claim. For example, the study by Tønnessen et al. (16), which is based on a large number of subjects (1545 male soccer players), demonstrates that VO2max does not distinguish the different standards of play. Our study supports the latter conclusion that there is no statistically significant correlation between VO2max (and also VT1, VT2, and VO2rest) and team ranking at the end of the season. On a practical level, this indicates that professional soccer players only need to fulfil minimum requirements on cardiorespiratory fitness measures such as VO2max, and beyond that, cardiorespiratory fitness has insignificant contribution to overall team performance.
Our study shows that goalkeepers possess the lowest VO2max, with a mean value of 49.8 mL.kg-1.min-1. Defenders had the lowest VO2max mean value amongst outfield players (equal to 54.7 mL.kg-1.min-1), and midfielders had the highest mean VO2max (= 56.9 mL.kg-1.min-1). Previous studies mostly agree on two facts: (1) aerobic capacity varies with playing position (10); and (2) in average, goalkeepers have the lowest aerobic capacity amongst the four mentioned groups (28). Our study further approves these conclusions. Similar to our conclusion, some studies have found that midfielders have the best aerobic capacity in both male [e.g. Tønnessen et al. (16)] and female [e.g. Haugen et al. (29)] soccer players, while others have concluded that forwards have the highest VO2max [e.g. Gil et al. (17)]. The study of Metaxas (20) argues that there is significant correlation between VO2max and player position amongst outfield players, but the study is based on a relatively small group of players (N = 14). On average, midfield players run the longest distances compared to other players and cover more sprints due to their role in concerting attacking and defensive play. This notion is supported by several previous studies, including Davis et al. (18). The results of our study support the idea that there is a high correlation between physical demands of player positions during a game and their aerobic capacity as quantified by VO2max, and this must be taken into account in soccer training.
5.1. Conclusions
Our findings from an extensive dataset of 213 players show that there is no statistically significant correlation between VT1, VT2 or VO2rest values on one side and age, weight height, team ranking, or player position on the other. No correlation between VO2max and team ranking at the end of the season is observed, as there was no statistically significant difference between mean VO2max values of the 16 teams from the first to the last rank in the subsequent season. We observed statistically significant reduction in VO2max with increasing age, weight, height, and BMI. We also observed that VO2max varies with playing position in a statistically significant manner. Goalkeepers had the lowest average VO2max, followed by defenders, forwards, and midfielders. We demonstrated that there is a high correlation between the physical demands of player positions during a game and the cardiorespiratory fitness of players in those positions.
