


1. Background
The Fédération Internationale de Football (FIFA) has been organizing the Futsal World Cup for 31 years now. However, very few epidemiological studies have been published about injuries of futsal players (1-4). Regarding the number of sports injuries, futsal was among the top 10 sports in the Netherlands, and the authors report an incidence rate of 55.2 injuries per 10000 hours of participation in sports (95% CI: 42.7 to 71.3) (2). In 3 consecutive FIFA Futsal World Cups (2000, 2004, 2008), the incidence rate of injury was 195.6 per 1000 player hours (95% CI 165.8 to 225.6) (3); while it was substantially lower (91.5 injuries per 1000 player hours; 95% CI 72.2 to 110.8) during the 2010 FELDA/FAM National Futsal League in Malaysia (4). Angoorani et al. (1) reported that Iranian national futsal players had an average incidence of 2.22 injuries per 1000 hours during the season. A similar study was done by Ruiz-Pérez et al. (5) which showed that the incidence of injuries were overall 6.7, match 6.4, and training 6.8 injuries/1,000 h of exposure.
In order to develop effective prevention programs, the risk factors should be evidently recognized. The influence of physical fitness parameters is suggested to be associated with sports injuries (6, 7); however, this is still controversial. While many authors (8-17) have shown a correlation between these parameters, including aerobic fitness, flexibility, muscle strength, and reaction time, with sports injuries, others (18-21) have failed to find such a relationship. Although many studies have been done on football-related injuries (8, 14, 16, 17) due to the difference between futsal and football in many aspects, it is not rational to extend them to futsal. A unique feature of this study is using a treadmill stress test with gas analysis to determine the VO2max of the players. We also have assessed the association of futsal injuries with speed, agility, and power.
As mentioned by Watson et al. (22), most previous studies have used base-field measurements to estimate aerobic fitness, which is not as reliable as laboratory tests for aerobic capacity and might be the main reason for inconsistency among previous studies. In the only other laboratory-based study on football players prior to Watson et al. (22), no significant relationship was found between pre-season VO2max and in-season injury risk. In another recent study on female adolescent soccer players (23) in which they were tested by cycle ergometer to determine their VO2max, no significant difference in aerobic capacity was found between injured and uninjured players. Interestingly, this was in contrast to Watson et al.’s previous study on collegiate soccer players, which showed VO2max to be an independent risk factor for in-season injury (22), though Poisson regression models identified lower VO2max as a predictor of injury.
As far as we know, there have been no prior studies on elite futsal players investigating the relationship of in-season injuries with pre-season physical fitness and VO2max determined through a maximal stress test and gas analysis.
2. Objectives
The aim of this study was to investigate if level of physical fitness components and specially VO2max determined through gas analysis are related to injury incidence rate among elite futsal players in Iranian national teams.
3. Methods
3.1. Study Population
All 55 Iranian national futsal players, including 17 women, 15 men, and 15 players from U-23 men's team participated in this study from March 2011 to September 2012. These players had been accommodated in the national team camp while other futsal league teams weren’t available to be considered.
3.2. Ethics
The Ethics Committee of Iran University of Medical Sciences approved this study.
Prior to the start of the study, all players were aware of the study and signed the informed consent.
3.3. Physical Fitness Parameters
Player participation in the Pre-competition Medical Assessment (PCMA) was based on the FIFA protocol (24), and they reported their demographic data, including average time of training per week, the playing years in the futsal premier league, age, and previous injuries. Players performed the following physical fitness tests in order to assess their physical fitness level.
3.4. Cardio-Respiratory Fitness
Cardio-respiratory fitness was assessed on a treadmill using direct VO2max test via gas analysis (25). Using the Bruce protocol, the exercise workloads were gradually progressed from light to vigorous intensity (26). The calculation of oxygen uptake was done by measurements of ventilation, the amounts of O2 and CO2 in the expiration, and the greatest level was considered at the end of the test. When maximal VO2 plateau, maximal heart rate, and the respiratory exchange ratio of 1.15 (or greater) were reached (the indications of maximal VO2), the test results were valid, otherwise voluntary exhaustion happened. Values were expressed as ml of O2 per kg of body weight per minute (mL/kg/min).
3.5. Flexibility
Flexibility was assessed using the sit and reach test (25). The players sat in front of the flexometer (sit-and-reach box) at the 26-cm mark while they removed their shoes and the soles of the feet were flat. Inner edges of the soles were located within 2 cm relative to the measuring scale. The players were guided to put their hands as far as possible in the forward direction slowly and hold them for around 2 seconds. After 2 trials, the final point of fingertips in centimeters was considered as the score.
3.6. Body Composition
Bioelectrical Impedance Analysis (BIA) method was used to assess the body composition (25). The players were allowed to remove their socks, shoes, and all jewelry and metal devices before standing in front of a bio-impedance analyzer over the footplate. Then they were asked to grasp the handles and hold them until the analysis was finished. All the players were also asked to avoid eating or drinking during the test for around 4 hours, and avoid exercising for 12 hours of the test, avoid drinking alcohol and diuretic agents such as caffeine within 48 hours of the test, as well as urinate completely within 30 minutes of the test.
3.7. Agility
Agility was assessed using the Illinois Agility Test (27). The length and the width of the Illinois agility course were 10 and 5 meters respectively. The width showed the distance between the start and finish points. To mark the start point, 2 turning points, and the finish point, 4 cones were used. Also, in the center with equal distances, another 4 cones were applied while central cones were located at same distance (3.3 meters). After 10 minutes of aerobic warm up (mild to moderate intensity), the participants were placed at the starting cone in a prone position. By the 'Go' command and running the stopwatch, the players stood up, ran following the marked direction around the course, passing the cones to the finish point as quickly as possible. At the finish point, the stopwatch was stopped, and the time was recorded based on seconds and milliseconds. The better of 2 trials was recorded.
3.8. Speed
Speed was assessed using the 40 yard sprint test (28). The test included a standard warming up, then running from the starting line while the front foot was positioned behind the starting line and the runner was in this comfortable stationary position for 3 seconds, next a stopwatch measured the time between the beginning and finishing line (a 40-yards or 36.58-meters distance) when the chest crossed the finish line. The best result among three trials was recorded.
3.9. Power of the Lower Extremity
Power of the lower extremity was assessed using a vertical jump test (29). At first, a player reached his/her hand to the highest point on a wall while standing with his/her side near it. The feet had to be flat on the ground, and a physician marked the touch point of the middle fingertip on the wall. Then the player took one step away from the wall to jump as high as possible while keeping their hands upward and touching the wall at the highest possible point. Finally, the difference between two points was measured as the score of the test. To maximize the accuracy, the best of 3 attempts was recorded.
3.10. Muscle Strength of Lower Extremity
Muscle strength of the lower extremity was assessed using leg press test by a leg press machine (25). First the players were guided to sit in the machine. They had to grasp the handles while keeping their back straight, and their legs were parallel during the test. There was a foot plate which hold the bent legs at 60 - 90 range angles. Next, the players lifted a weight to extend their legs fully, hold them shortly and then relieve the weight slowly by lowering it. The weight was set to be the maximum ability of the player, and after each successful lift, there was a 5-minute rest and another leg press test with a 2 to 5 kg increase.
The greatest amount of weight lifted was considered the 1-RM (repetition maximum).
To produce a dimensionless parameter, the 1-RM was divided by player’s weight (in kg).
3.11. Injury Registration
For injury registration, the players in national team camps were followed during an 18-month period to record all the injuries as well as exposure times during matches and training sessions.
A special exposure report form was used to register the amount of time each player spent in match and training. The players’ injuries and complaints were recorded by the team physicians daily. Whenever an injury happened, the player’s condition was reevaluated by a sports medicine physician, and the characteristics of each injury was recorded on a standard form. The definition of injury and the procedure to record the injuries were compiled with the international consensus statement for the epidemiological studies of injuries in football (30). The definition of injury has been “any physical complaint sustained by a futsal player that results from a futsal match or training session, irrespective of the need for medical attention or time loss from futsal activities”. Also, any gradual-onset injury was recorded by specialists, even those not attributed to any known event.
3.12. Statistical Analyses
To indicate the incidence rate of injury the number of injuries per 1000 player-hours of exposure (sum of the training hours and match hours) was used. Data analysis was done using statistical software SPSS 16.0.0. and inter-team comparison was made with the ANOVA test. We used univariate logistic regression for comparing risk factors among injured and uninjured groups.
4. Results
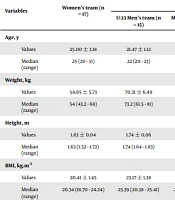
Baseline characteristics of the study participants (see Table 1) and details of injuries (see Table 2) have been published previously (1). During 18 months, 32 players sustained 54 injuries while training or playing futsal. The overall incidence was 2.22 injuries per 1000 player hours.
| Variables | Women's Team (n = 17) | Men's Teams | Total (n = 55) a | P b | ||
|---|---|---|---|---|---|---|
| U-23 Men's Team (n = 15) | Men's Team (n = 23) | Total (n = 38) | ||||
| Age, y | 0.68 | |||||
| Men ± SD | 25.00 ± 3.18 | 21.47 ± 1.12 | 26.61 ± 3.71 | 24.58 ± 3.89 | 24.71 ± 3.66 | |
| Median (range) | 25 (20 - 31) | 22 (20 - 23) | 25 (22 - 36) | 24 (20 - 36) | 24 (20 - 36) | |
| Weight, kg | < 0.0001 | |||||
| Men ± SD | 54.65 ± 5.73 | 70.31 ± 6.49 | 75.13 ± 6.87 | 73.18 ± 7.04 | 67.34 ± 10.91 | |
| Median (range) | 54 (43.2 - 68) | 73.2 (61.5 - 81) | 74.6 (62.4 - 94.8) | 74.2 (61.5 - 94.8) | 69.1 (43.2 - 94.8) | |
| Height, m | < 0.0001 | |||||
| Men ± SD | 1.63 ± 0.04 | 1.74 ± 0.06 | 1.76 ± 0.05 | 1.75 ± 0.05 | 1.72 ± 0.07 | |
| Median (range) | 1.63 (1.52 - 1.72) | 1.74 (1.64 - 1.83) | 1.76 (1.65 - 1.86) | 1.76 (1.64 - 1.86) | 1.72 (1.52 - 1.86) | |
| BMI, kg.m-2 | < 0.0001 | |||||
| Men ± SD | 20.41 ± 1.45 | 23.17 ± 1.38 | 24.26 ± 1.52 | 23.82 ± 1.54 | 22.75 ± 2.20 | |
| Median (range) | 20.34 (18.70 - 24.24) | 23.39 (20.38 - 25.41) | 24.19 (21.74 - 27.70) | 23.74 (20.38 - 27.70) | 23.01 (18.7 - 27.7) | |
| Fat, % | < 0.0001 | |||||
| Men ± SD | 21.20 ± 3.53 | 10.89 ± 1.84 | 14.38 ± 3.10 | 13.00 ± 3.16 | 15.54 ± 5.02 | |
| Median (range) | 20.1 (15.7 - 27.8) | 11 (8.2 - 14.5) | 13.6 (8.4 - 20.1) | 12.9 (8.2 - 20.1) | 15.30 (8.2 - 27.8) | |
Baseline Characteristics of Players
| Variables | Women’s Team | Men’s Teams | Total Injuries | P c | |||||||
|---|---|---|---|---|---|---|---|---|---|---|---|
| U-23 Men’s Team | Men’s Team | Total a | |||||||||
| n | IR b | n | IR | n | IR | n | IR | No. (%) | IR | ||
| Number of injuries d | 28 | 4.17 | 8 | 0.90 | 18 | 2.07 | 26 | 1.48 | 54 | 2.22 | 0.001 e |
| Location of injury | |||||||||||
| Head and trunk | 3 | 0.45 | 1 | 0.11 | 1 | 0.12 | 2 | 0.11 | 5 (9.26) | 0.21 | 0.22 |
| Upper extremity | 2 | 0.30 | 0 | 0 | 1 | 0.12 | 1 | 0.06 | 3 (5.56) | 0.12 | 0.27 |
| Lower extremity | 23 | 3.43 | 7 | 0.78 | 16 | 1.84 | 23 | 1.31 | 46 (85.19) | 1.89 | 0.01 e |
| Groin | 4 | 0.60 | 1 | 0.11 | 2 | 0.23 | 3 | 0.17 | 7 (12.96) | 0.29 | 0.18 |
| Thigh | 0 | 0 | 2 | 0.22 | 1 | 0.12 | 3 | 0.17 | 3 (5.56) | 0.12 | 0.08 |
| Knee | 5 | 0.74 | 1 | 0.11 | 6 | 0.69 | 7 | 0.40 | 12 (22.22) | 0.49 | 0.34 |
| Lower leg | 1 | 0.15 | 0 | 0 | 0 | 0 | 0 | 0 | 1 (1.85) | 0.04 | 0.32 |
| Achilles tendon | 1 | 0.15 | 0 | 0 | 0 | 0 | 0 | 0 | 1 (1.85) | 0.04 | 0.32 |
| Ankle f | 12 | 1.79 | 3 | 0.34 | 7 | 0.81 | 10 | 0.57 | 22 (40.74) | 0.9 | 0.03 e |
| Time of injury | |||||||||||
| In training hours | 18 | 3.11 | 3 | 0.37 | 13 | 1.79 | 16 | 1.04 | 34 (62.96) | 1.61 | 0.01 e |
| In match hours | 10 | 10.75 | 5 | 6.10 | 5 | 3.48 | 10 | 4.43 | 20 (37.04) | 6.27 | 0.09 |
Comparison of Injuries Among Iranian National Futsal Teams
4.1. Physical Fitness and Incidence of Injury
Players injured during the season had a poorer performance at baseline in agility, speed, and vertical jump than uninjured players (Table 3). Lower maximal oxygen uptake (VO2max) values were associated with a higher injury risk (Table 3). With every 1-unit increase in VO2max value, the odds of occurring injuries decreased by 14 percent (P = 0.002).
| Variables | Uninjured Group (n = 23) | Injured Group (n = 32) | Total (n = 55) | OR | 95% CI for OR | P | |
|---|---|---|---|---|---|---|---|
| Lower | Upper | ||||||
| Age | 24.17 ± 3.94 | 25.09 ± 3.47 | 24.71 ± 3.67 | 1.08 | 0.92 | 1.26 | 0.36 |
| Height, cm | 171.72 ± 5.69 | 171.52 ± 8.51 | 171.60 ± 7.40 | 1.00 | 0.93 | 1.07 | 0.92 |
| Weight, kg | 68.41 ± 9.28 | 66.55 ± 12.07 | 67.34 ± 10.91 | 0.98 | 0.94 | 1.04 | 0.53 |
| BMI | 23.10 ± 2.08 | 22.48 ± 2.27 | 22.75 ± 2.20 | 0.88 | 0.68 | 1.13 | 0.30 |
| Body fat mass, % | 14.32 ± 3.76 | 16.42 ± 5.65 | 15.54 ± 5.02 | 1.09 | 0.97 | 1.23 | 0.13 |
| VO2max, (mL.kg-1.min-1) | 54.22 ± 6.56 | 47.27 ± 7.10 | 50.17 ± 7.64 | 0.86 | 0.78 | 0.95 | 0.002 a |
| Agility, s | 17.42 ± 0.80 | 18.20 ± 1.14 | 17.88 ± 1.07 | 2.28 | 1.19 | 4.34 | 0.01 a |
| Speed, s | 5.04 ± 0.36 | 5.36 ± 0.55 | 5.23 ± 0.50 | 4.28 | 1.19 | 15.36 | 0.03 a |
| Vertical jump, cm | 55.04 ± 9.57 | 46.25 ± 9.84 | 49.93 ± 10.59 | 0.91 | 0.86 | 0.97 | 0.004 a |
| Lower ext. strength | 2.64 ± 0.51 | 2.61 ± 0.44 | 2.62 ± 0.47 | 0.89 | 0.28 | 2.56 | 0.84 |
| Flexibility, cm | 32.30 ± 6.49 | 31.16 ± 8.31 | 31.64 ± 7.56 | 0.98 | 0.91 | 1.05 | 0.58 |
| Exposure hours | 476.22 ± 108.10 | 417.91 ± 104.88 | 442.29 ± 109.17 | 1.00 | 0.99 | 1.00 | 0.06 |
| Training/match ratio | 6.59 ± 2.45 | 7.31 ± 2.44 | 7.00 ± 2.44 | 1.14 | 0.90 | 1.43 | 0.28 |
Results of Univariate Logistic Regression Analyses for Comparison Between the Injured and Uninjured Groups of Futsal Players with Potential Risk Factors as Continuous Variables
5. Discussion
Although the correlation between physical fitness factors and sports injuries in different kinds of sports, especially football, has been the subject of many previous surveys (8-20), there are very few studies which have evaluated the effect of physical fitness factors on sports-related injuries in high level futsal players. Among all physical fitness factors, the majority of studies (5, 8-19) have aimed the effect of aerobic fitness, flexibility, and muscle strength on sports-related injuries. In this study, we also evaluated the effect of body composition, speed, agility, and power in addition to the mentioned factors on sports-related injuries.
5.1. Aerobic Cardio-Respiratory Fitness
The correlation between cardio-respiratory fitness and sports injuries has been the matter of many studies on athletes & military service recruits (8, 10-12, 14, 31) with conflicting results.
The vast majority of previous studies have used indirect measurements for estimation of aerobic capacity, such as Cooper's test (12-minute run) in military conscripts (32) or 6-minute run in elite Australian football players (33). Other reported methods include continuous multistage fitness test (34), which is a 20-m repeated shuttle run test and 2-mile run times in military studies (35).
In a study by Chalmers et al. (34) lower aerobic capacity (as determined by a 20-m repeated shuttle run test to estimate VO2max) was related to higher risk of shin, ankle & foot injuries in elite junior Australian football players, which was attributed to their greater levels of fatigue during competitions.
Based on our study, lower VO2max values which were measured by direct cardiopulmonary exercise test on a treadmill (using the Bruce protocol), were associated with more injury incidences. This is in accordance with many previous surveys in athletes and army trainees (8, 10-12). This is also in agreement with a more recent study by Watson et al. (22), who reported significantly lower VO2max values in male collegiate soccer players with in-season injuries in whom pre-season aerobic capacity was determined by a maximal treadmill test using a modified Bruce protocol. Interestingly, a more recent study on female adolescent soccer players (23) failed to show a significant difference in VO2max (determined via a maximal ergometer stress test) of injured athletes (P = 0.13). Though subsequent Poisson regression models showed VO2max to be a significant predictor of in-season injury (OR = 0.95, P = 0.046). The authors reported a 5% decrease of injury risk with every 1 cc/kg/min increase in pre-season aerobic capacity. This finding is nearly in agreement with our findings.
Also, in a more recent study, Lisman et al. (31) showed that slow three-mile run time was associated with increased injury risk in military personnel, and Poplin et al. (36) reported that fire service employees with VO2max less than 43 mL/kg/minute are 2.2 times more prone to sustaining injury in comparison with those who have VO2max higher than 48 mL/kg/minute, though VO2max in their study was estimated indirectly using a submaximal incremental protocol (not via gas analysis, as done in the present study, which is more accurate and less prone to confounding factors). Moreover according to Poplin’s study (36) the improvement of relative aerobic capacity by one metabolic equivalent of task (around 3.5 mL/kg/minute) decreases the injury possibility by 14%, which is exactly similar to the result of our findings.
On the other hand, since there was a variety of methods to describe aerobic fitness, some studies (18, 19, 37) failed to find the correlation between aerobic fitness and sports injuries. These studies have used indirect estimations of aerobic capacity, which is not as accurate as laboratory-based measurements and might be confounded by the aerobic components of the tests as clarified by Watson et al. (22), or biomechanical abnormalities or personal traits (35). This methodological difference and the variable study populations may explain the paradoxical findings on fitness levels. We also believe there might be sport-specific or activity-specific differences in exercise type or its intensity used to achieve higher levels of aerobic capacity as a potential risk factor of injury. Though this assumption needs to be tested in future sport-specific studies.
There is also conflicting evidence from epidemiological studies (35) that higher cardiorespiratory fitness is associated with higher risk of activity-related injury. The authors attributed their finding to their different population study which included individuals from a wide range of ages (20 - 85 years old), the possibility of chronic or previous injuries, and the neglected possible confounding role for exercise intensity comparing different studies on physical fitness level, as well as biomechanical abnormalities or personal traits. A similar finding was reported by Clark et al. (38), who noted a positive association between higher aerobic fitness in children (measured via 20-meter shuttle run test) and the rate of fractures, especially in those with lower grip strength. This might be due to higher amounts of times spent on vigorous physical activity per week in those children who were more physically fit. The authors also proposed the possible role for lower muscle strength and lower shock absorption, which may increase the risk of fracture with greater levels of physical activity in children.
5.2. Agility and Speed
The present study showed that less agility and speed as well as less vertical jump height (as the index of lower extremity power) were associated with higher incidence rate of sports injuries among futsal players. These findings are somehow similar to the results of previous surveys (39, 40). However, the majority of these studies were done in female players and have merely assessed the effect of improvement of these physical fitness factors on prevention of anterior cruciate ligament (ACL) injury (5). A study by Chalmers et al. (34) showed a faster pre-season 5-m sprint may increase the severity of injuries in elite junior Australian football players, especially the hip, groin & thigh injuries, and more specifically, quadriceps strain. The authors postulated that faster players suffer greater impact forces which may increase the risk of contact injuries. They also reported higher risk of non-contact injuries in faster players. This is in contrast to the present study, which showed less speed was associated with higher injury risk in futsal players. Such findings could be of value in designing sport-specific prevention programs, of which we were unaware prior to conducting a prospective study like this.
5.3. Flexibility
No definite statements can be made about the effect of flexibility on sports-related injuries. We did not find any relationship between flexibility (assessed by sit and reach test) and sports injuries in this study. This finding is in accordance with the study of Arnason et al. (20) where they observed the same flexibility both in those with muscle strains and those without strains. Also, in a recent systematic review (41), inconsistent findings were found for hamstring length or flexibility as a risk factor for hamstring injuries. However, many previous reports (10, 13, 40) indicated the correlation between flexibility and sports- related injuries. But these studies have used different methods to describe and assess flexibility and have been done in different populations.
5.4. Muscle Strength of Lower Extremity
Muscle strength might be a potential risk factor for sports injuries. In the present study, we applied the leg press test for the assessment of lower extremity strength. However, we failed to find any correlation between lower extremity strength and the incidence of injuries in futsal. This result is similar to findings of 3 previous studies by Milgrom et al. (18), which had tried to investigate the association of lateral ankle sprains in military recruits with isometric quadriceps strength at 85 degrees of knee flexion (though the ankle strength was not tested, and the quadriceps was the only muscle tested in this study for strength); Ostenberg and Roos (19) which measured the strength of knee flexors and extensors by an isokinetic device at 2 velocities (60 & 80 degrees per second) in European female soccer players; and Beynnon et al. (21) which found no relationship between ankle sprains and isokinetic strength of ankle plantar/dorsi-flexors and ankle invertors/evertors (measured at a velocity of 30 degrees per second) in a population of young college athletes competing in different sports (soccer, lacrosse, field hockey). The latter study also investigated the muscle imbalances of the ankle but found no significant relationship between either dorsi-flexor/plantar-flexor or evertor/invertor strength ratios or subsequent injury. On the other hand, very few studies (17) have reported an association between decreased muscle strength and sports- related injuries.
With regard to muscle strength, most studies (15, 16) have assessed the effect of muscular imbalance instead of pure muscle strength on the incidence of sports injuries. In their study on college athletes, Baumhauer et al. (15) reported a higher evertor/invertor strength ratio (assessed by an isokinetic dynamometer before the season) in athletes with inversion ankle sprains. But the reported absolute values for isokinetic muscle strengths of ankle were not different in the injured group, though within-subject analysis revealed lower plantar-flexion strength of the injured ankle compared to the uninjured ankle. In another study on female soccer players, Soderman et al. (16) showed lower concentric hamstring-to-quadriceps isokinetic ratio to increase the risk of traumatic leg injuries.
5.5. Body Composition
In the present study, body mass index (BMI) and body fat percentage were not related to the incidence of injuries in futsal. This finding is in accordance with many previous studies (10, 15, 19, 21, 41). Conversely, low or high values of BMI besides the high value of body fat percentage reported by Jones et al. (12) were possible risk factors which sustained lower extremity injury among male military recruits. Grant et al. (37) showed BMI > 25 kg/m2 to be predictive of on-ice injury among male collegiate hockey players, which is in contrast to our study. The body fat percentage was not reported in their study (though they have used a bio impedance analyzer to determine body composition). On the other hand, a study on elite Australian football players by Henderson et al. (33) has shown a higher incidence of in-season injury and also increased severity of injuries with lower body mass (or bodyweight), but they did not report body composition in their study. Taanila et al. (32) reported a U-shaped relationship between body composition and overuse injuries in young Finnish conscripts. Also, Jespersen et al. (42) reported that children with higher body fat percentage are more prone to sustain lower extremity injuries.
We did not assess lean body mass in our study, but there exists some recent evidence (22) of its relationship with “early”-season (defined as the first 4 weeks of season) injuries in collegiate soccer players. This study found no relationship between either pre-season body fat percent or lean body mass with in-season injuries, which is in accordance with our study. The body fat percentage in the study by Watson et al. (22) was determined via the DXA method, which is generally considered to be more accurate than the BIA method used in our study.
Since different populations, as well as different methods, have been used to assess the total body fat percentage, it is very difficult to compare the findings of these surveys with the results of our study. It seems that there might be a sport-specific relationship between body composition and injury risk as, for example, higher body mass may protect against Australian football injuries, which are mostly of contact-type injuries (33), while higher BMI (as an indicator of lower physical fitness as proposed by Grant et al. may increase in-season injury in hockey players (37). This sport-specific hypothesis needs more prospective studies to be tested.
5.6. Gender and Injury
By comparing the frequency and type of injuries in men and women, according to the results published in the previous article (1) and Table 2, it is clear that among the players of the Iranian national futsal team, women were injured more and commonly in their ankle. Also, their injuries were caused by non-contact trauma, while men's injuries resulted from contact trauma (1, 5). The reasons for these differences are attributed to the lower physical fitness factors in women, which is in accordance with the study done by Ruiz-Pérez (5). Due to anatomical, hormonal, and neuromuscular reasons, this weakness could be more severe in women in comparison to men and results in the difference between the two groups. Due to the nature of futsal, which needs multiple sprints and large changes in direction, weakness in physical factors such as speed and agility had led to more injuries to the lower limbs, including the ankles. Hamid's study showed that ankle and knee injuries were among the most common injuries caused by futsal (4). In the Martinez-Riaza study, hamstring injury was also identified as a common injury in male futsal players (43). In our study, men suffered more thigh injuries than women, but in general, ankle injuries were more common, especially in women, due to lower physical fitness factors such as speed, agility, and strength (see Table 3).
5.7. Conclusion
There are still controversies among various studies about the association of physical fitness parameters with sports injuries. These controversies might be due to the methodological differences or indicate a sport-specific relationship between physical fitness and sports injuries. The findings of the present study show that aerobic fitness, speed, agility, and power are associated with the risk of injuries in futsal players. Finally, to develop injury-prevention programs, further studies are required to determine the risk factors for injuries in futsal.
