


1. Background
Today, adolescents and youth form a significant part of every community, particularly sports society. To have the best function in international sports events, we must pay attention to young athletes because they will form adult athletes in the future. Sports nutrition has always been one of the essential areas of researchers' attention. Research on nutritional methods, the type of diet an athlete chooses, and its relationship with sports performance is significant.
Nutrition plays a pivotal role in growth (1). Furthermore, sports nutrition has been defined as using food strategies to improve health and adapt to sports activity to return to the initial state quickly after each sports training session and optimal performance during competitions (2).
That said, student-athletes often have little time to meet their nutritional needs due to attending school, which may make them choose the most convenient and available food for their main meal (3). In 2009, the American Dietetic Association reported that success and improvement in athletic performance are achieved through proper nutrition (4). The importance of proper nutrition has been emphasized as one of the critical aspects of lifestyle; however, wrong food choices or adherence to an unhealthy diet adversely affect athletic performance and ability (5-7). Also, nutrition is one of the most important determinants of health, fitness, and sports performance in athletes, so that a positive correlation has also been observed between nutritional knowledge and nutritional quality in young Australian athletes (8). Heydenreich et al. showed that both nutrition knowledge and food choice are insufficient in young athletes in Germany (9). In another study, Kudret Saribay and Kirbaş observed that the majority of the participants had poor nutritional knowledge, while income status and school type have been reported to affect the level of knowledge in Turkey (10). Patton-Lopez et al. also stated that after implementing nutrition education for adolescent soccer players, their nutrition knowledge scores increased, thereby resulting in healthier nutrition (11).
In Iran, limited research has been focused on adolescent sports nutrition, and the studies on nutrition have not reported satisfactory results. For instance, Delvarian-Zadeh et al. stated that female adolescents have moderate nutritional knowledge and diet, and given that their nutritional practice is not in line with their attitude, continuous nutritional interventions are critical in adolescents (12). In another study performed on adolescents in Bandar Abbas (Iran), Pormehr Yabandeh et al. reported the improvement of nutritional status following nutrition education programs and interventions in high school students (13). In a research on the nutritional status of male adolescents in Arak (Iran), the consumption of fruits, vegetables, and dairy products was reported to be below the average food pyramid, and the emphasis was placed on the motivation of adolescents for healthy nutrition and lifestyle (14). In Iran, no complete and comprehensive studies have measured the sports nutrition knowledge, attitude, and practice of athletes in adolescence, and the data in this regard are insufficient. Considering that Tehran is home to different ethnicities from all over Iran and is the most populous city in Iran, it is a good representative for investigation in the present research.
2. Objectives
The present study aimed to assess the level of sports nutrition knowledge, attitude, and practice of student athletes in Tehran, Iran.
3. Methods
3.1. Participants
The sample population included students aged 15 - 18 years who were selected from the male and female high school students in Tehran. The subjects were regularly active in specific sports, were a member of a sports team at their school, or had a history of sports activities but recently and temporarily discontinued their activities due to personal issues, lack of time, and preparation for the national entrance exam.
For sampling, schools were initially selected from three urban areas of Tehran (north, downtown, south, and east) and all types of governmental schools, non-profit schools, and physical education conservatories. Due to the need for student athletes (beginners/elites), we only selected the regions that had the most attendance or the highest sports status in national and provincial competitions or within Tehran. First, sports coaches and teachers in each school were asked to invite some student-athletes from both beginner and professional groups to participate in the research. The data was collected during ten days under test conditions. Participants were asked not to talk to each other while completing the questionnaire and answered each item accurately.
3.2. Questionnaire
Data were collected using the Persian version of the sports nutrition knowledge questionnaire by Walsh et al., which was designed to assess the knowledge, attitude, and behaviors of students regarding sports nutrition in Ireland (15). The validity and reliability of the questionnaire in Iranian adolescent athletes have been confirmed, with the reliability score estimated at 0.74 (16). The questionnaire consists of five sections; the first section contains three items on sports and the weekly hours of training, which should be completed with short answers. The second section evaluates eating and drinking habits with ten items, including five five-choice items and one two-choice item (yes/no), with the remaining items focused on the time of food consumption in regard to physical activity. The third section of the questionnaire assesses the attitude toward sports nutrition with five items. The fourth section measures the knowledge of sports nutrition with 13 items, all of which are scored based on a three-point Likert scale. The fifth section contains eight items, which determine the nutrition information sources of adolescent athletes and their intention to improve their nutrition knowledge and attitude in the future.
3.3. Measurements
The questionnaires were distributed among 174 athletes. Initially, the sports coaches and teachers of the students were asked to invite some of their athlete students to participate in the research. Data collection was performed for ten days. Participants were seated at separate desks in a classroom and requested not to talk to each other while completing the questionnaire so that they could concentrate on the most accurate responses.
To avoid waste of time and upon the request of the sports coaches and school principals, the students were asked to spend the last 15 minutes of a physical education class completing the questionnaires without any disturbance to their school assignments. In addition, the researcher was available to the students throughout the test to address their questions or any ambiguities. At the next stage, the questionnaires were reviewed by the researcher to ensure responsiveness. As an appreciation, each student was given a chocolate, a pixel or a playing card.
3.4. Statistical Analysis
To summarize and present the baseline data, we used descriptive statistics (percentage, minimum, maximum, mean, and standard deviation). Data were tested for normal distribution with the Kolmogorov-Smirnov test. Due to the non-normal distribution of data, non-parametric tests were used for the group comparisons (Mann-Whitney U and Kruskal-Wallis test). For relationship assessment, we used Pearson's correlation coefficient. Data analysis was performed in SPSS version 24.
4. Results
In total, 48.8% of the participants were female, and 51.14% were male. The distribution of participants from different districts is presented in Table 1. Also, as shown in Table 2, most participants were active in soccer and futsal (due to the large variety of participants in different sports in this study, sports with less than 10 participants were included in the "others" category).
Table 1.Distribution of Participants from Different Districts
| Female | Male | Total | % | |
|---|---|---|---|---|
| District 1 of Tehran | 0 | 10 | 10 | 5.74 |
| District 4 of Tehran | 0 | 19 | 19 | 10.91 |
| District 7 of Tehran | 57 | 42 | 99 | 56.89 |
| District 11 of Tehran | 28 | 18 | 46 | 26.43 |
| Total | 85 | 89 | 174 | 100 |
Table 2.Number of Students in Different Sports Fields
| Sports | Number |
|---|---|
| Football and futsal | 54 |
| Volleyball | 29 |
| Basketball | 15 |
| Martial arts | 17 |
| Swimming | 10 |
| Others | 36 |
| No answer | 13 |
| Total | 174 |
The highest score was calculated at 73 out of 98, as achieved by a skilled female athlete in track and field, while the lowest score was 21 out of 98, as achieved by a novice male athlete.
The mean total score obtained by the female and male athletes was 55 and 57, respectively. However, no significant differences were observed in the level of knowledge and attitude toward sports nutrition between the male and female students. The feeding score of the male students was significantly higher compared to the females (correlation coefficient = -0.19), which indicated that despite having the same level of knowledge and attitude, the boys had better food choices compared to the girls.
In Figure 1, the scores of athletes in different sports have been shown; the highest score that participants could get was 98, and the lowest score was 0. The comparison of the obtained scores in different sports indicated no significant difference in the level of sports nutrition knowledge and the sports field of the students (P = 0.12), while a significant difference was observed between the attitude (P = 0.01) and practice (P = 0.006) in various sports. Accordingly, martial arts athletes (mean score: 61.76) had the highest, while swimmers (mean score: 53.7) had the lowest level of sports nutrition knowledge, attitude, and practice.
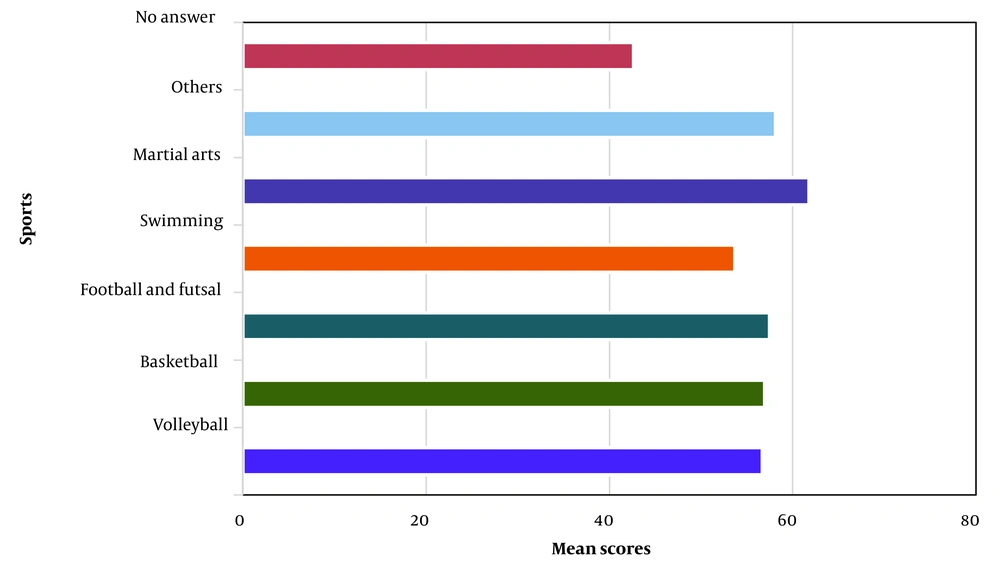
Figure 1.
Average scores of athletes in different disciplines
Our findings indicated no significant correlations between age and sports nutrition knowledge, attitude, and practices. As Table 3 demonstrates, a significant difference was observed between the athletes in terms of body mass index (BMI). Our calculations showed that the level of sports nutrition knowledge was inversely correlated with the BMI (P = 0.00). Regardless, no significant correlations were denoted between attitude (P = 0.23) and practice (P = 0.38) with BMI.
Table 3.Correlations Between BMI, Sports Nutrition Knowledge, Attitude, and Practices
| BMI | Practices | Attitude | Knowledge | Total Score | |
|---|---|---|---|---|---|
| BMI | |||||
| Pearson's correlation coefficient | 1 | -0.067 | -0.092 | -0.282 a | -0.234 a |
| Sig. (two-tailed) | 0.387 | 0.231 | 0.000 | 0.002 | |
| N | 170 | 170 | 170 | 170 | 170 |
| Practices | |||||
| Pearson's correlation coefficient | -0.067 | 1 | 0.093 | 0.246 a | 0.623 a |
| Sig. (two-tailed) | 0.387 | 0.224 | 0.001 | 0.000 | |
| N | 170 | 174 | 174 | 174 | 174 |
| Attitude | |||||
| Pearson's correlation coefficient | -0.092 | 0.093 | 1 | 0.224 a | 0.599 a |
| Sig. (two-tailed) | 0.231 | 0.224 | 0.003 | 0.000 | |
| N | 170 | 174 | 174 | 174 | 174 |
| Knowledge | |||||
| Pearson's correlation coefficient | -0.282 a | 0.246 a | 0.224 a | 1 | 0.796 a |
| Sig. (two-tailed) | 0.000 | 0.001 | 0.003 | 0.000 | |
| N | 170 | 174 | 174 | 174 | 174 |
a Correlations significant at a significance level of 0.01 (two-tailed).
In the present study, 75.3% of the participants had breakfast every day, 6.9% had breakfast 4 - 6 days a week, 8.6% had breakfast 2 - 3 days a week, 6.9% had breakfast only one day a week, and 2.3% of the participants never had breakfast. In addition, 36.8% of the students had a packed lunch from home at school, 59.2% went home for lunch, 3.4% had lunch provided by the school, and 0.6% bought lunch outside the school. Among the subjects, 90.2% had dinner at home, 7.5% did not have any dinner, and 1.7% chose other options for dinner, while none of the subjects ate out for dinner. Moreover, 89.1% of the subjects had snacks between the main meals, and only 10.9% had no snacks.
Item nine in the questionnaire determined the drink consumed before, after, and during exercise, and the responses indicated that only 52.76% of the athlete students drank appropriate fluids before, after, and during exercise. Moreover, 62% of adolescent athletes had their last pre-workout meal, and 51.14% had their first post-workout meal at the right time. The assessment of the obtained results from item 12 of the questionnaire, which was regarding the foods consumed before and after exercise, indicated that only 42.52% of the adolescent athletes chose appropriate meals to consume before and after exercise. Accordingly, cereals were the meal of choice for a larger number of the subjects (inappropriate choice), while the most correct choice in terms of protein (red meat, fish, and chicken) was also reported by the students. Figures 2 and 3 depict the consumption of various beverages and the selection of post-exercise and pre-exercise meals.
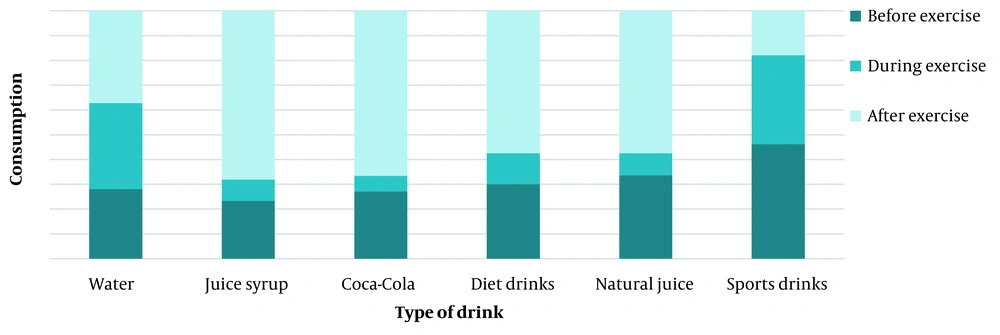
Figure 2.
Drink consumption
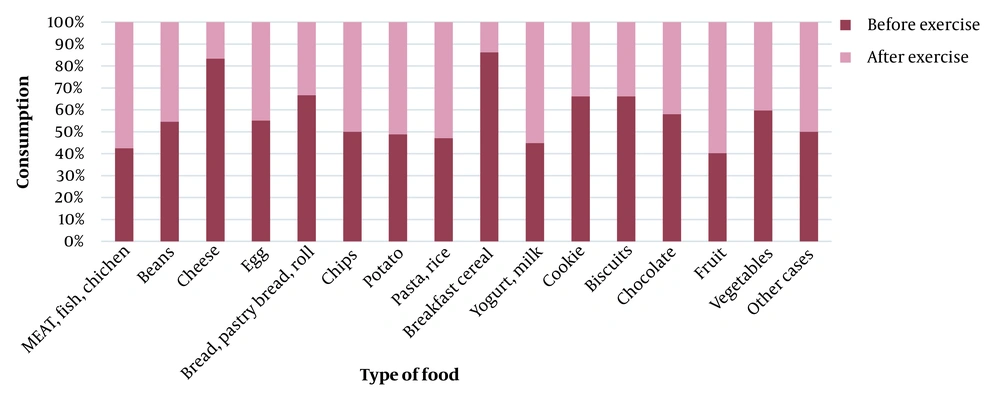
Figure 3.
Food intake selection before or after exercise
According to our findings, the foods and drinks consumed before formal competitions by the adolescent athletes was more important than their consumed meals before a training session. Only 43% of the students considered sports nutrition before a training session to be essential, while 62% considered sports nutrition before a formal competition to be essential. On the other hand, only 27.5% of the adolescent athletes were aware of the exact time of the first meal after a workout, while 51.14% stated that they consumed the first post-workout meal at the right time. In other words, 23.64% of the subjects unknowingly had their post-workout food at the right time, while 53.5% were fully aware of the proper pre-workout and post-workout meals. However, 23.52% had false knowledge in this regard, and 22.98% were not aware of the most proper meals that should be consumed before and after training.
The obtained results also indicated that 41.66% of the subjects were aware of carbohydrates and their role in sports diets, 70.85% were aware of hydration and sports drinks despite their improper drinking habits, and 52.62% of the adolescent athletes had sufficient knowledge of supplements and minerals. Finally, 16.85% of the students had adequate knowledge of proteins and their required dietary amount, as well as their effects on athletic performance. In this regard, the other subjects had inaccurate or partial information.
According to our findings, 70.8% and 69.4% of the male and female students sought nutritional recommendations for exercise, respectively. Furthermore, 41.4% and 55.4% of the female and male students primarily received their nutritional information from their coaches or trainers (48.2% total), as well as nutrition consultants, nutritionists, and sports medicine specialists (Table 4).
Table 4.Nutritional Information Sources of Students a
| Information Sources | Books and Magazines | Internet | Sports Organizations | Friends/Teammates | Family /Parents | Coach/Trainer | Other |
|---|---|---|---|---|---|---|---|
| Total | 16 (8.4) | 60 (31.4) | 28 (14.7) | 21 (11) | 21 (11) | 92 (48.2) | 8 (4.2) |
| Male | 5 (5.4) | 31 (33.7) | 18 (19.6) | 12 (13) | 8 (8.7) | 51 (55.4) | 2 (2.2) |
| Female | 11 (11.1) | 29 (29.3) | 10 (10.1) | 9 (9.1) | 13 (13.1) | 41 (41.4) | 6 (6.1) |
a Values are expressed as No. (%).
Among the participants who responded to items 32 - 39 (71.2% total), 62.6% found the received advice helpful, while 6.9% considered the advice useless, and 30.9% did not respond to this question. In addition, 22.4% of the participants preferred to receive recommendations for weight loss, and the female students were more inclined to lose weight compared to the males. On the other hand, male students were more likely to receive general health advice.
According to the information in Table 5, the athlete students were more likely to receive their sports nutrition information from coaches, followed by the Internet, information sheets, and informative conversations.
Table 5.Nutritional Information Sources Preferred in Future a
| Sources | Information Sheets | Websites/Links | Informative Conversations | School Magazine | Group Discussions | Coaches | Other |
|---|---|---|---|---|---|---|---|
| Total | 15 (15.2) | 15 (15.2) | 12 (12.1) | 3 (3) | 10 (10.1) | 41 (41.4) | 2 (2) |
| Male | 12 (13) | 24 (26.1) | 12 (13) | 7 (7.6) | 12 (13) | 46 (50) | 1 (1.1) |
| Female | 27 (14.4) | 39 (21.3) | 24 (13.8) | 10 (5.7) | 22 (12.6) | 87 (42.5) | 3 (1.7) |
a Values are expressed as No. (%).
5. Discussion
This research focused on the assessment of the level of sports nutrition knowledge, attitude, and practice of adolescent athletes, by a questionnaire shortly named "SNKABQ." The validity and reliability of SNKABQ have been investigated in a separate study (16).
The findings of the current research demonstrated a negative correlation between BMI and nutrition knowledge, confirming that young athletes with a lower knowledge in this regard have a higher BMI. Although these values did not reach significant levels in terms of attitude and practice, our findings may indicate the relationship between nutritional knowledge and body composition. Notably, a difference was observed in the sports nutritional practice despite the same knowledge and attitude in different areas of the city, which may be attributed to the lower income of the students' families in the less privileged areas compared to higher-income regions as the former may not have a wide choice of meals although they may be aware of the health benefits of the proper nutrition of athletes.
Our findings demonstrated a difference in the choice of food between the male and female students despite the same amount of knowledge and attitude. Although more females than males sought nutritional advice for their exercise, they had more inappropriate sports nutrition behaviors compared to males. Considering that more female than male students sought weight loss advice, the main reason for which was the social burden imposed on girls demanding thinness for being more attractive, the female students had more proper and principled nutrition to stay thin. On the other hand, the difference between the male and female students in this regard may be due to the more attention of parents to their sons. Further sociological research is required to substantiate such claims.
In the present study, 131 out of 174 participants had breakfast every day, which is a promising statistic since breakfast is an important meal (especially for athletes) and helps improve athletic performance and overall health. In addition, 157 subjects had homemade meals for dinner, which may indicate that families and parents have more control over the food choices of adolescent athletes. However, the participants in the current research had inadequate information about the consumption and appropriate time of consuming macronutrients and micronutrients and were also unaware of the key role of carbohydrates and proteins in athletic performance. Only in terms of hydration, the knowledge of the students was considered appropriate.
Although the athlete students in the present study were well acquainted with the use of supplements, they practically used no appropriate supplements and had a negative view of sports drinks (used rarely). Despite the significant difference between the level of sports nutrition knowledge, attitude, and practices of the athlete students in different sports, the martial arts practitioners scored higher in this regard.
In the studies conducted by Wallinga (17) and Torres et al. (18), adolescent athletes were reported to have the highest confidence and desire to obtain sports nutrition information from their coaches and were more influenced by these individuals than other sources of information. Therefore, the knowledge and attitude of coaches and trainers toward sports nutrition should be constantly updated. In Iran, information is lacking to address the question of whether the nutritional knowledge of sports coaches is sufficient and correct. If their knowledge is insufficient or incomplete, detrimental effects are expected on the sports nutrition behavior of adolescent athletes due to the desire and trust of these athletes to seek sports nutrition information from coaches.
In addition to coaches, the Internet and cyberspace accounted for the largest percentage of nutritional information by adolescent athletes in the present study. As such, suitable and approved websites or cyberspace should be provided to adolescents, and they should be introduced to these sources to obtain information. Considering that the mean score obtained by the students was 56.27 out of 98 in our research (average level), our findings are more promising compared to the data reported by Davar and Heydenreich et al., which indicated the poor status of sports nutrition in adolescent athletes (9, 19).
The selection of the most appropriate sports nutrition requires optimal sports nutrition knowledge, and the knowledge level of individuals in this regard should be evaluated before the provision of nutritional training. Research is scarce on the sports nutrition of adolescent athletes compared to adult athletes (20), and basic information is not sufficient for proper decision-making as the issue is reported to be alarming in some developing countries (21). Nonetheless, some findings have indicated that athletes lack adequate knowledge regarding the use and role of protein in the body and are not thoroughly familiar with the requirements and benefits of the body for proper hydration (20, 22). These findings and other similar reports regarding protein are consistent with the results of the present study (questionnaire items 20, 29, and 31).
5.1. Conclusions
This is first study in regard sports nutrition in adolescent athletes in Iran. Although our research was conducted in Tehran (the most populous city and the capital of Iran) and other cities in Iran should also be studied, we expect an insignificant difference between the data obtained in Tehran and other cities. According to the results, the student athletes aged 15 - 18 years in Tehran lacked an appropriate level of knowledge and attitude towards sports nutrition, which highlights the need for effective sports nutrition education for adolescent athletes. It is suggested that physical education classes provide a suitable platform for education related to nutrition before, during, and after physical activity, besides PE programs. On the other hand, a large number of adolescent athletes sought information from their sports coaches and teachers, so it is better for sports coaches and teachers to continuously update their knowledge of sports and general nutrition, which can be done through knowledge-enhancing seminars or self-study.
However, the sports nutrition knowledge of the coaches of these athletes remains unknown to the researchers due to the lack of studies in this regard. Therefore, it is suggested that further investigations be conducted to assess the level of nutritional knowledge, attitude, and practice of sports coaches.

