


1. Background
Mountaineering has gained great popularity in recent years. What used to be an elite sport is now done by individuals of all ages. This popularity may be due to various reasons, such as media interest, increased competition, and the existence of indoor climbing walls. With the increasing popularity of mountaineering, the number of injuries and damages related to it has also experienced a significant rise. Over time, the global number of mountaineers and mountaineering locations has increased by approximately 50% (1). Fatigue is a risk factor in mountaineering resulting from the lack of proper central or peripheral nervous system functioning. In central fatigue, there is a disturbance in the central nervous system, and in peripheral fatigue, the peripheral nerves, neuro-muscular connection, or muscle contractile tissue are disturbed. Some studies also demonstrate that injuries mostly occur at the end of sports activity (2), showing the relationship between fatigue and the increased incidence of injuries. It has also been shown that fatigue affects several kinematic and kinetic biomechanical variables of the lower limb (3), neuromuscular factors such as reflex and co-contraction activity (4), and deep sensory function (5).
After prolonged walking, distal muscle fatigue is believed to cause long-term walking pattern adaptations, as revealed by increased heel loading and decreased toe loading, resulting in less effective dynamic foot function and being demonstrated by lowering the plantar arch (6). Subjects experiencing fatigue due to prolonged walking first show local muscle fatigue at the m. tibialis anterior, followed by instability of the gait rhythm, which is slowed to enhance local dynamic stability (7).
One of the effects of fatigue is a change in the sole-ground contact surface. The last anatomical structure of the body in the movement chain and the only structure in contact with the ground is the foot, which resists applied forces (8-10). Fatigue leads to reducing the longitudinal arch of the foot and straightening the sole, causing the bony structure of the sole to collide and the navicular bone to be closer to the ground; therefore, the bone alignment of the ankle, which is needed in the swing phase, takes a new arrangement, which leads to decreased mechanical advantage and also changes the muscle activity and the pressure distribution on the sole of the foot (11). These changes lead to decreased absorption and transmission of force in the longitudinal arch of the foot (12). The change in the bony alignment of the sole of the foot, along with the change in the electrical activity of its muscles during mountaineering, leads to a change in the pattern of absorption and power generation and causes pain in the sole during mountaineering, occurring following fatigue (13). As we know, foot pain and disability caused by feet are very common. Population-based studies show that 24% of people over 45 years of age report frequent foot pain, and nearly two-thirds report at least moderate disability related to their foot condition in some aspect of daily life (14). It has been shown that foot disorders and pain due to excessive fatigue can detrimentally affect health-related quality of life in a wide range of age groups (15). This fact is based on the assumption that changes in the foot's skeletal structure may lead to changes in walking patterns and overloading of bones and soft tissue structures, leading to pain in those areas (16).
Recently, the analysis of plantar pressure and pain assessment has been greatly developed in studies related to foot loading during movement. Examining the pain threshold as an analysis obtained from painful points on the soles of the feet is used to identify foot problems and has provided a new perspective in examining the causes of injuries. Thus, this method has been introduced as a suitable predictor for the occurrence of injuries. Deviant loadings and improper pressure distribution put individuals at risk of injury (17, 18).
2. Objectives
In this study, the plantar pain threshold in mountaineering was evaluated before and after a mountaineering session.
3. Methods
This research was a semi-experimental study with a sample of 35 mountaineers (20 men and 15 women) aged 20 - 35. The sample size of the present research was determined based on the statistical formula and G*POWER software and according to the previous articles with a power of 0.85 and a significance level of α = 0.05. The final selection of the subjects was based on the exclusion criteria, and 35 climbers were included in our research group. The intervention of this research was mountaineering carried out according to the determined conditions: The subjects were selected non-randomly in a purposeful manner based on the inclusion and exclusion criteria in the form of a climbing group where all people were included in the experimental group, and it was done as self-control, and the mean pain thresholds of the subjects’ soles were evaluated before and after the mountaineering program. This research was conducted on September 10, 2022, on the Tochal mountaineering route, Velenjak, Tehran. The mountaineering program included an eight-kilometer distance, a height of 1900 meters above sea level for the start and a height of 2480 meters at the peak point, and 3 hours of climbing at an average speed in clear weather conditions in the form of a climbing group. The tests were taken both before and after the program. Moreover, the mountaineers were not allowed to rest on the way back.
The inclusion criteria included having 1 to 3 years of mountaineering experience, having a moderate level of physical fitness, passing mountaineering training courses, being an official member of the Iran Mountaineering & Sport Climbing Federation (IMSCF), having proper shoes and backpack, no history of fracture in the lower limb, ankle sprain, and injury in the spine knee and ankle joints, and no history of abnormalities in the lower limb. The exclusion criteria included leaving the climbing incomplete for any reason, unwillingness to participate in the pre-test/post-test, the occurrence of any unforeseen event leading to a serious change in the climbing on the route, obtaining a score of less than 15 on the Borg rating of perceived exertion (RPE) (19), and descending by cable car or chairlift.
3.1. The Pressure Pain Sensitivity Map
3.1.1. Pain and Sensitivity Tests
Since there is no comprehensive and separate pain assessment method, the pressure pain threshold (PPT) assessment method was used in the present study. Using a manual pressure algometer (Sweden, Somedic Algometer®), a one-square centimeter stimulation surface was measured (20). The validity and reliability of this device are reported as 0.90 to 0.95 (21). A pressure increase rate of approximately one kilogram per second per square centimeter was used. As soon as the pressure applied from the pattern meter was felt as pain, the pressure intensity was considered PPT. This measurement was performed three times for each point, and the mean values of these measurements were used in subsequent statistical analyses. Consecutive measurements were made with an interval of 20 seconds. The PPT assessment test was performed using a manual algometer. Pressure is a measure with acceptable validity and reliability to assess pain sensitivity in healthy individuals and those with chronic health conditions (22, 23).
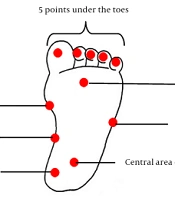
Pressure pain threshold was measured at 11 points for the plantar area for the pressure test, including 5 points under the toes and 6 points on the rear inner part of the heel, the central area of the heel, the medial longitudinal arch, the base of the big toe, between the second and third toes, and the base of the fifth toe, respectively (Figure 1). A handheld algometer with a contact surface of 1 cm was used for PPT measurements. The algometer was pressed on the skin at a right angle with a constant slope of 30 kPa/s.

Map of the foot
In order to measure the pain in the soles of the feet, the subject sat on a chair, placing his/her foot on the table in front of him/her; then, the device was placed on the points according to the map, and pressure was applied so that the subject felt and declared the pain, and the displayed number was recorded. Each point was evaluated twice in each step. In each step, different points of the soles of the feet were measured in random order. If the coefficients of variation of the two primary measurements at a certain point were above 0.2; the third PPT measurement would be performed. The mean score of these two measurements with a minimum variance was considered the PPT value of each point. Pressure pain threshold values for points with a coefficient of variation lower than 0.2 were considered the mean score of the first two measurements.
3.2. Statistical Analysis
The data were statistically analyzed using SPSS 24, and the normality of the data distribution was checked using the Shapiro-Wilk test. Since the data were normally distributed, parametric statistics were used, and the paired sample t-test was used to compare the data (α ≤ 0.05.)
3.3. Ethical Considerations
All subjects participated in the present study with full consent after filling out the consent form. Before starting the research process, all research steps and how to perform the test were explained to the subjects, and they were assured that their personal information and files would remain completely confidential and any of them could withdraw from the research at any stage without paying damages. It should be noted that the present research has the approval of the Ethics Committee of Shahid Beheshti University (code: IR.SBU.REC.1401.002), clinical trial (code: R000053893), and ethics approval from the Research Institute of Physical Education and Sports Sciences (code: SSIR.REC-2203-1558). This research was conducted in a controlled manner in the afternoon, any possible danger on the mountaineering route was checked so that it did not threaten the mountaineers, and all safety points were pointed out to the mountaineers. The mountaineers started their mountaineering program at the designated time intervals. They had the least rest in the post-test evaluation, were assessed in the order they returned from climbing, and were not allowed to rest on the way back. Some of the benefits of this research for the mountaineers were as follows: They were evaluated individually, the results of the tests were provided to them, a special training program was designed for each person, and the necessary recommendations were provided to improve their mountaineering performance.
4. Results
All the data obtained from the measurement process were subjected to statistical analysis. First, we described the characteristics of the research samples, including the total number, frequency percentage, mean, and standard deviation of the participant scores and the description of the variables; then, in the second part of the test, the research hypotheses were examined separately. The significance level considered to reject or confirm all null hypotheses in this research was P ≤ 0.05.
Table 1 presents the total number and frequency percentage of the gender of the samples, according to which a total of 35 people, 20 (57.1%) men and 15 (42.9%) women, were included in the sampling, with an age range of 20 to 35 years, while 9 people (25.8%) are between 20 and 25 years old, 14 people (40.1%) are between 25 and 30 years old, and 12 people (34.1%) are between 30 and 35 years old.
| Variables | Frequency (%) |
|---|---|
| Age (y) | |
| 20 - 25 | 9 (25.8) |
| 25 - 30 | 14 (40.1) |
| 30 - 35 | 12 (34.1) |
| Total | 35 (100) |
| Gender | |
| Male | 20 (57.1) |
| Female | 15 (42.9) |
| Total | 35 (100) |
Total Number and Frequency Percentage of Age and Gender of the Research Sample
In this research, the assumption of the normality of the data distribution was confirmed by the Shapiro-Wilk test (P > 0.05). Based on Table 2, the data concerning the variables of the plantar pain threshold (posterior inner part of the heel, the central area of the heel, the base of the big toe, between the second and third toes, the medial longitudinal arch, the big toe, the second toe, the third toe, the fourth toe, the fifth toe, and the base of the little toe) are not significant (P > 0.05). Therefore, it can be said that the data related to the below variables are normally distributed, and therefore, the condition of using parametric tests is established.
| The Pain Threshold of the Soles of the Feet and Indicator | Phase | |||
|---|---|---|---|---|
| Pre-test | Post-test | |||
| z | P | z | P | |
| Posterior inner heel | 0.097 | 0.869 | 0.119 | 0.200 |
| The central area of the heel | 0.106 | 0.576 | 0.134 | 0.116 |
| The base of the big toe | 0.084 | 0.405 | 0.091 | 0.200 |
| Between the second and third toes | 0.103 | 0.181 | 0.090 | 0.200 |
| Medial longitudinal arch | 0.071 | 0.863 | 0.123 | 0.200 |
| The big toe | 0.140 | 0.100 | 0.082 | 0.200 |
| The second toe | 0.100 | 0.232 | 0.073 | 0.200 |
| The third toe | 0.085 | 0.891 | 0.124 | 0.193 |
| The fourth toe | 0.087 | 0.032 | 0.098 | 0.200 |
| The fifth toe | 0.079 | 0.0230 | 0.090 | 0.200 |
| The base of the fifth toe | 0.118 | 0.200 | 0.138 | 0.092 |
The Results of the Shapiro-Wilk Test to Check the Normality of the Data Distribution Regarding the Research Variables
The paired sample t-test was used to investigate the difference in the pain threshold indicator in the soles of the feet of mountaineers in the pre-test and post-test conditions. The test results are given in Table 3.
| The Pain Threshold of the Soles of the Feet and Indicator | Point Estimate | The Difference in Means and Standard Deviation | t | P |
|---|---|---|---|---|
| Posterior inner heel | 1.67 ± 5.30 | 1.86 | 0.071 | |
| Pre | 0.315 | |||
| Post | 0.312 | |||
| The central area of the heel | 2.21 ± 5.34 | 2.44 | 0.020 a | |
| Pre | 0.414 | |||
| Post | 0.409 | |||
| The base of the big toe | 0.782 ± 4.29 | 1.07 | 0.288 | |
| Pre | 0.182 | |||
| Post | 0.180 | |||
| Between the second and third toes | 0.498 ± 3.78 | 0.779 | 0.442 | |
| Pre | 0.132 | |||
| Post | 0.130 | |||
| Medial longitudinal arch | 1.07 ± 3.98 | 1.59 | 0.119 | |
| Pre | 0.270 | |||
| Post | 0.267 | |||
| The big toe | 0.995 ± 3.32 | 1.77 | 0.088 | |
| Pre | 0.299 | |||
| Post | 0.296 | |||
| The second toe | 2.87 ± 2.87 | 2.26 | 0.030 a | |
| Pre | 0.383 | |||
| Post | 0.379 | |||
| The third toe | 0.576 ± 2.27 | 1.49 | 0.144 | |
| Pre | 0.253 | |||
| Post | 0.250 | |||
| The fourth toe | 0.458 ± 2.64 | 1.02 | 0.312 | |
| Pre | 0.173 | |||
| Post | 0.171 | |||
| The fifth toe | 0.623 ± 2.29 | 1.60 | 0.118 | |
| Pre | 0.271 | |||
| Post | 0.268 | |||
| The base of the fifth toe | 0.609 ± 2.80 | 1.28 | 0.207 | |
| Pre | 0.217 | |||
| Post | 0.215 |
The Paired Sample t-Test Results for Intra-group Comparison of Foot Pain in the Pre-test and Post-test
The paired sample t-test results in Table 3 show that the difference between the pre-test and post-test mean scores of the central area of the heel and toe is significant (P < 0.05). Considering that the pre-test mean scores of the two indicators of the central area of the heel and toe are two times more than their post-test mean scores, it can be concluded that after the mountaineering session, the pain threshold in the two central areas of the heel and toe is lower than before.
5. Discussion
The present research aimed to compare the effects of fatigue following a mountaineering session on the pain threshold of the soles of the feet. Our findings show that pain in the soles of the feet and pain threshold undergo changes, leading to a reduced pain threshold. Foot function may be associated with foot pain and walking disorders. However, these relations vary depending on the points of the soles of the feet. In particular, the pain threshold was reduced in all parts of the soles, but it experienced a greater reduction in the central area of the heel and the second toe, showing that the most forces were applied to these areas. This issue should be paid attention to when designing shoes, resting, and taking measures to relieve fatigue to hinder the reduction of the pain threshold in these areas and achieve optimal performance for mountaineers to prevent further injuries and risks.
Results showed a significant negative effect of fatigue on the reaction times and their consistency, with longer reactions (1.5% changes) and lower consistency (14.7% changes) after the Wingate test (20). Muscle fatigue is defined as a decrease in maximal force or power production in response to contractile activity (21), which can originate at different levels of the motor pathway and is usually divided into central and peripheral components. Peripheral fatigue is produced by changes at or distal to the neuromuscular junction. Central fatigue originates in the central nervous system, decreasing the neural drive to the muscle (21, 22). Specifically, metabolic factors and fatigue reactants during contraction, such as hydrogen (H+) ions, lactate, inorganic phosphate (Pi), reactive oxygen species (ROS), heat shock protein (HSP), and orosomucoid (ORM), also affect muscle fatigue (23).
Central neurotransmitters, particularly 5-hydroxytryptamine (5-HT), dopamine (DA), and noradrenaline (NA), play an important role during whole-body exercise and fatigue; 5-HT has a negative effect, whereas methylphenidate, a DA-releasing enhancer and reuptake inhibitor positively affect exercise performance. The so-called central fatigue hypothesis states that exercise induces changes in the concentrations of these neurotransmitters, and fatigue arises from changes within the central nervous system (or proximal to the neuromuscular junction) (24).
The strength and timing of contraction are controlled by motoneuron firing. When first recruited in a healthy system, motoneurons usually fire at 5 - 8 Hz. During brief non-fatiguing voluntary contractions in humans, the mean motoneuron firing rates are 50 - 60 Hz (25).
Slowing or cessation of motoneuron firing contributes to the loss of force that marks fatigue. Motoneuron firing is influenced by intrinsic changes in the motoneuron properties, descending drive, and afferent feedback. During fatiguing maximal contractions, motoneuron firing rates decrease because (1) repetitive activation (repeated firing) of motoneurons leads to a decrease in their excitability to excitatory synaptic input; (2) the excitatory drive from the motor cortex or other supraspinal areas to the motoneurons is lower (26); (3) the firing of group III/IV muscle afferents is increased (27, 28), thus decreasing motoneuron firing; (4) the firing of muscle spindles (sensory receptors) is decreased, thus decreasing firing of group Ia muscle afferents, increasing presynaptic inhibition, and finally decreasing motoneuron firing (29, 30); and (5) group III/IV muscle afferents also exhibit feedback interaction with cardiovascular and respiratory processes via the autonomic nervous system, thereby improving muscle blood flow and oxygenation and consequently slowing the development of fatigue of the muscle itself (26).
Anatomically, the talus receives 50% of the body weight when standing on two legs. About 50% of the load received by the talus is transferred to the calcaneus through the posterior subtalar joint, and the other 50% is transferred to the front through two general routes (31). In some references, it is stated that the heel bears 2 to 3 times more weight than the forefoot, and in some others, it is believed that the heel is involved in bearing the weight, in addition to the forefoot (32). According to what was mentioned, there are controversial results regarding the pressure distribution in the standing position. According to some articles, the reason for these discrepancies is that the amount of weight distribution in the anterior and posterior areas varies depending on the individual’s lateral deviation while standing on the measurement screen, which is brought on by differences in heart rhythm, breathing, or obstruction of blood circulation in the leg. Some individuals lean forward while standing, and others often lean backward (33). In addition, based on the claim that static radiography predicts only 65% of dynamic pressure (34), it can be concluded that although there are many studies regarding the normal distribution of plantar pressure in standing position, due to the distribution of body weight between two limbs, less pressure is applied to each foot in the standing position. It should also be noted that walking dynamics is one of the effective factors in determining the pressure of the soles of the feet.
Examining the variables related to walking showed that the heel, the heads of the metatarsal bones, and the big toe had the highest pressures, and the lowest pressures were in the second to fifth toes and the median area of the foot, which was inconsistent with our research. The anterior, posterior, and median areas had the highest percentage of contact with the surface. The pressures in the median area were lower than in other areas, and among the metatarsal bones, the pressure on the head of the second metatarsal bone was higher than others. In these studies, the areas with the highest pressures were under the heel, front of the foot, and the toes, respectively, and the second to fifth toes and the median area of the foot had the lowest pressures (35). When the foot hits the ground, the heel bears a large amount of load. The heel pad has little stiffness under normal loading conditions; however, with more loading due to the entanglement of collagen fibers, the movement of fat tissue is limited and causes an increase in the stiffness of the heel pad in the natural direction. Such structural differences in the heel compared to other areas of the foot cause the soft tissue of this area to become thicker (36). For this reason, the first pressure peak occurs when the foot hits the ground and in the heel area, where it has a high resistance to pressure. After the heel, the body’s weight is transferred from the middle to the front of the foot. The weight passes through this area quickly, and one of the possible reasons for this is the reduction of the contact surface of the median area of the foot, causing a greater decrease in pressure in this area than in other areas (32). The high pressure in the head of the second metatarsal bone is because it has an important role in weight transfer compared to other metatarsal bones due to its special characteristics. The strong connection of this bone with the median area of the foot and being longer and thicker has caused a strong base to be created in the anterior area of the foot, and this metatarsal bone bears more weight and higher pressure than other bones of the sole of the foot (37). Among the toes, the big toe is involved in carrying more weight than the others. The reason for this can be due to the fact that the big toe is larger and more mobile than other toes (35).
Yan et al.’s studies are both inconsistent with this study. Based on the results reported in this study, the big toe has the highest pressure compared to other areas, followed by the second metatarsal bone, heel, and other metatarsal bones (38). Asians have been found to have wider front feet, shorter longitudinal arches, and more rounded feet. These factors can cause the pressure to be distributed in a wider area. As a result, the maximum pressure in the anterior part of the foot is lower than the posterior part in the Asian population (39). This discrepancy seems logical, given that the current investigation was conducted in the Iranian population. On the other hand, it is stated that the data collection method also affects the pressure distribution investigation results. In contrast to the current study, which was carried out using the intermediate step method, Mirbagheri et al.'s study was based on the primary step method. According to the conducted research, the heel pressure with the primary step method is about 7.4% less than that with the intermediate step method, while the pressure in the forefoot area with the intermediate step method is about 7 - 13% less. No significant difference was found in the comparison of average foot dimensions, percentage of static pressure, percentage of contact, and maximum pressure during walking between the right and left feet (37). Research indicates that pathology is one of the factors of change in the symmetrical loading pattern (35). Since the standard foot examination form was used in the present study for the same examination of both, any asymmetry and pathology were excluded.
5.1. Limitations
The present research had some limitations. The first limitation was that due to the conditions of the coronavirus disease 2019 (COVID-19), conducting the test in mountainous conditions, and the non-cooperation of mountaineering groups, it was not possible to include more individuals in the research. Another limitation was the lack of control over air humidity, temperature, and soil conditions, which were considered disturbing variables. However, the shoes of all mountaineers had special standards for climbing shoes so that the way of distributing pressure on the soles of the feet was the same for all people.
5.2. Suggestions
According to the research findings, fatigue can change mountaineers’ sense of knee angles, ankle joints, and pain thresholds, which can increase their risk of injury and fall. It is suggested that to improve the mountaineers’ physical condition and prevent injury, appropriate shoes and insoles should be used that distribute pressure proportionally in all parts of the soles of the feet, as well as exercises to improve the sense of joint condition. It is also recommended that resting spots are placed on the way back for mountaineers to take rest during these times to get rid of fatigue to some extent by massaging them so that they have optimal performance in mountaineering.
Some suggestions for other researchers are as follows:
(1) Performing other methods of measuring the proprioception of the lower limb joints.
(2) Designing the exercise protocol in another research to examine the results before and after the implementation of a mountaineering program.
(3) Investigating the effect of using different types of insoles and shoes on the amount of pressure distribution and the threshold of plantar pain in mountaineers.
(4) Investigating the proprioception and the plantar pain threshold in elderly people in another research.
(5) Using a more accurate mechanism to determine the level of fatigue in another research.
(6) Investigating the gender differences between male and female mountaineers in another research.
(7) Investigating the sense of joint condition in another research, which is similar to the assignment, from other angles.
(8) Investigating longer routes with different slopes in another research.
5.3. Conclusions
The results of this research lead to the determination of pain threshold values in young mountaineers with normal feet and a normal range of motion. This range can be used to compare pressures in climbing and resting conditions and to investigate any risk of falls and injuries, such as ankle or knee sprains. Nevertheless, it is important to emphasize that sufficient care should be taken when using this reference range, and all clinical conditions of the participants should be considered for the final decision. Understanding foot biomechanics is important in determining specific needs in all age groups, both in men and in women. The study's results suggest that the areas experiencing the most pressure should receive extra consideration when designing insoles and shoes.
